


MMagTech
Members
-
Joined
-
Are you running NVidia by chance and using hardware transcodes? My Plex and Emby wouldn't start after upgrading to 7.2.5. Ended up needing to update the NVidia Plugin and also downgrading the NVidia driver version. Here another case of someone having the same issue with Emby and the fix. Also discussed here in the threads. https://emby.media/community/topic/147554-unraid-nvidia-bug-after-update-to-725/ https://forums.unraid.net/topic/98978-plugin-nvidia-driver/page/234/
-
Thanks for the guide. Was having trouble with SpaceInvader's video. This guide is straight to the point and got me up and running. I just had to add labels in the compose for Traefik as my reverse proxy.
-
See Q24 at this link https://github.com/binhex/documentation/blob/master/docker/faq/vpn.md
-
Is the Plex log you posted rhe Crash Report the log mentions? If not would help to post that as well.
-
To use the mover script do I point to just the folder or to the folder/file name? Also, is a preexisting user script the correct format so I could just turn off the schedule for it and point mover tuner to that? I'm utilizing the scripts to stop my torrent container before mover and restart afterwards so that seeding torrents are moved to the array.
-
I'm using wireguard via PIA. My IP and port keep changing and each time this happens seeding stops. Is there any action I can take to correct this behavior?
-
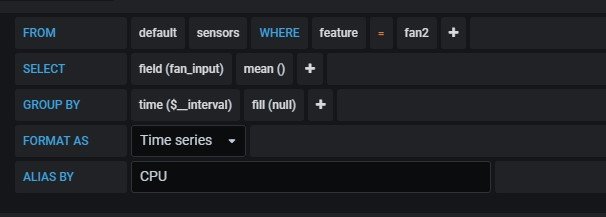
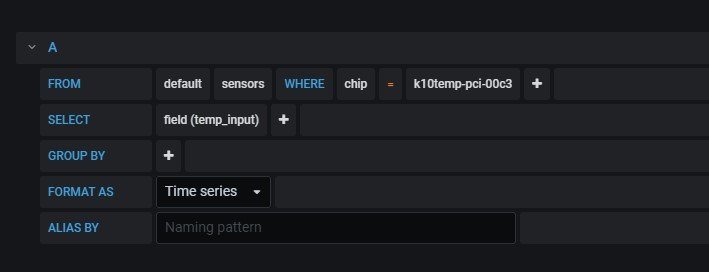
Here are some screenshots of what I had to use with my 3900x to get fan RPMs and CPU Temp
-
I'd like to know what you come up with if you do. I just got prom/node-exporter setup via docker and communicating with prometheus. It includes a collector for hwmon which according to documentation is where amd_energy is pulled from. However, in grafana when I select prometheus as the data source for a panel I can't find any hwmon that shows or references amd_energy. I know prom/node-exporter is working because all the other collectors are showing in prometheus including a lot of hwmon ones. Edit: Should also add that I am running 6.9 Beta 29
-
Not the dev but can chime in. You need to install Grafana, InfluxDB and Telegraf from the Community Apps. Then follow the setup steps on page 1 for each app. Once those are setup there's an option in Grafana to import the json for the panel.
-
MMagTech changed their profile photo
-
Still cranking away at modifying your dash and loving it. Learning so much. I was messing around with the Grafana Unraid Stack from testdasi, maybe GilbN here from what I see, and really like the addition of logs on their. I was able to get syslogs onto your dash also. Do you have plans to implement logs as an optional step since it would require other community app dependencies? I think the addition of logs would really suite the dash. In order to get the logs working in Grafana I had to install grafanaloki and grafanapromtail from community apps. For Promtail I had to add a path with host as root and container as /rootfs for it to read the log directory. I used testdasi's config as a basis with slight mods for the default location of promtail position location and loki's index and chunks. From their I used the same loki queries for the panels as in GUS {job="unraidsyslog"} and {job="unraidsyslog"} |~ "(?i)error[:,]|[:] disabled|(?i)BTRFS error|failed command". I believe you two may be already collaborating together so maybe this is something they wouldn't mind. Attached are the modded configs I used. config.yml local-config.yaml
-
Really liking the way your going with this. Can't wait to the final product. I love all the growth trends for the media. This week I've been messing around with mvantassel/deluge2influx and used dockerhub to automate a build of it. I used a local docker of deluge to remote to my seedbox and the deluge2influx points to the local instance. Learned of the trick to monitor a seedbox running deluge with a local instance from https://alexsguardian.net/2019/03/31/deluge-influxdb/
-
Awesome deal. Will do the above before sharing. Thanks!
-
Thanks for the work. Coming over from Reddit from a post you commented on. On a few groups I belong to people have asked if I’d share the dash I made. It was heavily based on yours with other stuff added so, I don’t feel right sharing it without asking if you mind? I’ll make sure to add a mention to this forum in the description or some other way if you have a better idea.
-
I have the speedtest tracker docker running and it's working well with Organizr. However, I'd like to utilize it for a Grafana Dashboard that requires speedtest-cli and the below added to telegraf. I believe the reason it's not working is because the "/usr/bin/speedtest -f json-pretty" needs to be changed. Any ideas on how to change this for unRAID? # # Install speedtest cli from SpeedTest.net first # https://www.speedtest.net/apps/cli # # And then run speedtest once to accept the license # [[inputs.exec]] commands = ["/usr/bin/speedtest -f json-pretty"] name_override = "Speedtest" timeout = "1m" interval = "5m" data_format = "json" json_string_fields = [ "interface_externalIp", "server_name", "server_location", "server_host", "server_ip", "result_url" ]
-
Loving GUS as I never could get a stack working before. I see you mention it's compatible with UUD. How would a go about adding UUD? I don't see the option to add a new dashboard.


