


codefaux
Members
-
Joined
-
Last visited
Everything posted by codefaux
-
(Snipped for brevity) What does "some trouble" mean? Were you unable to delete things you should have had the rights to? How did you resolve it? What other actions did you take after it would not delete? (ie; closing/killing the container, recreating the container, reading logs, etc) When you copied the folder, was the container still running? This is a Very Bad Thing(tm), as files are not in a "ready to be archived" state during operation; lock files exist which should not, temporary files exist which are not necessary, in-progress operations can be clipped, files are very much not properly committed to disk (ESPECIALLY with a database engine) etc. The -first- error you mentioned indicates that DBAL was unable to connect to the database. PHP was working, or DBAL would not have been running. DBAL was working; it was merely unable to connect to the databse, which is not an internal failure to DBAL or PHP. This was your indication that the database was your first problem. Changing the PHP version was not a good idea and not relevant to repair, and it should be changed back. The actual error is indicated in your DB message. `"mysqld was not shut down properly last time and critical recovery information (last binlog or tc.log file) was manually deleted after a crash"` -- aka, you copied a bunch of files from a running databse system and later restored them by erasing the existing files and copying the "while-running" files back, or it crashed and a bunch of files were lost/damaged. (PS: Never, ever restore database files over other database files after an update/downgrade; between versions, database engines and software using databases sometimes make broad, sweeping changes to database structure and/or database layout. Simply wiping and replacing the files does not prepare them to be understood by a different version. Sometimes this is safe, when it isn't it breaks absolutely everything. It's not worth the risk.) `How can I do this within the container? -> start mysqld with --tc-heuristic-recover switch to commit or rollback pending transactions` Before I answer that part -- this may or may not actually be a good idea now. After having so many things changed, and doubtless changes have been made which you have not mentioned, the system is in a very unknown state. Someone needs to sit down with you, talk over everything you did, decide if any of it needs to be reverted (and in what order) and settle the best next action from that point. That said -- Given that this is an all-in-one container, mysqld is instantly restarted as soon as it goes down. As such, this container can not be used to fix this problem. It is possible for an experienced database/Docker user to use a mysql container with your cleanest copy of the database files to recover from this situation. If you're that user; - You need to create a new container using the same mysqld (or mariadb, I haven't checked) version, using the same database config file this container does, with the same volumes mounted to the same places. - When launching the container, you need to override the startup of the container to instead run only a shell. - Manually launch the database daemon with the `-tc-heuristic-recover` flag added to the usual start-up command. This could also be done using WSL or a Linux boot medium, the process is more or less the same, and definitely not approached by someone who doesn't understand what's going on. TL;DR -- find a pro, or wipe it and start over.
-
Super great work getting it all working in one box. Two notes. Respectfully; I strongly suggest putting this in the Template's "Overview" section for the Container Template itself. None of this is intuitive or safely assumed. There's no limit on how much text you can put there, and you already have sections for configuration -and- notes there, which are also required to set up the container -- but not listed in the Install text above. Putting this information all together and in the Overview would remove "go to the Support forum for more information" from the unlisted requirements to using this container. Also, regarding "Change the data folder to /data" -- why not just bind the user's data volume to `/config/www/owncloud/data` (which is OwnCloud's actual default) instead? If the template default is to bind to `/config/www/owncloud/data` instead of `/data` new users don't need to change the data folder, it will simply "just work" without that step. The user won't see any difference. Presently, if the user doesn't know to do this or misses/misconfigures this step, their database gets wiped when the container updates and they just suddenly lose stuff.
-
I'm not sure what the question on the first line was, seems like it got deleted. Your terminal is configured to behave as an xterm supporting 256 colors. xterm is an xorg terminal emulator, and does not support automatic blanking / blanking control via the routes a direct console terminal does, as inidicated by the "not supported" part. setterm is designed to comminicate behaviors to hardware terminals, not software ones (like xterm, screen, tmux, ssh, etc) and thus cannot set or unset powersave mode or blanking as indicated.. If you're using screen or tmux from a hardware terminal and they're using xterm-256color due to misconfiguration, the two are terminal emulator shells which cannot be controlled by setterm in any way, and they must adhere to the actual terminal's properties. IE, setterm before screen or tmux. If screen or tmux are doing blanking, configure them directly, setterm does not impact their behavior. If you're using xorg, setterm will not prevent xorg blanking, as setterm is meant for a hardware terminal connection, not an x session. That requires different commands which aren't applicable here. If you're using ssh, it shouldn't -be- blanking unless one of the other layers is adding it, but just for the written record, setterm won't work over ssh either.
-
OK but I need you to understand that the dd is specifically done in my suggestion for a very direct and considered purpose. When doing parity calculation, two exactly identical drives are nullified, and can be remove from any parity-protected array while preserving parity data. That's why I'm seeking people with experience in what I'm trying to do. The dd is critical to my intent; not having to do another parity sweep, after replacing my drives and migrating my data. Second, I stated that my intent is to migrate the data off of the drives before beginning this entire process. The drives will have no important data on them. I just want them out of the array without doing a parity sync which is entirely possible, if I can figure out how to get the array to start or bring up shfs without those two drives mountable. I don't need someone to refine my intent, or correct what I want to do. I don't need advice on how to proceed. I need advice from someone who understood everything I've said, and knows the answer. I need someone who can tell me if there's any way to start the array or bring up shfs without those two drives mounted. I sincerely and greatly appreciate the efforts of anyone willing to so much as read this all, but if you don't have the answer to my question, you're wasting your time. My time isn't worth anything, I'm the one asking the favor.
-
My primary concern with using dd on a live system is that I need for Unraid to not have those drives mounted. I can remove them from shares, but I suspect shfs still mounts the underlying filesystems. With a filesystem mounted, a dd on the underlying partition can leave the kernel [writing to | reading from] the disk still before it realizes inconsistency, and that can cause panic and/or just random bytes written on the disk I'm trying to mirror. The secret sauce to option 3 is, I think, figuring out how to prevent it from being mounted when starting the array, which `wipefs -a` will accomplish, but I'm not clear on wether Unraid will allow the array to start in this state -- it's an odd mix of "new disk" and "unexpected configuration" that will probably cause issues. I may just need to build a VM with a ton of empty disks and see what happens when I poke it while it's running, rather than theorizing.
-
I assume you mean the Unassigned Devices plugin by dlandon? I'm familiar with it, but that doesn't prevent me from needing to do a full parity rebuild, which is my primary goal.
-
This is not helpful. I would love to have over two thousand dollars to burn on hard drives and just make it done right now. I'm not talking about days for these upgrades. I'm talking about years. It takes several months for me to afford a spare drive right now. I need for people willing to discuss the details of the options I presented. I'm looking for discussion of the inner workings of Unraid, its technical and presentational response to the actions I considered. Deep knowledge. Experience with the things I discussed. The literal most obvious solution has been considered and discarded, as well as the next few. If you can't provide that thing, please don't waste your time trying to answer this. If I've put you off and you can provide that information, I accept that but I was pretty clear about my ask.
-
Before I start -- If your reply is going to be in the format of "Suck it up and do Option One" I would rather you left the thread clear for replies more directed toward my actual questions than airing criticism of my decisions. I know how it's Supposed To Be Done(tm) but have my own excuses for not doing it that way. While I will explain my reasoning, I'm not here to defend them; I'm here to discuss the nuance and methodology of the other options with users interested in or experienced with fiddling under the hood manually, and to document my experiences with it, for the goal of helping the next fellow like myself. Hi all. I'm a long time Unraid user, I spend literally most of my time under the hood of either this server or one of my other spares. I need advice from some deep knowledge folks. When I'm done I'll try to rework this post to share some of that deep knowledge for similar-seekers. It is, after all, our way. If you're looking for the path to my goal, it's edited at the bottom of this first post IF I have found it. (It isn't. Yet.) My server has grown to too many disks, and I'm looking to prune it. Power demand and parallel disk IO loads are getting a bit out of control. Too many SAS cards, can't add a second 1650 Super for transcoding without losing my 4x NVME-PCIE bifurcation card for the Docker containers and game servers. Homelab problems, am I right? Thusfar, I've got a 16tb disk replacing a single 3tb disk in-system. Data rebuild in progress, properly emulated, all is happy because Unraid is awesome like that. I -need- to get the 16tb up before removing the other two 3tb disks because they're pretty full and I don't have 6tb spare elsewhere. After this disk comes online, I intend to remove another two disks. My next few upgrades will be the same -- install a single 16tb drive with the goal of removing three 3tb drives. Obviously step one is remove the data from the disks. From here I know of three options, but I only know how to accomplish two. What I'd like is for a sanity check (I've got time for advice before I can act, lol) and possibly a solution for Option Three from an experienced poweruser, maybe even a dev. Option One: The Unraid GUI End User way -- Remove the two drives. New Config, rebuild parity. - I don't want to do this. This means a 16tb parity rebuild, removing two 3tb disks. Option Two: "The Math Works Out(tm)" -- In parity calculations, two identical disks cancel each other out. - This means no parity rebuild, just downtime during the 3tb disk-to-disk clone. - Here's my plan in Maintenance Mode. We'll pretend I'm using /dev/sda and /dev/sdb as disks to be removed, for simplicity. 1 - Enter Maint. Mode (obviously) 2 - Wipe filesystem and partition table identifiers (same uuid on two filesystems can cause problems) and clone drives wipefs -a /dev/sd{a,b}{1,} dd if=/dev/sda of=/dev/sdb bs=32k 3 - Stop array, New Config, trust old Parity. Option Three: "The White Unicorn" -- same as Option Two, but while the array is fully running, NOT in Maintenance Mode. My sole idea on how to accomplish this is -- - Enter Maint. Mode - wipefs -a so drives can't be identified - Stop Array, Start Array -- Will the drives present as two new disks? Maybe? Unmountable and prompting to format? Or will Unraid refuse to start? - Run dd between disks while Unraid runs. Is this a thing? Is there any other way to bring up shfs with the two drives unmounted, but keeping them in md for parity? Thanks in advance.
-
That doesn't support any of the other metrics from any of the other dozen or so scripts at the link I mentioned, a few of which I'm interested in/using now manually. That's why I suggested adding the text collector as a supported feature on the plugin by default. It won't impact anyone except people who want to use it if it merely watches a folder for scripts to execute. Could you be bothered to explain why? I don't mean to sound dismissive or aggressive or anything, but would you follow a recommendation from a stranger with no justification or explanation? I'm not looking for suggestions; I'm not the plugin author here lol I'll allow them to be run from anywhere you require them to be placed. I'm suggesting that you add in support for the text collector to your prometheus_node_exporter plugin, since prometheus_node_exporter already supports it. I'm suggesting where you should place them. You disagree; place them anywhere you like.
-
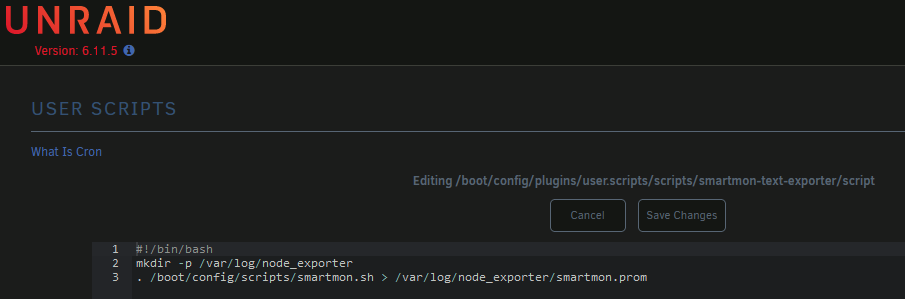
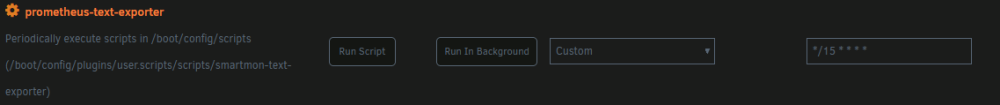
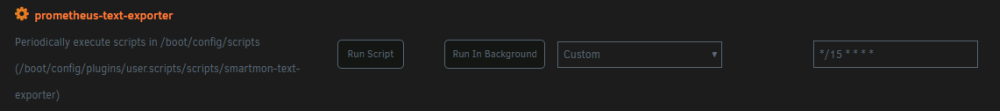
Could you be convinced to add a variable to pipe stdout to a specific path? My target: prometheus_node_exporter contains a textfile collector. There are a handful of community scripts designed to - be run from cron (ie your plugin on a custom schedule) - collect useful (I'd argue critical) system metrics (ie smartmon stats like temps and failure indicators) for prometheus-node-exporter - output data to stdout, to be piped to a file The inconvenience is, to use these is not straightforward. They would require extensive modification most users can't grok. Thanks to your plugin, an alternative is to manually save them to disk someplace, then use your plugin to write a script which runs them with stdout piped to a file, scheduled cron-alike. EDIT: These are the same script, ignore the name difference I used an old screenshot for the one by mistake This is workable but some users may still find this unapproachable. If the user could paste the entire script (in my case, /boot/config/scripts/smartmon.sh aka smartmon.sh [raw] among others) into a User Script, schedule them as cron-alikes, and mark their output to be sent to a specific path, it would make these more approachable. It could be implemented similar to the variables you've recently added; an STDOUT variable could be changed to request redirection. Regardless of your decision, keep up the great work. The plugin has been quite valuable for many of us!
-
Hey here's another suggestion for an easy addition full of feature delivery. There exists a handful of community scripts to ammend data provided by node_exporter. Most of them seem to be intended to pipe to a text file and read via node_exporter's textfile collector. The metrics go into a file wherever, then to the exporter as a launch parameter, you add `--collector.textfile.directory=/var/lib/node_exporter` for example, and all of the readable files within /var/lib will be exported as metrics if they're in the correct format. For example, smartmon.sh writes smartmon statistics such as temperature and unallocated blocks. nvme_metrics.sh might be of interest, btrfs_stats.py, maybe even directory-size.sh for some folks. The most simple way I can think of is for your plugin to create a directory in the ram filesystem at /var/log and add `--collector.textfile.directory=/var/log/node_exporter` and suggest users execute the desired scripts, writing into /var/log/node_exporter in per-script files. I can see two ways of doing this. - One, users copy script files to someplace like /boot/config/scripts (one-time write for the scripts, no flash wear) and execute them via the User Scripts plugin as such; Scheduled similarly; The /var/log filesystem will exist on any system, won't cause flash wear, is wiped on reboot. The path should have plenty of space for a few kb (or even dozen MB) of metrics being rewritten every few minutes. If it doesn't, failure case is that logging fails on the system -- not ideal but it's mounted with 128MB by Unraid and should never be near full unless a user has a serious problem elsewhere. If it's filling, the absense of this plugin's proposed metrics won't prevent it or even delay it by much. These metrics are designed to be overwritten, not appeneded, so they should never grow more than a few dozen MB in the most obscene scenario. Plugins seem to run as root, so permissions shouldn't be a problem. I'm also going to ping the user scripts developer to allow stdout to be piped to a file per-script, so users can simply paste the scripts into User Scripts and forward the stdout, instead of needing to save them to /boot/config/scripts manually and write a User Script to run it manually.

-
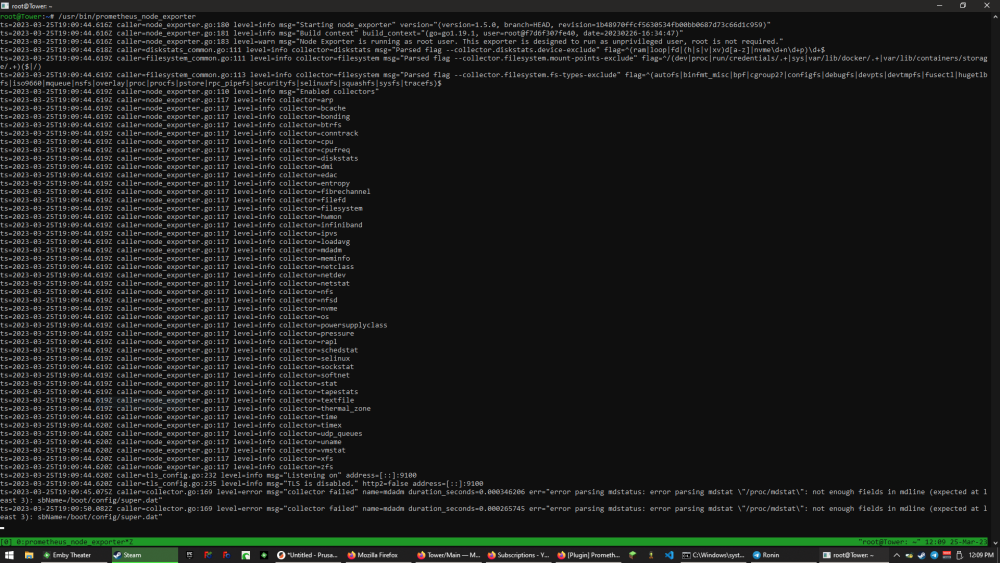
Might be worth running it from the console to see if there's any ignored error spam like in my comment. Could be an error being dropped instead of forwarded to system logs, like on my (and everyone else's) system using the Node Exporter.
-
lol it's ok, I was just very confused. I'm not even using the Docker containers, I JUST needed the exporter; I'm running the rest on another system. That's the main reason I went into this so sideways; I only wanted the exporter, but it had all these extra steps and I had to assume which went to what. I did so incorrectly, but that's ok. For sure! I thought the file went with the plugin, that's all. Yup, but I didn't know that and it was all in one giant block so I assumed (incorrectly) and here we are, lol That's very much what I had expected, literally everyone using this plugin is silently ignoring repeated errors because the stdout isn't directed anywhere people know about... Synonymous with "remember that" -- it's something you say to people who know the thing you're about to say. COMPLETELY did not know that, but given the reply upstream that does not surprise me anymore lol. I'll remember that. Since the logs aren't kept, it won't be filling up a logfile. I haven't restarted my array in a few months and I don't intend to soon, so I'll likely just leave them running in a detached tmux until the issue is properly resolved. I'd already opened a bug report upstream, I'll link them here and add this information but it seems for now the best bet would be to patch the plugin to disable the md collector on your end. Edit: Github issue https://github.com/prometheus/node_exporter/issues/2642
-
I already explained that, but I'll be more verbose. I downloaded the plugin before I wrote its config file. You wrote the instructions. Steps four and five. I did not perform steps four and five until after I had installed the plugin. I also did not do anything beyond those steps, regrading modifying settings, configuration or parameters. There's no "restart" control that I could find, and I didn't feel like restarting my entire server (or the array and all of my services) simply to restart a single plugin. Thus, I used the console, killed the running process, and restarted it by hand. No custom parameters, I didn't change some settings. You'll note that I never said there was a user-facing issue, or that I couldn't connect or report metrics from it. It functions just fine, but on my system it's burping a line at the console about an internal (non-critical) error, every time Prometheus connects to it and retrieves metrics. The only difference between now and if I uninstall/reinstall/reboot is that the errors will be sent to a logfile someplace or discarded entirely -- I have no idea which -- instead of being sent to the console, since I ran it by hand. What I'm realizing though, is this is above your head, so to speak. If you run it by hand yourself, does it throw an error every time Prometheus polls it? I'll file a bug upstream with the actual node collector's maintainer, as it's now clear to me that the actual collector is mishandling the output of /proc/mdstat on my system and it has nothing to do with the small wrapper plugin you wrote. Mmmmmmm no, though. It's not "only meant to be installed." It's meant to be learned about, your system is meant to be manually prepared for it, and then it's meant to be installed. Steps four and five could/should be handled by either the previous step's container, or this plugin itself if it notices the configuration file is not present. Furthermore, installing the plugin starts the collector, which already expects the config file to be present, so steps four and five should actually be before step three. If the installation process weren't so complicated, I would've noticed that this wasn't your problem earlier. I installed the plugin by finding it in the CA app and going "hey that does what I need" and then discovering that it wasn't working. And in NO situation do you merely "install the plugin and that's it" so that's just a flat inaccurate thing to claim.
-
Literally just run the binary from the ssh terminal. I hadn't written its config file yet so I noted how it was executed, killed it, wrote the config file, and executed it by hand in a terminal.
-
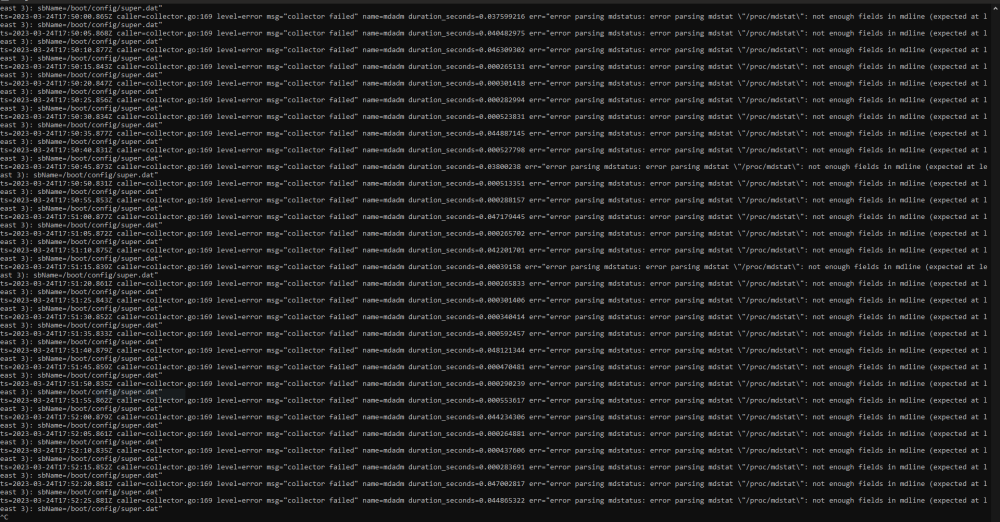
Bug report. Prometheus Node Exporter throws an error every single time it's polled by Prometheus. EDIT: As of version 2023.02.26 -- first time using this plugin, unsure when bug first appeared Text is; ts=2023-03-24T17:51:45.859Z caller=collector.go:169 level=error msg="collector failed" name=mdadm duration_seconds=0.000470481 err="error parsing mdstatus: error parsing mdstat \"/proc/mdstat\": not enough fields in mdline (expected at least 3): sbName=/boot/config/super.dat"
-
Glad you solved it, something to always keep in mind when building a system. To the general public who winds up here looking for similar solutions; (Posting it here because they won't go back and experience it like you did. Seriously not trying to rub it in. This needs to be seen *anywhere* the conclusion is "overclocked RAM" and is *NOT* JUST FOR RYZEN SYSTEMS but they do it worst. We've had this talk, I know you know.) Never overclock RAM, at all, regardless of what it says on the box, INCLUDING XMP, without testing it. Gaming system, Facebook system, ESPECIALLY A SERVER. XMP IS OVERCLOCKING. I'll say it again because people argue it so much; before you argue, Google it. XMP IS OVERCLOCKING. It's a "factory supported overclock" but it IS OVERCLOCKING, and you HAVE TO TEST FOR STABILITY when overclocking. Read Intel's documentation on the XMP spec. I DO NOT CARE if your BIOS defaults it on, VIGILANTLY turn it back *OFF* unless you're going to run an extremely extended *(DOZENS OF HOURS) RAM test when you're building a server. RAM overclocking leads to SILENT DATA CORRUPTION, which is *RIDICULOUS* on a SERVER, which is explicitly present to HANDLE DATA. I should also note that I personally have never seen a literal server-intended motherboard which supports *any* means of overclocking, and I feel like that's due to the causal link between overclocking and data corruption. Overclocking server hardware is NOT a good decision, unless you also test for stability. Overclocking RAM without testing it is literally identical to knowingly using a stick of failing RAM. You're running a piece of engineered electronics faster than the engineers who built it said to, often at higher voltages than it's designed for, to get it to go fractionally faster. Does that move a bottleneck? Not even a little bit, not since the numbered Pentium era. It HELPS on a high end system, IF YOU TEST IT THOROUGHLY, but I would NEVER overclock RAM on a server. I feel like NOT having silently corrupted data on a randomly unstable system is better overall than "the benchmark number is a little higher and I SWEAR programs load faster!" Stop thinking overclocking RAM is safe. Stop using XMP on "server" systems. Any potential speed gain is not worth it. Be safer with your systems, and your data.
-
It's important to understand what the options are and why. Turbo Write updates parity by reading the block from every disk in your array, doing math, then writing to parity. This requires all of your disks to be spun up. Some people run spun 24/7, some drive models will refuse to spin down, etc etc -- Turbo Write is faster but only if it doesn't have to wait for a disk to spin up. The non-Turbo write updates parity by reading the block from parity, doing math to change it to what it should be, and writing it back. This works even if most of your drives are spun down, but can slow things down due to the time it takes to update parity. The Auto Turbo Write plugin switches back and forth depending on wether or not your disks are all spinning. It technically should not cause any negative effects, and technically should use the best case at all times, but nothing is perfect. It's unlikely you'll need/want to remove it specifically unless you know better. Parity corruption only happens when a disk is written to but parity is not updated, or when a data path is corrupted in transit (bad RAM/etc) or when a disk is failing somewhere. Hard shutdown, direct disk access outside the array, improper procedure repairing filesystem damage, etc etc..
-
I know this is late, but the Unraid boot media should contain memtest and a boot entry to reach it unless the end user manually removed it. I can understand not noticing it, it's in a text menu that only shows up for five seconds or so when you first boot. And yes, basically run memtest for a really long time (it has a full pass counter and an error counter) and if there are errors either a) you're overclocking stop it, or B) your RAM is bad replace it. There are some rare edge cases (BIOS updates, cleaning contacts, etc) but generally it's more common to be bad RAM or RAM compatibility with the motherboard.
-
This is typical, and any time you reset a BIOS it is considered best practice to do a Load Defaults immediately afterward -- as is uaully indicated in the flashing instructions, and widely ignored. The reasoning is obscured to the average user, but important; when storing your values, historically, they don't save "Processor 1 clock multiplier was 24x" or whatever. It's a block of numbers, with no context. The next BIOS version might use that same data space for "CPU Northbridge Overvolt" and cause damage. Typically vendors have important things like that reset during the update process, but things can be missed and it can cause some truly bizarre bugs. Honestly, at this point I almost suspect the advice may not have as much merit as it did, say, ten years ago -- but it still seems prudent to be cautious.
-
I mean - it worked until it broke? I dunno what to tell you, that's just what happens when things stop working, lol. It ALL worked until it stopped working. Parts degrade over time, lose the capacity for running faster than they were meant to as they aged. Eventually they'll degrade until they stop working entirely. I would suggest running the RAM at the Auto speed instead of clocking the RAM over what it defaults to when autodetected. I think they call that overclocking, right? (Trying to be jovial, not sarcastic.) I'd say drop the RAM to its default, and see where that gets you. Beyond that, nothing immediate comes to mind.
-
Not just that, my streamer roomie had a Ryzen 3700X rig with RAM (I cannot remember which brand right now but if I ask he'll definitely remember because he's never buying from them again) rated for 3200mhz (not XMPP, just normal profile) that won't run above 2400mhz in any stable manner even in Windows -- something about the revision of RAM he has is using different branded ICs and Ryzen doesn't get along with them. Honestly, I don't care how many success stories there are, I don't trust Ryzen with Linux.
-
I'm sorry, I'm trying to follow this but somehow I'm not quite there -- what specifically are you looking into feedback on? Software suites, or configuration tips? Or more of a "put X items in server a, Y in server B" and so forth? More of just a sanity check? The only thing I can directly comment on is this part. - First, Jellyfin is a fantastic project, and I'm sure you know it forked from Emby originally. I also tried the Jellyfin route, and thusfar I actually haven't had good experiences with it. I'm actually interested in your experiences with this, as if it's improved I might use it as a fallback -- I have an Emby Premiere account, and my experiences have made it worth the Lifetime license. Primarily though, I mention this because I'm interested in hearing if you have a good experience with Jellyfin, and your feelings of that experience vs Emby, if you have any. - Second, unfortunately (and this isn't just an Unraid limitation) -- you can't. Not simultaniously, and given the on-demand nature of Jellyfin that's just asking for misery. You can only use a GPU in a VM as a passthrough device (someone correct me if I'm wrong) and this will make it effectively unavailable to Unraid's use, full stop. Professional GPUs support things such as SR-IOV where instances of their function can be split between multiple virtual hosts and other fun tricks, but consumer-grade GPUs, to my knowledge, universally do not support this featureset.
-
You can find when the last few SMART errors happened by checking in the webUI under the disk's Self-Test section, click Show under SMART error log. If you're not confident interpreting it, we'll see the same data in the diagnostics.zip once it's uploaded. C-States are low-power states that cores cycle in and out of very rapidly during normal use, to save power and reduce heat. Sleep is a different thing, and comes with a whole bundle of problems -- enough that I find myself often wishing they'd (Linux, specifically) just do away with it in non-portable contexts. As for when to upload - the only case waiting would serve is if a disk has undiscovered errors towards its end, but given what I've heard so far I'm confident there's no explicit need to wait.
-
I apologize - I'm just starting out trying to help out here, and I missed the SMART data in the diagnostics you attached. It's there, and seems okay. Regarding crashing when you're not around - one thing I've done in the past is open a terminal window directly attached to the server in question, and run; setterm -blank 0 dmesg -w This will disable blanking the terminal (usually) and start a process to watch kernel messages and print them to you. Sometimes a crash happens too quickly to send the logs, but often the last message is important but doesn't get flushed to disk. If your server is headless, an ssh session also works but is less likely to catch a "dieing gasp". Another thing you might try, but isn't likely to do much in your specific case, is disable processor C-States. I've seen a few random smatterings of intermittent crash caused by C-States, and it doesn't hurt to try. Run this command on the server, either terminal or ssh. It will disable all C-States on all processors, but only until you reboot. This way it's safe to test, unlikely to hurt, and you don't have to do anything to undo it. for cpus in /sys/devices/system/cpu/cpu*/cpuidle/state*/disable; do echo 1 > $cpus; done


