CyrIng
Members
-
Joined
-
Last visited
Everything posted by CyrIng
-
@KaitsuN6 It's possible that the failing access to the MCHBAR (Memory Controller) lefts CoreFreq in unstable situation. This is the major difference I see with previous pluggin.
-
|- Units |- Power watt [ 0.000003906] |- Energy joule [ 0.000000061] |- Window second [ 0.000976562] With Goldmont I'm facing Power units unseen before
-
If it happens please grab the log files About Power, values shown as Pkg and Cores seem wrong; unrelated with the stressed load
-
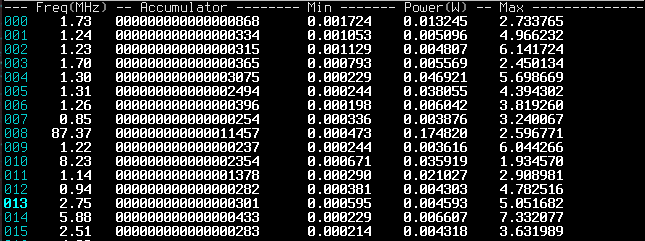
This confirmes there is a single voltage sensor in this processor architecture About the Power, are you reading some meaningful values ? Example from the view "Power" :
-
Now you can select Single Core stress, Random or Round Robbin
-
@KaitsuN6You can change Voltage scope to SMT then apply individual CPU load and tell if Vcore is a discrete value or not ?
-
As default there is a single sensor for whole processor. You can try other Voltage scope in window "Settings" Also we have to find/work on Northbridge or System Agent or SoC voltage
-
@KaitsuN6I like to see this Vcore. Will study IMC data. Thank you EDIT: Unfortunately MCH failed to remap.
-
Please let me know when I can get the memory registers dump as I have a short delay window to program it. Sincerely
-
I was sure Rank is 2 I have a small C program to read/write registers: `zencli` source code here Let me know if you can compile it directly on your Linux ? Just download `zencli.c` and compile cc zencli.c -o zencli Once done, as root, you can read some Ryzen registers. Two addresses I need is about DimCfg specified above. Enter commands like this: ./zencli smu 0x50090 ./zencli smu 0x50094 ./zencli smu 0x50040 ./zencli smu 0x50044 ./zencli smu 0x50100 ./zencli smu 0x50104 ./zencli smu 0x50df0 ./zencli smu 0x50df4 After try a Memory Controller dump ./zencli umc
-
Can you please provide the output of dmidecode ? sudo dmidecode -t memory At least we should read from it: Total Width: ?? bits Data Width: ?? bits Size: ??? GB Locator: xxx Bank Locator: xxx Type: DDR? Speed: 0000 MT/s Part Number: xxx Rank: ?
-
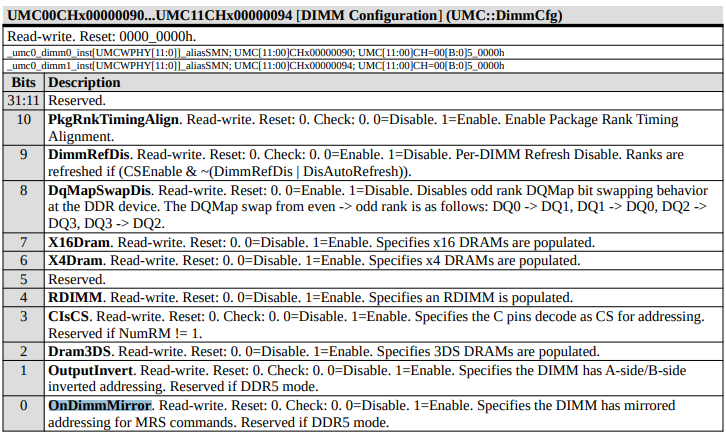
I see the issue. I have based the Rank number on OnDimmMirror But this field only applies to DDR4 Edit: because processor is 7900X3D, maybe Dram3DS is a discriminant to guess Rank
-
I'm searching for your DIMM and finding FLBD564G5200HC40CDC01 I think that if the CoreFreq computed DIMM geometry is wrong, it's because I'm facing some Register bits I have not encountered so far. My assumption is that DIMM ranks should have felt to a value of two Fyi, if you compute the product as below, you will get the DIMM size Bank x Rank x Rows x Columns (32 x 2 x 65536 x 1024) x 8 Bytes So I need to debug Registers to guess the missing bits.
-
Thanks, To what I can see, the total is 64GB * Has CoreFreq only found one controller with 4 DIMMs 16GB each ? If you scroll, don't see you other controllers ? * Can you open a terminal and read the RAM size. You can use command `free` or `lsmem`
-
The other menu called Memory Controller. We should see timings and geometry, including size of DRAM
-
Indeed I also noticed that in your signature specs. Total RAM is sourced from Kernel. What does memory command gives you ? free -m Also can you show screenshots of CoreFreq Memory Controller window?
-
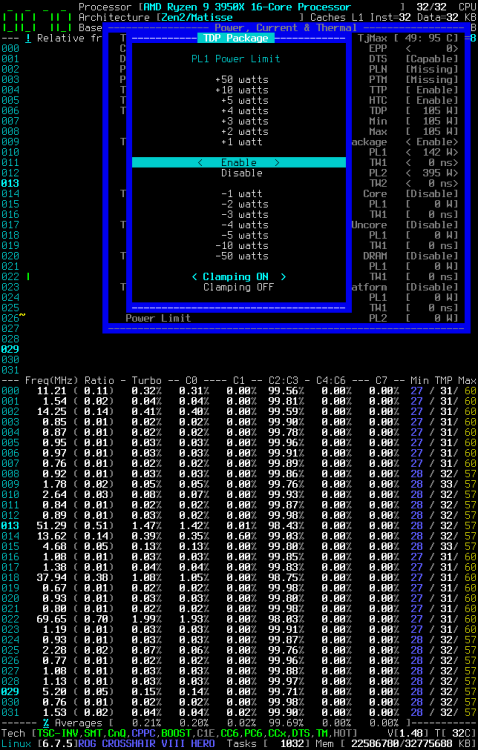
Hello, Temperature looks pretty high, with a minimum of 69C. Show me what is the "CPU-Idle driver" in the "Kernel" window Power Limit can be altered in "Power, Current & Thermal" window but it has not been implemented on all AMDs
-
That red number is the percent of available memory. It is based on "Free RAM" and "Total RAM" values displayed in the "Kernel" window percent = (100. * freeram) / totalram Red Threshold is about 15% left Does the load crash your 7900X3D while CoreFreq is installed and running or it does not many any difference ?
-
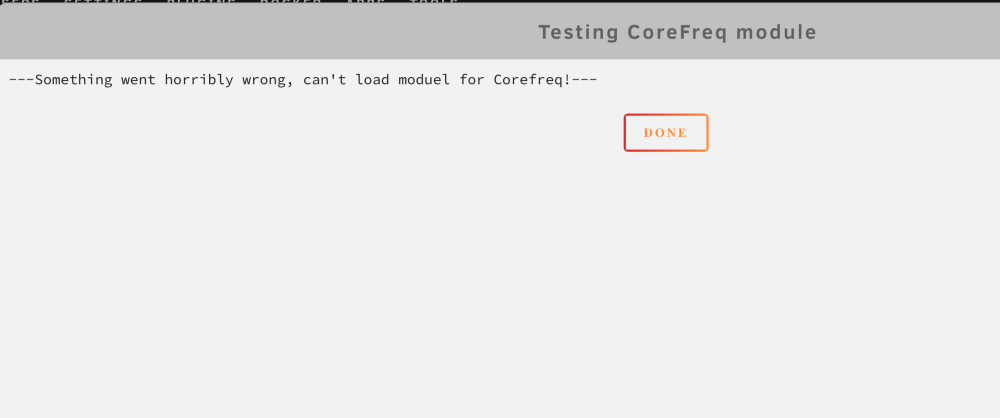
@ich777Hello, Not sure if you're informed but @KaitsuN6has encountered the following issue with the test plugin:
-
@KaitsuN6 Once the plugin run, you will find a dump of registers in the kernel log surrounded by those marker lines --- DEVICE (DUMP) --- ... --- MCHBAR (START) --- ... --- MCHBAR (STOP) --- I need this dump to study the memory controller. By the way, this plugin includes the Vcore fix. Please have a look to the voltage, idle and stressed cases. Thank you
-
Please juste wait for @ich777 instructions If it works then provides this output from the CLI corefreq-cli -s -n -m -n -M -n -u
-
Hello, Sorry again for this crash. Another special archive of CoreFreq for Goldmont is left in repo but also here. I hope it will successfully run. If true, please provide the output of `corefreq-cli -s -n -m -n -M -n -u` (because I need to find a feature discriminant among Goldmont processors) CoreFreq_Goldmont.tar.gz
-
Thanks Please follow issue on GitHub
-
Thanks I see the issue in MSR register 0x64c Let's continue this issue on the GitHub. Regards CyrIng
-
Thanks for sharing I don't find any issue in kernel log ?