





FreeMan
Members
-
Joined
-
Last visited
Everything posted by FreeMan
-
I appreciate that and will do so. That's also what I've done for the initial issue in this thread of the very high CPU utilization. I seem to be able to work around these issues (reboot the server fixes the high CPU, pause the parity check fixes the very slow speed) but that's doing me nothing to track down the actual cause of the issues and come up with some sort of resolution.
-
The parity check finally completed. It's reporting 600MB/s because the last bit of run was only 3 hours and it was on a set of 8TB disks. Maths are a bit off... It doesn't seem to have noticed that I manually paused/resumed several times. This did pop up within the last hour or so of the parity check: I can acknowledge it, I know, but is that something to be concerned about? It's the only error that came out of the parity check.nas-diagnostics-20210612-1956.zip

-
Extended SMART tests finally completed... No errors on any HDD or SSD. nas-diagnostics-20210612-1050.zip The correcting parity check from the unclean shut down has been resumed with about 3.6TB to complete. Since the initial pause of this check: The check seem to be running at a more normal speed. Any other suggestions of what to do or where to look to determine what the issue may be? I've got a pre-cleared 8TB drive that's ready to go in for a replacement for either Drive 3 or 4 (whichever has had the most spinning hours - they're close). Would it make sense at this point to do the disk replacement (after the parity check completes), or should I try to sort this out before risking anything?
-
I've got the extended SMART tests running now. I'll be gone most of the rest of the day, but if that finishes before I leave, I'll resume the parity check before I go. UPDATE: Eh, decided to resume the parity check as the SMART tests are only at about 10% completion. As of now, it's running at ~110 MB/s. It'll be late this evening before I'm back home to check on it (though I'll touch base via ControlR & WireGuard, when possible). All dockers are shut down for now, so that may well be helping, too.
-
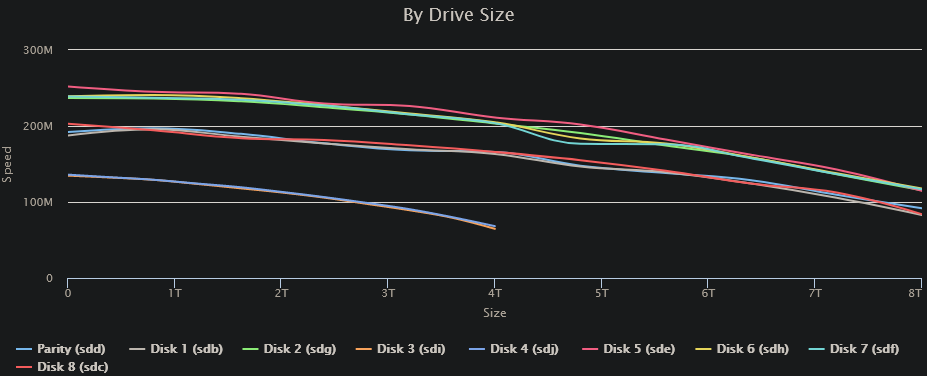
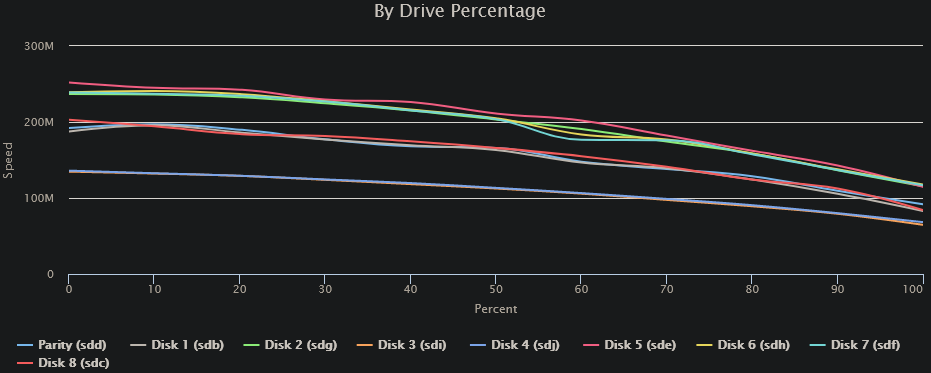
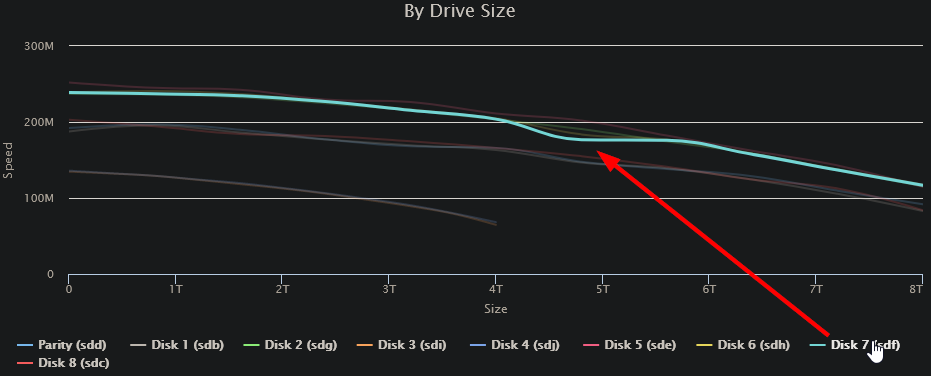
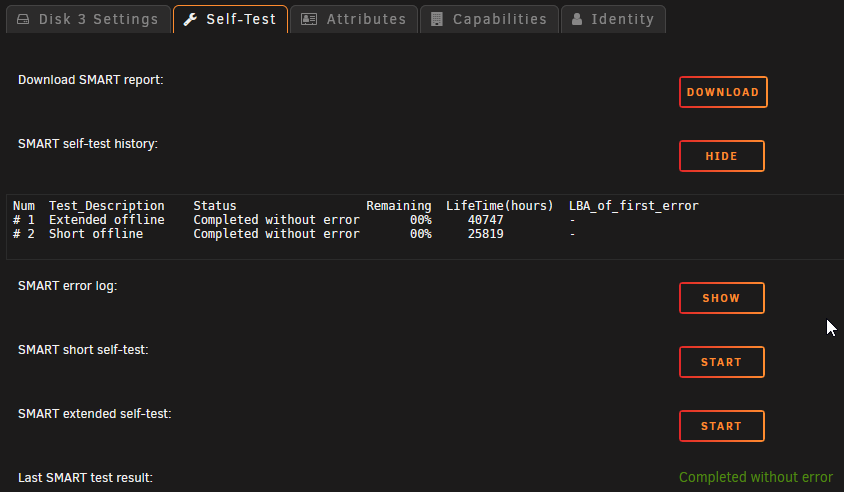
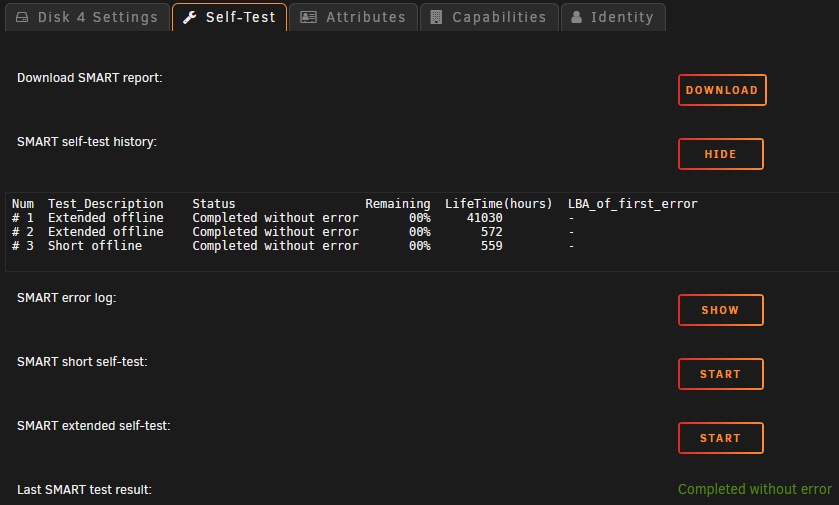
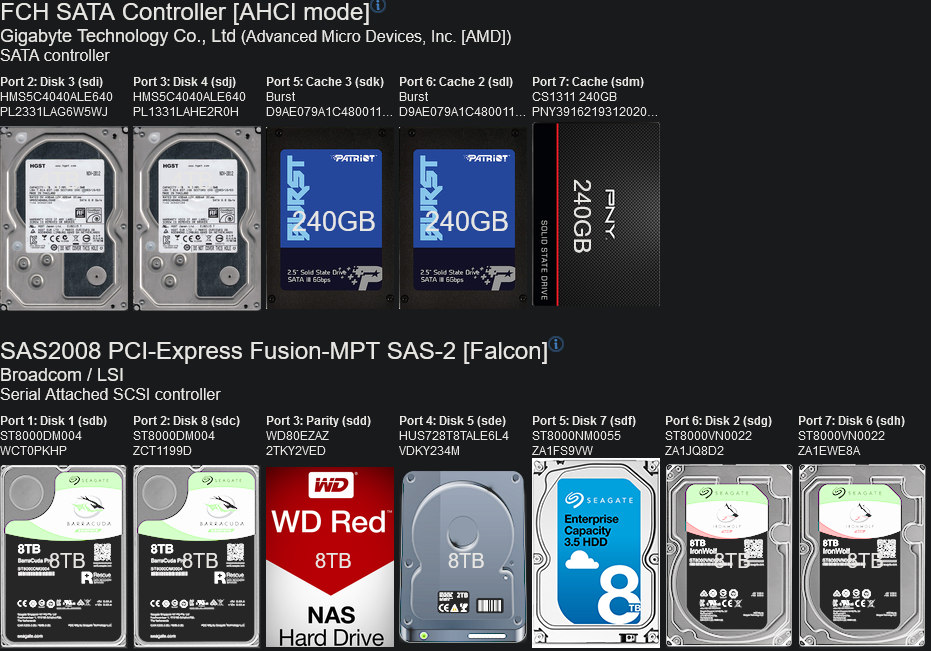
OK. Issues yesterday with Speed Gaps on Drive 3 yesterday. To the point where it stopped the test and wouldn't continue. I shut down the DiskSpeed docker, watched some TV and resumed the parity check overnight. This morning, I shut down all dockers, fired up DriveSpeed and ran a test again. Everything seems normal to me: The small dip at ~4.5TB/60% is on Disk4, but doesn't seem particularly significant: FYI: Drive/controller arrangement: (I'm sure there's a more compact/text representation somewhere, but this was quick & easy) Despite the fact that all the SMART tests seem to have aborted, it appears that the Extended SMART test completed on Disks 3 & 4 w/o error: Note that the power on hours are within a few hours of current - the test #1 results are the runs from yesterday afternoon. I am, however, starting an Extended Test on all drives again, just to get complete data. Anything else I should be looking into?
-
running diskspeed now. It's been a long time since I last used it - I've got 2 controllers, 1 on board and 1 on a card, IIRC, it tests one drive at a time on each controller, correct? It really seems to be struggling with one drive in particular. Either that drive's got issues, or it's because I haven't stopped all my dockers and influx/telegraph keep writing to it. I'll let the test run to completion as a baseline, then I'll shut down all dockers and run it again, to see if it makes a difference.
-
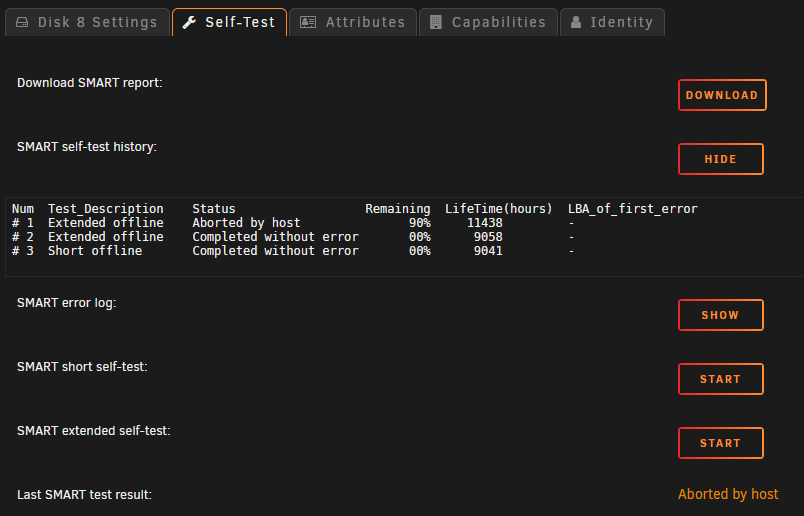
Interesting. The extended SMART tests completed on the 3 SSDs in the cache pool, but they seem to have terminated on all the spinning array drives. Additionally, none of the spinning drives are showing any SMART history at all, except for Disk 8, which shows that it was "Aborted by host". New diagnostics: nas-diagnostics-20210610-1333.zip Any thoughts? I'm going to resume the parity check since the SMART processes aborted themselves. I figure it will be comforting to know parity is good.
-
Good point, thanks. I'll try that next if nothing shows up on the SMART reports. Sent from my moto g(7) using Tapatalk
-
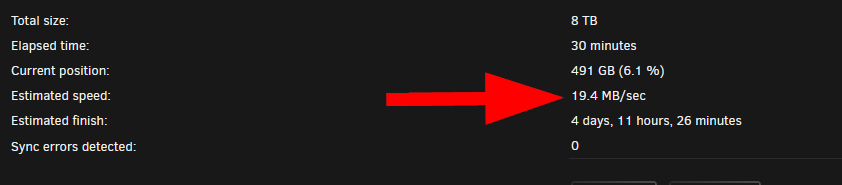
Something is seriously wrong! I've never had a parity check run anywhere near this slow. I mean I don't have the fastest setup in the world, but my last 21 checks (what fits on the first page of the parity check display) averaged 106MB/sec. Now it's running at 19.4? It slows down as it nears the 4TB mark because of a couple of older 4TB drives in the mix, but never that slow... Wondering if I'm getting some sort of disk error that's not been reported yet, I've paused the parity check and I'm running extended SMART checks on all drives.
-
It was unusuable, so I did a restart. Apparently, it was unclean, so now it's running a parity check.
-
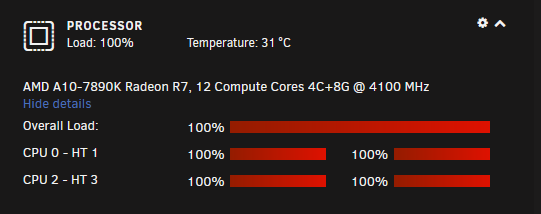
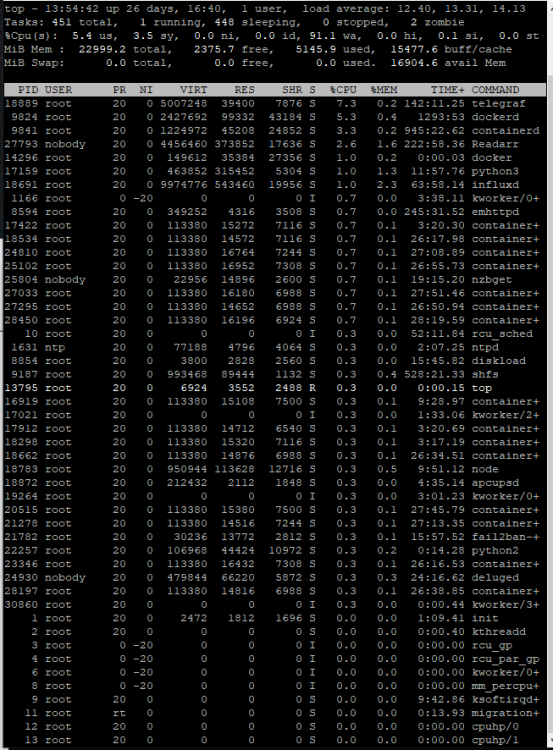
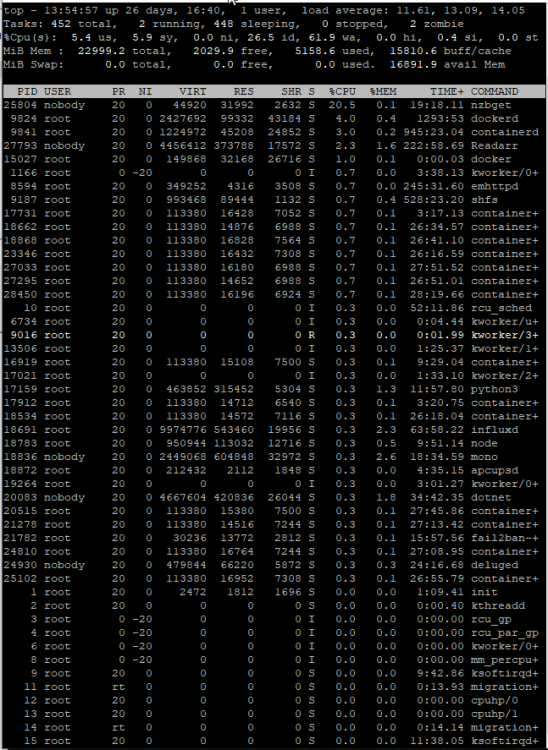
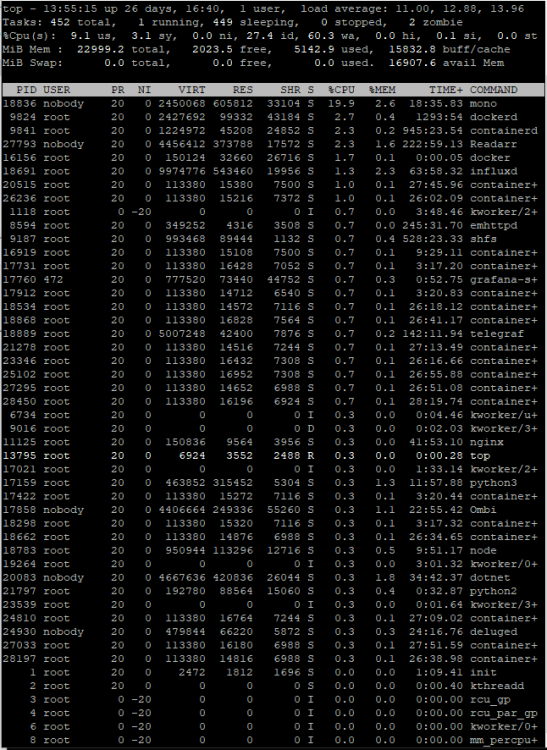
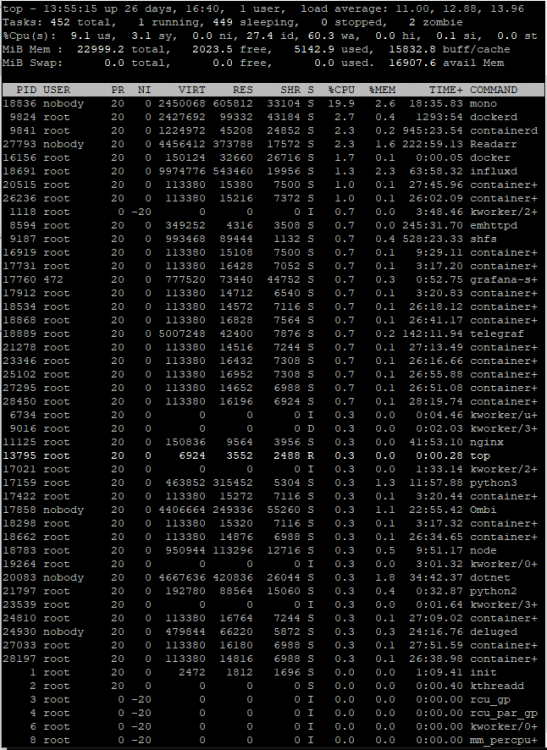
This seems to be happening again. CPU is pinned: And it has been more often than not since about 9pm last night: Access to the server via the WebGUI and various dockers interacting through web services seems to be mostly fine, however, SMB access from a Win10 client or via my Kodi box (on dedicated hardware) is nearly impossible. Here's the latest nas-diagnostics-20210609-1350.zip Here are 3 screen grabs of `top` over a 3-4 minute period when the highest CPU utilization seemed "high": Simply trying to browse (using Win Explorer or xplorer2 LITE) from my freshly rebooted Win10 desktop to the server is basically impossible, as is just about any other access to the server from my desktop machine. I can, however, open the Web UI to Emby and fire up a movie in a browser window on this same machine without any issue whatsoever. It seems that "wa" - disk wait may be what's causing the issue, but I'm not sure how to track down what's causing that. I am still running the File Integrity Plugin, but the blake2 process doesn't appear in any of these top screen grabs, so I don't think that's the cause, though I'm more than happy to be proven wrong. Sorry to ping you directly, but anyone @limetech have any suggestions on what to look at next? This has been happening on-and-off for nearly a year now, and it's the only complaint I've had in about 10 years of otherwise very happy UNRAID use.
-
I stopped dockers 1 at a time, giving about a minute between each shut down. It had essentially zero effect on CPU utilization. I finally rebooted the server. After an initial burst of 100% utilization, it seems to have settled into a more normal usage pattern. I hope it remains this way and doesn't spike again. Unfortunately, while this has returned the server to usability, it doesn't explain what happened or why.
-
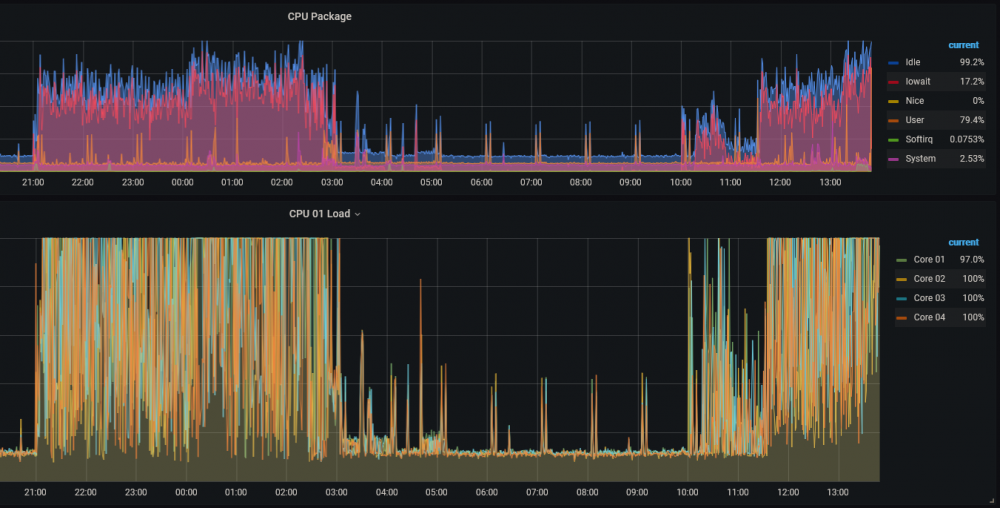
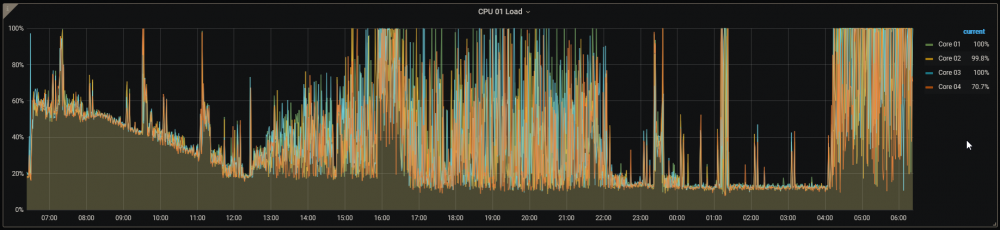
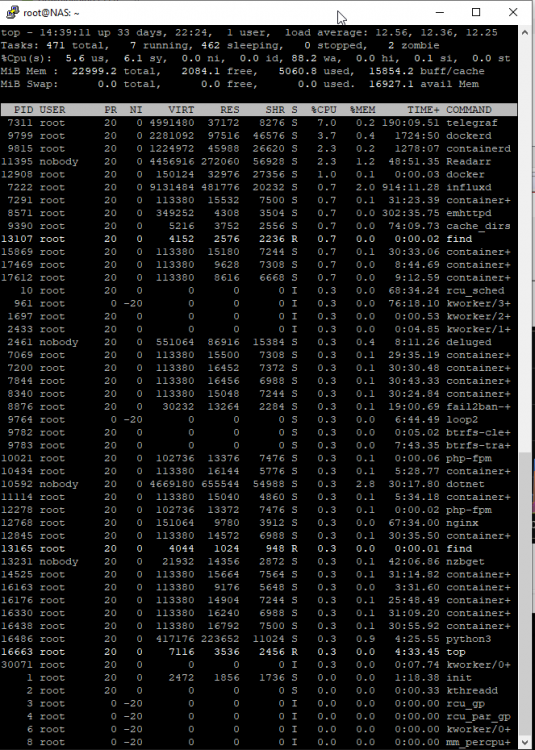
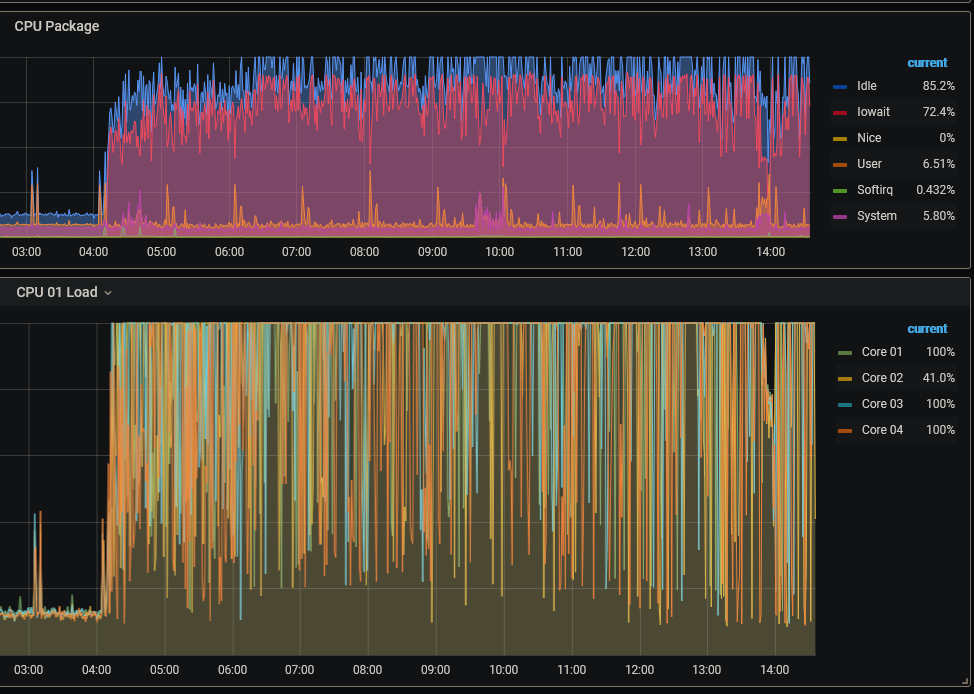
I never found a resolution to this issue, and now it seems to be back. I do get times of incredibly high CPU utilization on occasion, but generally they last a few minutes. This time, it has been going on for basically 24 hours now, and I haven't a clue how to track it down. Using the Ultimate UNRAID Dashboard, showing CPU utilization over the last 24 hours, I grabbed these two graphs this morning: Based on these screen shots, it appears that the utilization drops off during the overnight hours (22:00 - 04:00 it seems reasonably "normal"), which would indicate that it's end-user created. However, this is 99% a media server with some Dockers running and no VMs running. I'm not doing anything (that I'm aware of) that would execute on the server. I do have the Handbrake docker installed, but it's not even currently running, and that's about the only thing I'm aware of where I'd be intentionally be putting a heavy load on the server. I just grabbed this screenshot of top running: Here's the diagnostics I downloaded this morning (grabbed right after I took the graph screen shots). nas-diagnostics-20210513-0634.zip As you can see here, the CPU has been pinned nearly all day today (about a 150 minute overlap with the graphs above): The only activity that the server would have had during the day (that I'm aware of) would have been a few file downloads. Nobody was even watching anything via Emby or Kodi, so it wasn't doing any transcoding. I was working (from home) all day today, doing nothing on the server. I occasionally woke up my personal Win10 desktop machine just to check on the server, but, other than looking in on the WebGUI & UUD, I wasn't doing anything that should have kicked off any significant processing on the machine. I've spent time watching the CPU utilization on the Dockers page. Generally they're running at 0.0x% with occasional spikes as high as 2%, and I've seen telegraf spike momentarily to 20%, though I've never seen it above about 7% in top. Radarr & Readarr ocassionally will spike at 7-9% CPU in top, but I've not seen them reporting that high on the Docker page of the official GUI. What tools are there at my disposal, beyond top, to determine what's going on? I'm still running cache_dirs and you can see it in top showing at about 0.7% CPU, so I find it hard to believe that all of this is its fault. I just stopped screen updating (using Greenshot) to take a look, and it took 3 times to even get cache_dirs to show up in the rather tall list of output from top. When it did, it reported 0.7% CPU utilization again, just like in the screen shot I included. I'm still running the File Integrity Plugin using the BLAKE2 hash, but I don't see anything in top at all that indicates anything about "File", "FIP" or "BLAKE" showing up in those top 20-30 threads, so I don't think that's the issue. At the moment, this is making watching TV shows/movies (the server is primarily a media server) exceedingly difficult - many shows keep hanging on my Kodi box (separate hardware) because the server can't keep the stream going. I'm getting tempted to restart the server in the hopes that whatever is causing this won't restart, but I'd rather find the cause than just band-aid a solution.

-
Possibly, but Grafana updated 6 days ago and the "blip" happened 2 days ago. Either way - not your fault, enjoy your retirement sabbatical.
-
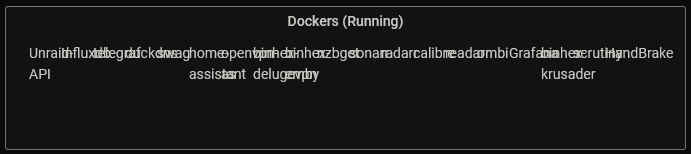
This is quite bizarre. After having gotten most things set up & working, yesterday several things, like the icon size in the Dockers displays and the queries that (weren't) pulling the array status and name had reset themselves to the way they were shipped. Now, this morning, the Dockers running panel has really reset itself: I had this displaying the images earlier, even had to reset image size from 64x64 to 32x32 because they were too big. Fortunately, edit, right-click > view image > login to UNRAID resolved the issue again. I think because falconexe has quit, mine is falling apart.
-
I just installed this and had the 1006 error. It took clearing cache & cookies to get it to go away. Other than that, everything seems to be working just fine. Thanks for putting this together (wish I'd seen it years ago...) About the only time I really need it is to convert files off of my JVC Everio camera - it creates a file with a .MOD extension that VLC will play. I can change the extension to .MOV and VLC will still play it. However, nothing will get Premier Pro to import it short of a full on conversion. Glad this works!
-
It wasn't on purpose, I promise!! You've put a lot into this and it's appreciated. Get yourself sorted out, and I pray we see you back some day.
-
Well, I'm good, but I didn't know I was that good! 🤣
-
First of all, what's a "variable constant"? Either it's variable, or it's constant... Second, where are these defined? I rummaged about in the grafana interface a bit and didn't see anything obvious shouting at me. Third, is it possible in any way, shape or form to have a "variable constant" called "Disk01" with a serial number value (or, probably, vice versa) that could be used in all the disk queries so that I can set them up once and have them automatically translated in the dashboard and, even better, between dashboard versions?
-
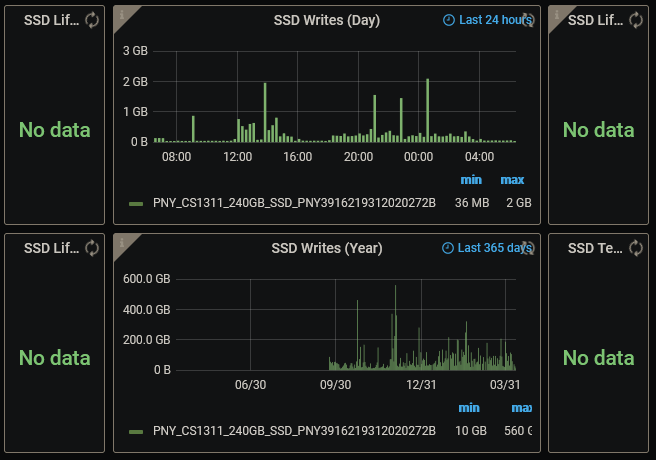
I just got 1.6 installed. Maybe I should update my notifications to 1x per day instead of never... I appreciate all the hard work everyone has put into this. This dashboard has almost gotten too big! Anyway... * I've gotta say, even having read the 2 posts where you announced 1.6 and the follow up with all the tweaks that needed to be made, it wasn't super obvious that I actually needed to manually add the JSON API Data Source myself. I did find it in the Grafana control panel eventually and got it added in, but it wasn't intuitive, and I consider myself reasonably intelligent... Maybe in the future, be sure to explicitly spell out such changes - it will reduce head banging. Yes, the post says "New Grafana Data Source" but it doesn't explicitly mention that I have to manually add it. For those not that familiar with Grafana... * It took a while to get the Docker images to show up, in Firefox, I never got the "show images" option in the right-click menu. I ended up having to edit the panel, then tried it from there and got the "show images". Once I got logged in, the images show up. They were huge on my 1920x1080 monitor, so I changed the image size to 32x32 and it looks good in the box as delivered. (Seems that someone else pointed this out as well - I was writing this while working through issues and reading about 5 pages of updates.) * Oddly, I'm not getting anything showing in the VM displays. I've got 2 installed, neither is running at the moment. I'd expect to see them showing up in the "stopped" display, but they're not. * I am, once again, struggling with fan speeds. I do not have a server-grade mobo, so ITMPI doesn't work for me. I have "sensors" installed, and it was working great in 1.5 with this as the query for the fan speed: SELECT last("fan_input") FROM "sensors" WHERE ("feature" =~ /fan./) AND $timeFilter GROUP BY time($__interval) but, that doesn't seem to be working in 1.6. Any suggestions? * "Array status" wasn't displaying anything with $.['servers']['http://192.168.1.5']['serverDetails'].arrayStatus in the field. When I changed it to $.['serverDetails'].arrayStatus it started working just fine. You'll note that I did change the IP address (and changed to http). I also had to make this change for "server name". "Parity status", "Mover Running", and "Parity check running" were all shipped with the shortened version. Maybe make a tweak and re-upload it to post #1? * I have zero unassigned drives in my machine, so when the variables at the top picked the first drive as a default for unassigned drives, I cleared it out and saved the dashboard, including saving the current variable settings As soon as the dashboard refreshed though, it reselected the first drive in the list for "Unassigned Drives" No matter how many times I've cleared it and saved the dashboard, it keeps coming back every time it refreshes. Any thoughts on how to tackle this? * Oddly, I'm getting SSD writes graphed, based on the disk I chose in the variables up top, however, I'm not getting any of the other 4 SSD charts filled in, despite having entered the disk SN in the query. Lifetime writes: Lifetime reads: Life used: Note that I've got 3 different SSDs all in my cache pool (and have had for more than a year), so you can see different SNs in the screen shots, but none are picking up correctly. I copy/pasted the serial number from the UNRAID dashboard, so I know that they're correct. I've not bothered with correcting all the other factors yet since I'm not getting any actual data, so the math() function is still the dashboard default I'll go look up the necessary numbers once I'm actually getting something for it to do math on. Again - I appreciate all the hard work everyone has put in!





-
I started having issues as soon as I updated my server to 6.9, and assumed that was the problem because I hadn't yet updated my backup server and it continued to run just fine. Now I'm getting no results on either server even though the backup is still on 6.8.x and the primary is on 6.8.1. @dmacias are you still active on this project? If not, I'll move on to something else. This has been a great "ping" to know the servers are still up, and I'll miss it if it's gone...
-
My preclear has finished and gave me this result: Elapsed Time: 38:46:05 ========================================================================1.22 == == Disk /dev/sdn has been successfully precleared == with a starting sector of 64 ============================================================================ No SMART attributes are FAILING_NOW the number of sectors pending re-allocation did not change. the number of sectors re-allocated did not change. SMART overall-health status = [root@e60018e2f375 /]# A) The "SMART overall-health status =" at the end seems... like something's missing. B) Seems to me there was more to the report last time I ran this, but it's been long enough I don't honestly remember. Is something missing? C) I went looking for the preclear report in /boot/preclear_reports where they used to be written, and realized the newest one is from 18 months ago, and my chat history here shows that my last preclear was only 3 months ago. Are the logs no longer written there? Where do I find them now?
-
Yup. I did that a couple of posts back. [emoji6] Thanks for the confirmation. Sent from my moto g(7) using Tapatalk
-
I just went ahead and said "Yes" to the "are you sure you want to start" question without any additional parameters. I'm about 1/2 way through the preread. I figure if it doesn't "work" properly, the server will do whatever if deems necessary when I add the drive to the array. My goal is to exercise the drive before trusting data to it, so I guess this'll do the trick. I may end up sending this dock back anyway, now that I know the problem is my case USB3 ports not working and that the old dock didn't fail. This one's got a fan, but I'm not sure it's helping, and it's got LEDs bright enough to be used as anti collision lights on the ISS.
-
I ran that in a PuTTY session and it correctly ID'd the disk as a Seagate IronWolf, picked up the SN, etc. It specifically says: Device is: In smartctl database [for details use: -P show] Which isn't surprising, it's not the first IronWolf I've installed in this machine. It is, however, the first time I've used this new USB3 enclosure, so that may be the issue. I tried running the preclear_binhex.sh -f /dev/sdn and it gave me the same error. I'm not sure what the appropriate next step should be...





