FreeMan
Members
-
Joined
-
Last visited
Everything posted by FreeMan
-
You know, a real software guy would simply say "upgrade the hardware"... 🤣 🤣 🤣 🤣 🤣 🤣
-
Man, it took me a while to figure out what you meant. It just hit me that you totally misunderstood my intent, and it's obvious that I wasn't all that clear... I was intending it to be a "new user tips & tweaks" or "@falconexe has released a new version and I need to recustomize it, now what the heck did I change last time" type of "customizations to consider", not for more changes for you to make. I was talking about a reference post for new people who don't have 2 CPUs to figure out how to get rid of the 2nd set of CPU graphs, and instructions on how to go about naming drives instead of having them listed by serial #, etc. Not more suggestions for you to implement in the first place... Whew! I thought you didn't like my idea. I was gonna be hurt...
-
Hence "something you may want to consider" not "you should do it this way!" . And, consider it you did. If I build up some energy for it in the next couple of days, maybe I'll write up a "Customisations to consider" post. Comb through all the posts and put together some text on things that people have had to adapt to make it fit their personal server situation. Deleting extra NICs, naming fans instead of RegEx, adjusting drive free space highlights from absolute to pct and setting thresholds as desired, naming drives instead of serials, etc (Just a couple off the top of my head).
-
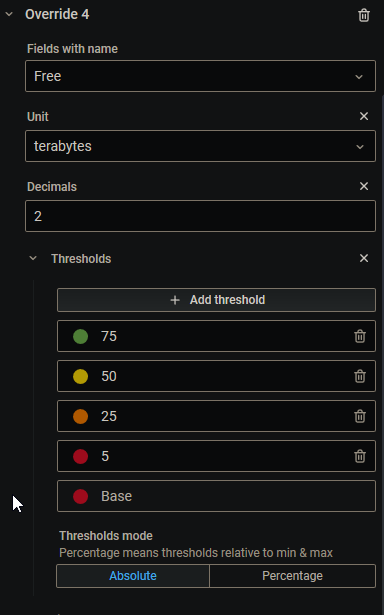
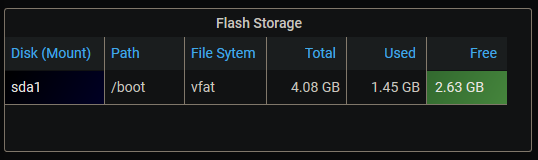
This is what my "Array Storage" section looks like: Note that the Free space is highlighted in red. That doesn't make much sense to me considering that I've got 36% of my disk space unused. I went to edit the overrides, looking to change the percentage, figuring that it was just a typo somewhere. In the overrides for the "Free" section, I found this: I changed the Thresholds mode to Percentage, then added a Min override and set it to 0. Now my Free space has an orange background. Something you may want to consider for future updates.

-
Yeah, they're called "off-ramps"! 🤣 🤣 🤣 🤣 On a more serious note... Maybe consider making some of these things stand alone. Not everybody uses Plex. I realize that it's not hard to "Click -> Remove -> Confirm", but that's kind of annoying for those who may want updates/improvements to the UNRAID core functionality, but not want/need some of the add-ons. To me, having the ability to monitor CPU & RAM usage by docker container in one easy to view graph (the standard WebGUI view is nice, but I do like this much better) is a huge bonus. Having to install then delete the 2nd NIC and 2nd CPU panels that you have is, well, understandable - you're doing all the heavy lifting on this, we're just here griping that it doesn't work on our config. Having to install then delete things for dockers seems, maybe, a little over the top. Multiple CPUs seem very practical (and are, for the most part, limited to 2), while dockers are 100% optional and there are far, far too many to try to include monitoring of everything in one place. Frankly, I would like you to do monitoring for Emby/JellyFin, but, I'd guess you don't run either, so you won't be doing that. Hardly seems fair... #OneMansOpinion
-
Something to consider @falconexe Instead of hard coding column widths for tables like this: Consider leaving no column width override. That way columns will autosize no matter what screen resolution or how wide each end-user decides to tweak his/her columns. Your column settings were so wide, I hardly had more than 1 or two visible without side-scrolling. Then I spent a while tweaking the column settings to get them "just right". Then, as an experiment, I deleted all the width overrides and realized I'd wasted a lot of time with the tweaking because they came out basically the same widths on "auto".
-
Ah, that makes more sense. For some reason, it took me a while to find that right-side panel. I'd been looking for things you'd been telling people to do, but I couldn't find the options you were talking about. I stumbled on it a couple of days ago. It's much easier to tweak things now!
-
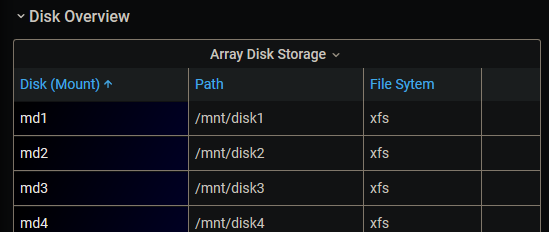
How do I adjust individual column widths in the data tables? As you can see here, there's a lot of empty space that could be eliminated. Since we don't all have 4k monitors, there just aren't enough pixels on the screen to display the data without a lot of horizontal scrolling. This is the top of the "Array Disk Storage" listing, and there is essentially no interesting data on it without scrolling: I tried adjusting column widths once, but it ended up rearranging the columns and totally mangling things - there must be a better way that what I was doing!
-
I still have v1.2 installed. Oddly, it's showing the same symptom. It is probably something wonky in Grafana. If it's still showing like this when you release v1.4, I'll uninstall & reinstall the Grafana docker. In the meantime, as I said, it's a mild nuisance, not a "problem". It's more annoying that it's weird and without an obvious solution than it is to look at. Don't sweat it!
-
Done. Still have the non-functional scroll bars on the horizontal graphs. More of a mild nuisance than a "problem" - work on higher priority items.
-
Firefox closed for an update and they're still there. I didn't clear cache/cookies, though. It does remain after a Ctrl-F5 hard refresh of the tab, and after close/reopen the tab. I do have the `--restart=always` parameter set for one of the 3 dockers (don't recall which) per your earlier instructions, but I've never had any issue with dockers starting with a server restart or after a CA Backup run. Interestingly, this is not the first CA Backup run since installing all this stuff, it just happens to be the one that caused a weird visual glitch.
-
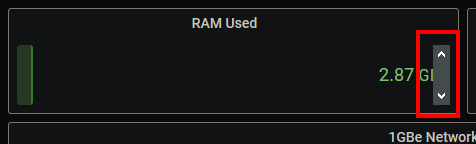
Interesting. CA Backup shut down all my dockers last night so it could do its weekly backup. I'm good with that, nothing much happening on the server at 2am on Sat... However, when I look at the dash after everything came back up, a vertical scroll bar has appeared on all the horizontal bar graphs. There is no scrolling happening when I hit the up/down arrows on the scroll bar, it just sits there, mocking me. I'm elbows deep in a car repair today (just waiting for the PB Blaster to loosen some rust), so I probably won't look at this again for another 4-6 hours, but if you've got any thoughts, I'll try 'em out later.
-
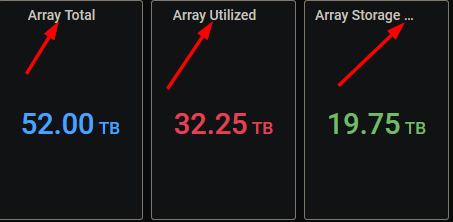
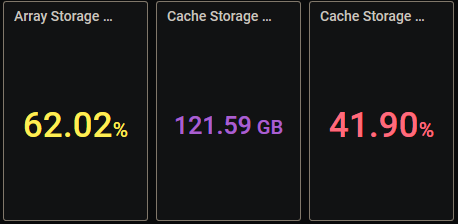
A consideration for those of us who don't have 43" 4k monitors (which I would imagine to be the significant majority of your audience ). Remove the word "Storage" from the top utilization boxen: On my 24" 1920x1280 monitor, I see a series of "Array Storage ..." "Array Storage ..." because the titles are too long for the box size. The same is true for the Cache storage text: Yes, I can edit the titles (and have done so for the first 2, leaving the rest as examples), but I think that the vast majority of folk will be able to figure out that an "Array Total" measured in "TB" refers to "storage" without having to be explicitly told. And for those that can't, do you really want the support nightmares of them asking eleventy-seven bajillion questions? (He asks checking his post count on this thread, noting it's approaching eleventy-two bajillion... )
-
You've shared that before, thank you. Unfortunately, I'm also running AMD, so I'm getting zilch. Patiently drums fingers...
-
Very much looking forward to this as my servers have always run on desktop hardware. I get no CPU utilization or fan speeds.
-
Well, don't that just suck! Hey, waitacottonpickinminute! Isn't InfluxDB a data base?? How 'bout I just add a table that maps my serial numbers to my disk names, create a view that joins them, then do the Grafana queries off of that view and pull in the name instead of the serial! Great idea, FreeMan, but HeidiSQL won't connect to an influxDB backend. Haz a sad😥 Are there recommended tools for connecting to influxDB? A quick search hasn't turned anything up. Is this even possible? If you I we do this (I'm more than willing to dig into it given the proper tool to connect, I've used my share of SSMS), the DML to create the table & view can be included in the first post, along with a sample file of how to insert the serial/drive names (hrm, may take installing the proper tool on each users' machine somewhere, somehow). Once they're in the table, there's no need to ever redo the overrides in each panel for each update. Additionally, it's only occasional updates to the config table as drives are added, moved, rearranged.
-
I know that you've done a huge amount of work on this, and I appreciate it! I'm curious, now that the display is using variables to define the Cache, Parity & Array drives, are these stored in the InfluxDB database somewhere, or do they need to be reset each time we install an update? I noticed that the currency, kWh, UPS capacity, and all the data sources had been reset when I updated from v1.2 to v1.3. You may also want to consider making these entry boxes a tiny bit smaller... I don't think most country's currency symbols or energy rates take quite this much screen real estate: If you make them narrower, they should fit on the top line after the CPU Threads box: and then all the drive selectors can occupy the next however many lines are necessary. Might make the top a little tidier looking.


-
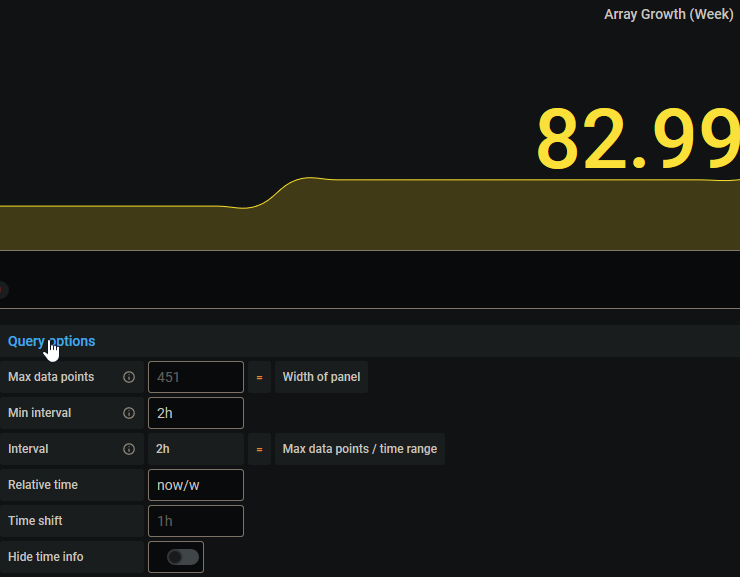
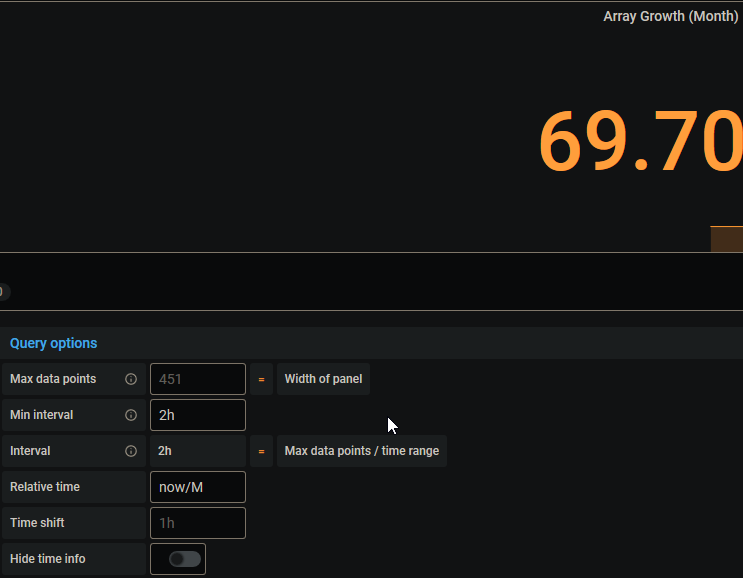
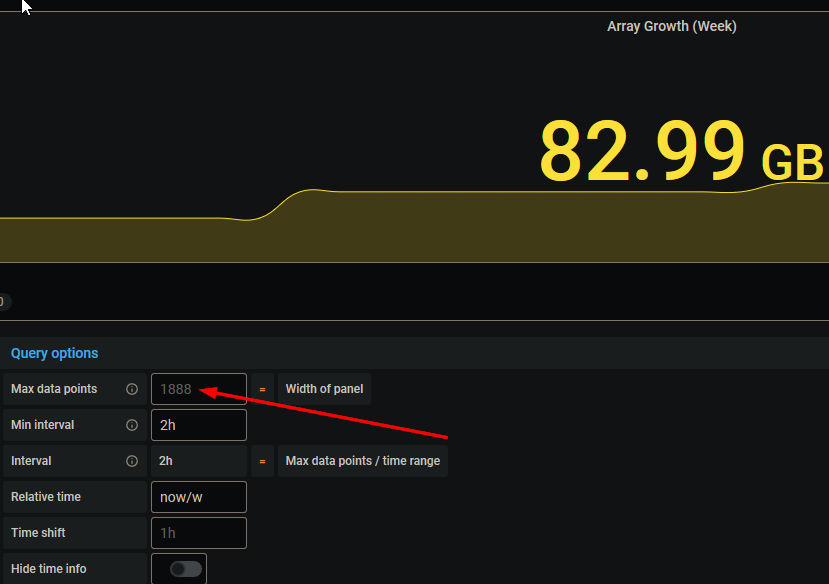
Yeah, sorry 'bout that... I'd been refreshing looking for updates, but was stuck on page 5 and hadn't noticed that you'd moved on. My bad... I edited the Week panel and got this screen grab: Then edited the Month panel and got this screen grab: So I believe all is good. However, I noticed, though it didn't register immediately that something looked weird with the Week panel. I went back in to edit on it and after looking at it for a few seconds, it changed to this: It looks as though for the Week panel only, it's picking up the current width of the panel, and since when I'm editing it the panel draws itself full width, that's nearly the full width of my monitor. Your thoughts on this? BTW- v1.3 looks good, and your mock up for V1.4 is looking good, too! I've got to go back and reread the directions on mapping a drive number to a serial number, and I'll be golden!
-
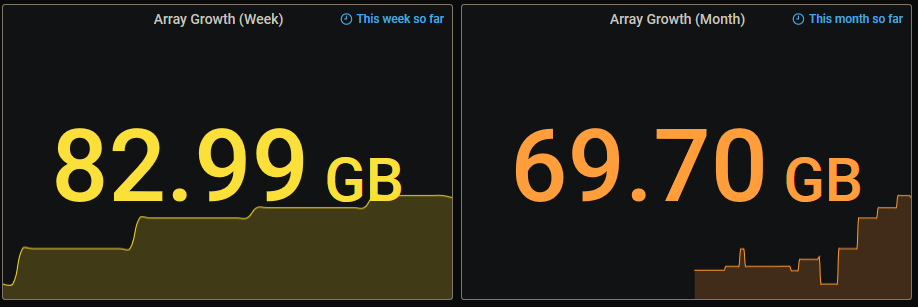
Any idea how the growth for the week could be greater than the growth for the month?
-
OK, I've got this panel showing data: With this query: SELECT last("used") / 1000000000000 AS "Used", last("free") / 1000000000000 AS "Free", last("total") / 1000000000000 AS "Total" FROM "disk" WHERE ("path" =~ /.*cache/) AND $timeFilter GROUP BY "path", "device", "fstype" How do I: Convert to GB instead of TB? It's only 360GB in total space, so I don't need it showing up in red when it's less than 50% used I tried loping 3 zeros off of each of the divisors, and that put the numbers in the right order of magnitude, but it's still labeled TB, not GB Get it to show all 3 drives in the cache pool, ideally with usage per drive? sdl, sdm, sdn Not sure if that's actually possible, as the WebGUI shows 3 devices in the pool, but only 1 number for usage.

-
I've got an AMD A10. Four cores + 6 GPU cores. Not exactly the ideal server CPU... I really didn't read all that carefully when I purchased. On the list of things to do is migrate this to a desktop machine and update the server. Sounds like I should set it to 4, then.
-
Since that's a user configurable, how should that be set? Thinking it was related to core count, I set it to 4. I see several containers at 100%+. Set to 32, I see containers at 30% or less. How do I know what's accurate?
-
I'm getting UPS data, but I've got the servers = line commented out.
-
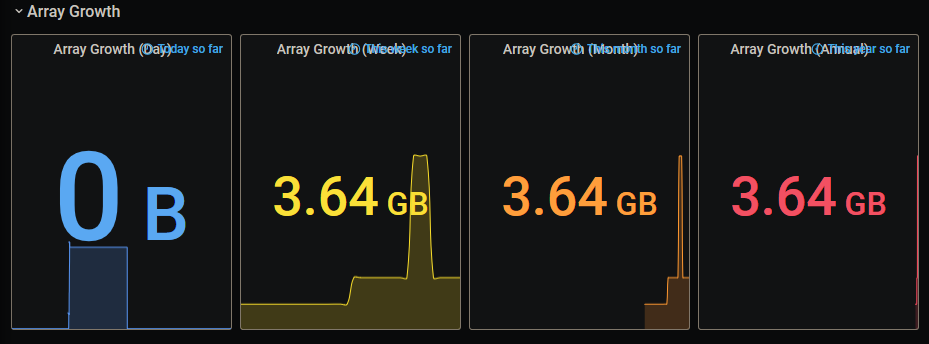
Don't know if you ID'd this yet, but if you put RegEx in the RHS box, you'll automatically get a =~ in the equality box instead of =. Also, for the array growth queries, I modified them to be very similar to @GilbN's query. I have SELECT last("used") FROM "disk" WHERE ("path" =~ /.*user0/) AND $timeFilter GROUP BY time($__interval) The key difference being in the path = condition. I left out "host" =~ /^NAS$/ and it works just fine - that may help make it transition more easily to other's setups. Also, what is this for: Does that tell Grafana how many threads to use, or is it somehow related to the number of cores I have, or... What's the impact of changing that number? Well, would ya look at that!

-
I was making the copy using my Win10 machine, though, so wouldn't it have pulled the data across the network to my machine, then pushed it back? While fair enough, that means that "Today" will always show zero for those who have their shares cache set to "Yes", correct? Though I guess not. Maybe it depends on when "today" is measured - since my mover is scheduled for 01:10, "Today's" growth is really what I added to the cache yesterday. I guess that's just semantics - while it's technically "today", it effectively happened "yesterday". I guess I could change the label if it bothers me enough. Yes I am. Is this in reference to the internal temperatures?