


dariusz.smolarek
Members
-
Joined
-
Last visited
Everything posted by dariusz.smolarek
-
Already checked - unfortunately the log is empty.
-
Hey, @FlamongOle , it finally works. The only problem is I can't restore the configuration from my backups. No matter which backup I select - plugin is not initialized. I'll be starting from scratch, no big deal. Thank you for fixing the plugin!
-
Hey @FlamongOle , Here are the error logs. Same error on both -> Dashboard and Disk Location settings pages: [19-Oct-2025 13:56:04 Europe/Warsaw] PHP Fatal error: Uncaught TypeError: array_key_exists(): Argument #2 ($array) must be of type array, null given in /usr/local/emhttp/plugins/disklocation/pages/variables.php:135 Stack trace: #0 /usr/local/emhttp/plugins/disklocation/pages/functions.php(23): require_once() #1 /usr/local/emhttp/plugins/disklocation/pages/system.php(23): require_once('/usr/local/emht...') #2 /usr/local/emhttp/plugins/dynamix/include/DefaultPageLayout.php(864) : eval()'d code(24): require_once('/usr/local/emht...') #3 /usr/local/emhttp/plugins/dynamix/include/DefaultPageLayout.php(864): eval() #4 /usr/local/emhttp/plugins/dynamix/template.php(94): require_once('/usr/local/emht...') #5 {main} thrown in /usr/local/emhttp/plugins/disklocation/pages/variables.php on line 135The above log comes from 2025.10.17 version
-
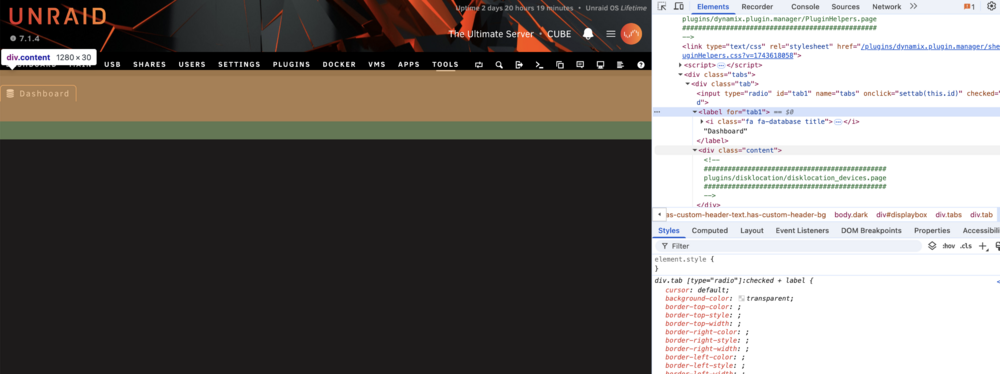
Thank you for your answer. No, I'm not using the "tray override" feature. Even when updated to the latest version, the Dashboard page was empty. I removed the plugin and tried to reinstall it. Unfortunately, this doesn't help. Dashboard and plugin configuration pages don't work. If you want I can try to gather some logs for you, but please tell me how to do it. I navigated to Tools -> Disk Location, and it looks like I have absolutely no content rendered. See the screenshot from Chrome Dev Tools: Same on the Dashboard page -> Nothing is rendered besides the header. Removing the Disk Location plugin resolves the issue.
-
Hey Folks! I'm afraid something went wrong with the last update :) After updating tge plugin to the latest version (2025.10.15), the Dashboard page is blank. Same is Tools -> Disk Location. Trying to Force SMART+DB From Tools -> Disk Location Recovery ends with HTTP 500.
-
On my server, the flash backup functionality came back to normal after updating to the hotfix version.
-
Issue still present on the lastest version of the unRAID Connect Plugin (2025.07.08.2034)
-
I had the same issue on 7.1.3. After updating to 7.1.4 it got resolved.
-
A minor issue, but affecting all my servers. I have properly configured the unRAID Connect plugin. When trying to get the header image in unRAID Connect, the request to my server always finishes with HTTP 401: Request URL: https://{MYSERVERURL}.myunraid.net:33443/graphql/api/customizations/banner Response body: { "error": { "message": "API key validation failed", "error": "Unauthorized", "statusCode": 401 }, "timestamp": "2025-07-08T11:07:32.757Z" }I assume the API key is sent in X-Api-Key request header. I can confirm it's present, but can't validate if it is the proper one. Also in the GraphQL log file, I can see the incoming request (please ignore the timestamps mismatch in the request and in the log - I copied a random occurrence from the log): [13:22:08.281] [31mERROR[39m: [36mHttpException: {"message":"API key validation failed","error":"Unauthorized","statusCode":401}[39m [90m{"logger":"api","req":{"id":"req-16c","method":"GET","url":"/graphql/api/customizations/banner"},"context":"HttpExceptionFilter"}[39m
-
Current unRAID version: 7.1.2 Previous unRAID version: 7.1.1 Plugins: up to date I have noticed a strange issue with notifications. Yesterday, my server had an unclean shutdown due to a power outage. After the server came back online, it started the usual parity check. It finished successfully, and no issues were found, but the notification shows that the Parity Check was "Cancelled": At the same time, the Parity Check history shows that everything went fine: Attached syslog and screenshots. syslog
-
Current unRAID version: 7.1.2 Previous unRAID version: 7.1.1 Plugins: all up to date Dear Community, After upgrading my home server from 7.1.1 to 7.1.2 I'm experiencing serious system instability. Randomly all the services and docker containers just become inaccessible. I can access server's login page but after providing valid credentials none of the WebGUI pages are accessible - Main, Diagnostics, etc. My server is based on Ryzen 5600G and I am aware of challenges connected - no CPU/RAM overclocking is set in the BIOS. C-States are disabled. Server was rock solid working on 7.0.1 and previous versions. That's why I assume the issues I'm experiencing are strictly related to the recent update. I tried to collect diagnostics from CLI, but unfortunately, it didn't work. I got the message "Starting diagnostics collection..." and nothing happened for the next 30 minutes. This is why the attached diagnostics file is created POST server crash, after rebooting (but still on 7.1.2 version). I hope it can give some insights about the root cause. inarius-diagnostics-20250514-0947.zip
