


interwebtech
Members
-
Joined
-
Last visited
Everything posted by interwebtech
-
FYI - (RC3) is now showing correctly on Dashboard but still missing in System Profiler.
-
Logged into server admin just to check on things (issue with Flash Drive being dropped recently) and I happened to notice this block of errors in the log. Is something borked and needs reinstall? Diagnostics attached. Nov 27 00:51:04 Tower webGUI: Successful login user root from 192.168.254.15 Nov 27 00:51:56 Tower nginx: 2021/11/27 00:51:56 [error] 11634#11634: *1314307 open() "/usr/local/emhttp/status" failed (2: No such file or directory), client: 127.0.0.1, server: localhost, request: "GET /status?full&json HTTP/1.1", host: "localhost" Nov 27 00:51:56 Tower nginx: 2021/11/27 00:51:56 [error] 11634#11634: *1314317 open() "/usr/local/emhttp/server-status" failed (2: No such file or directory), client: 127.0.0.1, server: localhost, request: "GET /server-status?format=plain HTTP/1.1", host: "localhost" Nov 27 00:51:56 Tower nginx: 2021/11/27 00:51:56 [error] 11634#11634: *1314326 FastCGI sent in stderr: "Primary script unknown" while reading response header from upstream, client: 127.0.0.1, server: localhost, request: "GET /admin/api.php?version HTTP/1.1", upstream: "fastcgi://unix:/var/run/php5-fpm.sock:", host: "localhost" Nov 27 00:51:56 Tower nginx: 2021/11/27 00:51:56 [error] 11634#11634: *1314332 open() "/usr/local/emhttp/stub_status" failed (2: No such file or directory), client: 127.0.0.1, server: localhost, request: "GET /stub_status HTTP/1.1", host: "localhost" Nov 27 00:51:57 Tower nginx: 2021/11/27 00:51:57 [error] 11634#11634: *1314343 open() "/usr/local/emhttp/server-status" failed (2: No such file or directory), client: 127.0.0.1, server: localhost, request: "GET /server-status?auto HTTP/1.1", host: "localhost" Nov 27 00:51:57 Tower nginx: 2021/11/27 00:51:57 [error] 11634#11634: *1314352 open() "/usr/local/emhttp/stub_status" failed (2: No such file or directory), client: 127.0.0.1, server: localhost, request: "GET /stub_status HTTP/1.1", host: "localhost" Nov 27 00:51:57 Tower nginx: 2021/11/27 00:51:57 [error] 11634#11634: *1314359 open() "/usr/local/emhttp/status" failed (2: No such file or directory), client: 127.0.0.1, server: localhost, request: "GET /status HTTP/1.1", host: "localhost" Nov 27 00:51:57 Tower nginx: 2021/11/27 00:51:57 [error] 11634#11634: *1314367 open() "/usr/local/emhttp/status" failed (2: No such file or directory), client: 127.0.0.1, server: localhost, request: "GET /status?full&json HTTP/1.1", host: "localhost" Nov 27 00:52:16 Tower nginx: 2021/11/27 00:52:16 [error] 11634#11634: *1314573 open() "/usr/local/emhttp/server-status" failed (2: No such file or directory), client: 127.0.0.1, server: localhost, request: "GET /server-status?auto HTTP/1.1", host: "localhost" Nov 27 00:52:17 Tower nginx: 2021/11/27 00:52:17 [error] 11634#11634: *1314582 open() "/usr/local/emhttp/us" failed (2: No such file or directory), client: 127.0.0.1, server: localhost, request: "GET /us HTTP/1.1", host: "localhost" Nov 27 00:52:17 Tower nginx: 2021/11/27 00:52:17 [error] 11634#11634: *1314587 open() "/usr/local/emhttp/server-status" failed (2: No such file or directory), client: 127.0.0.1, server: localhost, tower-diagnostics-20211127-0104.zip
-
Rebooted. Everything looks to be okay (dockers, shares, etc. have reappeared). Parity check started due to unable to write to USB at shutdown.
-
ps: email received from server when I ran the diagnostics: "Output from your job 115" mkdir: cannot create directory '/boot/logs': Input/output error sed: can't read /tower-diagnostics-20211125-0138/config/go.txt: No such file or directory Warning: copy(/boot/logs/tower-diagnostics-20211125-0138.zip): failed to open stream: No such file or directory in /usr/local/emhttp/plugins/dynamix/scripts/diagnostics on line 570
-
I logged into admin tonight and noticed banner across the top stating "Your flash drive is corrupted or offline." Pulled it out and ran Windows 11 scan/repair. Popped it back in but error banner persists. After futzing around trying to find a backup to restore (news is not good on that, only one I found is from March this year), I pulled the flash and opened it in Windows. I can see all the files in there. I put it back in server and opened the share via network and its empty. Dockers that were already started are still running and accessible (example Plex) but the entire Docker admin is gone. What do I need to do to get this fixed? Its a fairly new drive (SanDisk 64GB Cruzer Fit USB Flash Drive). Diagnostics attached. tower-diagnostics-20211125-0138.zip
-
Turns out its not buggy BIOS but perhaps looking in the wrong place. Pulled from another thread: root@Tower:~# cat /proc/cpuinfo processor : 0 vendor_id : GenuineIntel cpu family : 6 model : 165 model name : Intel(R) Core(TM) i9-10850K CPU @ 3.60GHz https://forums.unraid.net/bug-reports/prereleases/unraid-os-version-6100-rc2-available-r1565/?do=findComment&comment=16418
-
unraid-api restart fixed it
-
I'm am seeing the same thing.
-
It is running latest BIOS from April. Correction: F20 released 2021/05/26 Update CPU microcode version 0x34 Update Intel Management Engine Firmware 14.1.53.1617 BIOS update to be compatible with 11th Gen Intel® Core™ Processors --- mentions 11th gen but I believe mine is 10th gen reported by unRaid: Gigabyte Technology Co., Ltd. W480 VISION W , Version x.x American Megatrends Inc., Version F20 BIOS dated: Mon 19 Apr 2021 12:00:00 AM PDT
-
No apparent response. root@Tower:~# dmidecode -t4 # dmidecode 3.3 Getting SMBIOS data from sysfs. SMBIOS 3.2.0 present. root@Tower:~#
-
root@Tower:~# dmidecode # dmidecode 3.3 Getting SMBIOS data from sysfs. SMBIOS 3.2.0 present. Table at 0x99B45000. Handle 0x0000, DMI type 0, 26 bytes BIOS Information Vendor: American Megatrends Inc. Version: F20 Release Date: 04/19/2021 Address: 0xF0000 Runtime Size: 64 kB ROM Size: 32 MB Characteristics: PCI is supported BIOS is upgradeable BIOS shadowing is allowed Boot from CD is supported Selectable boot is supported BIOS ROM is socketed EDD is supported 5.25"/1.2 MB floppy services are supported (int 13h) 3.5"/720 kB floppy services are supported (int 13h) 3.5"/2.88 MB floppy services are supported (int 13h) Print screen service is supported (int 5h) Serial services are supported (int 14h) Printer services are supported (int 17h) ACPI is supported USB legacy is supported BIOS boot specification is supported Targeted content distribution is supported UEFI is supported BIOS Revision: 5.17 Handle 0x0001, DMI type 1, 27 bytes System Information Manufacturer: Gigabyte Technology Co., Ltd. Product Name: W480 VISION W Version: -CF Serial Number: Default string UUID: 035e02d8-04d3-0500-b806-670700080009 Wake-up Type: Power Switch SKU Number: Default string Family: W480 MB Handle 0x0002, DMI type 2, 15 bytes Base Board Information Manufacturer: Gigabyte Technology Co., Ltd. Product Name: W480 VISION W Version: x.x Serial Number: Default string Asset Tag: Default string Features: Board is a hosting board Board is replaceable Location In Chassis: Default string Chassis Handle: 0x0003 Type: Motherboard Contained Object Handles: 0 Handle 0x0003, DMI type 3, 22 bytes Chassis Information Manufacturer: Default string Type: Desktop Lock: Not Present Version: Default string Serial Number: Default string Asset Tag: Default string Boot-up State: Safe Power Supply State: Safe Thermal State: Safe Security Status: None OEM Information: 0x00000000 Height: Unspecified Number Of Power Cords: 1 Contained Elements: 0 SKU Number: Default string Handle 0x0004, DMI type 8, 9 bytes Port Connector Information Internal Reference Designator: J1A1 Internal Connector Type: None External Reference Designator: PS2Mouse External Connector Type: PS/2 Port Type: Mouse Port Handle 0x0005, DMI type 8, 9 bytes Port Connector Information Internal Reference Designator: J1A1 Internal Connector Type: None External Reference Designator: Keyboard External Connector Type: PS/2 Port Type: Keyboard Port Handle 0x0006, DMI type 8, 9 bytes Port Connector Information Internal Reference Designator: J2A1 Internal Connector Type: None External Reference Designator: TV Out External Connector Type: Mini Centronics Type-14 Port Type: Other Handle 0x0007, DMI type 8, 9 bytes Port Connector Information Internal Reference Designator: J2A2A Internal Connector Type: None External Reference Designator: COM A External Connector Type: DB-9 male Port Type: Serial Port 16550A Compatible Handle 0x0008, DMI type 8, 9 bytes Port Connector Information Internal Reference Designator: J2A2B Internal Connector Type: None External Reference Designator: Video External Connector Type: DB-15 female Port Type: Video Port Handle 0x0009, DMI type 8, 9 bytes Port Connector Information Internal Reference Designator: J3A1 Internal Connector Type: None External Reference Designator: USB1 External Connector Type: Access Bus (USB) Port Type: USB Handle 0x000A, DMI type 8, 9 bytes Port Connector Information Internal Reference Designator: J3A1 Internal Connector Type: None External Reference Designator: USB2 External Connector Type: Access Bus (USB) Port Type: USB Handle 0x000B, DMI type 8, 9 bytes Port Connector Information Internal Reference Designator: J3A1 Internal Connector Type: None External Reference Designator: USB3 External Connector Type: Access Bus (USB) Port Type: USB Handle 0x000C, DMI type 8, 9 bytes Port Connector Information Internal Reference Designator: J9A1 - TPM HDR Internal Connector Type: Other External Reference Designator: Not Specified External Connector Type: None Port Type: Other Handle 0x000D, DMI type 8, 9 bytes Port Connector Information Internal Reference Designator: J9C1 - PCIE DOCKING CONN Internal Connector Type: Other External Reference Designator: Not Specified External Connector Type: None Port Type: Other Handle 0x000E, DMI type 8, 9 bytes Port Connector Information Internal Reference Designator: J2B3 - CPU FAN Internal Connector Type: Other External Reference Designator: Not Specified External Connector Type: None Port Type: Other Handle 0x000F, DMI type 8, 9 bytes Port Connector Information Internal Reference Designator: J6C2 - EXT HDMI Internal Connector Type: Other External Reference Designator: Not Specified External Connector Type: None Port Type: Other Handle 0x0010, DMI type 8, 9 bytes Port Connector Information Internal Reference Designator: J3C1 - GMCH FAN Internal Connector Type: Other External Reference Designator: Not Specified External Connector Type: None Port Type: Other Handle 0x0011, DMI type 8, 9 bytes Port Connector Information Internal Reference Designator: J1D1 - ITP Internal Connector Type: Other External Reference Designator: Not Specified External Connector Type: None Port Type: Other Handle 0x0012, DMI type 8, 9 bytes Port Connector Information Internal Reference Designator: J9E2 - MDC INTPSR Internal Connector Type: Other External Reference Designator: Not Specified External Connector Type: None Port Type: Other Handle 0x0013, DMI type 8, 9 bytes Port Connector Information Internal Reference Designator: J9E4 - MDC INTPSR Internal Connector Type: Other External Reference Designator: Not Specified External Connector Type: None Port Type: Other Handle 0x0014, DMI type 8, 9 bytes Port Connector Information Internal Reference Designator: J9E3 - LPC HOT DOCKING Internal Connector Type: Other External Reference Designator: Not Specified External Connector Type: None Port Type: Other Handle 0x0015, DMI type 8, 9 bytes Port Connector Information Internal Reference Designator: J9E1 - SCAN MATRIX Internal Connector Type: Other External Reference Designator: Not Specified External Connector Type: None Port Type: Other Handle 0x0016, DMI type 8, 9 bytes Port Connector Information Internal Reference Designator: J9G1 - LPC SIDE BAND Internal Connector Type: Other External Reference Designator: Not Specified External Connector Type: None Port Type: Other Handle 0x0017, DMI type 8, 9 bytes Port Connector Information Internal Reference Designator: J8F1 - UNIFIED Internal Connector Type: Other External Reference Designator: Not Specified External Connector Type: None Port Type: Other Handle 0x0018, DMI type 8, 9 bytes Port Connector Information Internal Reference Designator: J6F1 - LVDS Internal Connector Type: Other External Reference Designator: Not Specified External Connector Type: None Port Type: Other Handle 0x0019, DMI type 8, 9 bytes Port Connector Information Internal Reference Designator: J2F1 - LAI FAN Internal Connector Type: Other External Reference Designator: Not Specified External Connector Type: None Port Type: Other Handle 0x001A, DMI type 8, 9 bytes Port Connector Information Internal Reference Designator: J2G1 - GFX VID Internal Connector Type: Other External Reference Designator: Not Specified External Connector Type: None Port Type: Other Handle 0x001B, DMI type 8, 9 bytes Port Connector Information Internal Reference Designator: J1G6 - AC JACK Internal Connector Type: Other External Reference Designator: Not Specified External Connector Type: None Port Type: Other Handle 0x001C, DMI type 9, 17 bytes System Slot Information Designation: J6B2 Type: x16 PCI Express Current Usage: In Use Length: Long ID: 0 Characteristics: 3.3 V is provided Opening is shared PME signal is supported Bus Address: 0000:00:01.0 Handle 0x001D, DMI type 9, 17 bytes System Slot Information Designation: J6B1 Type: x1 PCI Express Current Usage: In Use Length: Short ID: 1 Characteristics: 3.3 V is provided Opening is shared PME signal is supported Bus Address: 0000:00:1c.3 Handle 0x001E, DMI type 9, 17 bytes System Slot Information Designation: J6D1 Type: x1 PCI Express Current Usage: In Use Length: Short ID: 2 Characteristics: 3.3 V is provided Opening is shared PME signal is supported Bus Address: 0000:00:1c.4 Handle 0x001F, DMI type 9, 17 bytes System Slot Information Designation: J7B1 Type: x1 PCI Express Current Usage: In Use Length: Short ID: 3 Characteristics: 3.3 V is provided Opening is shared PME signal is supported Bus Address: 0000:00:1c.5 Handle 0x0020, DMI type 9, 17 bytes System Slot Information Designation: J8B4 Type: x1 PCI Express Current Usage: In Use Length: Short ID: 4 Characteristics: 3.3 V is provided Opening is shared PME signal is supported Bus Address: 0000:00:1c.6 Handle 0x0021, DMI type 10, 6 bytes On Board Device Information Type: Video Status: Enabled Description: To Be Filled By O.E.M. Handle 0x0022, DMI type 11, 5 bytes OEM Strings String 1: Default string Handle 0x0023, DMI type 12, 5 bytes System Configuration Options Option 1: Default string Handle 0x0024, DMI type 32, 20 bytes System Boot Information Status: No errors detected Handle 0x0025, DMI type 34, 11 bytes Management Device Description: LM78-1 Type: LM78 Address: 0x00000000 Address Type: I/O Port Handle 0x0026, DMI type 26, 22 bytes Voltage Probe Description: LM78A Location: Motherboard Status: OK Maximum Value: Unknown Minimum Value: Unknown Resolution: Unknown Tolerance: Unknown Accuracy: Unknown OEM-specific Information: 0x00000000 Nominal Value: Unknown Handle 0x0027, DMI type 36, 16 bytes Management Device Threshold Data Lower Non-critical Threshold: 1 Upper Non-critical Threshold: 2 Lower Critical Threshold: 3 Upper Critical Threshold: 4 Lower Non-recoverable Threshold: 5 Upper Non-recoverable Threshold: 6 Handle 0x0028, DMI type 35, 11 bytes Management Device Component Description: Default string Management Device Handle: 0x0025 Component Handle: 0x0026 Threshold Handle: 0x0027 Handle 0x0029, DMI type 28, 22 bytes Temperature Probe Description: LM78A Location: Motherboard Status: OK Maximum Value: Unknown Minimum Value: Unknown Resolution: Unknown Tolerance: Unknown Accuracy: Unknown OEM-specific Information: 0x00000000 Nominal Value: Unknown Handle 0x002A, DMI type 36, 16 bytes Management Device Threshold Data Lower Non-critical Threshold: 1 Upper Non-critical Threshold: 2 Lower Critical Threshold: 3 Upper Critical Threshold: 4 Lower Non-recoverable Threshold: 5 Upper Non-recoverable Threshold: 6 Handle 0x002B, DMI type 35, 11 bytes Management Device Component Description: Default string Management Device Handle: 0x0025 Component Handle: 0x0029 Threshold Handle: 0x002A Handle 0x002C, DMI type 27, 15 bytes Cooling Device Temperature Probe Handle: 0x0029 Type: Power Supply Fan Status: OK Cooling Unit Group: 1 OEM-specific Information: 0x00000000 Nominal Speed: Unknown Or Non-rotating Description: Cooling Dev 1 Handle 0x002D, DMI type 36, 16 bytes Management Device Threshold Data Lower Non-critical Threshold: 1 Upper Non-critical Threshold: 2 Lower Critical Threshold: 3 Upper Critical Threshold: 4 Lower Non-recoverable Threshold: 5 Upper Non-recoverable Threshold: 6 Handle 0x002E, DMI type 35, 11 bytes Management Device Component Description: Default string Management Device Handle: 0x0025 Component Handle: 0x002C Threshold Handle: 0x002D Handle 0x002F, DMI type 27, 15 bytes Cooling Device Temperature Probe Handle: 0x0029 Type: Power Supply Fan Status: OK Cooling Unit Group: 1 OEM-specific Information: 0x00000000 Nominal Speed: Unknown Or Non-rotating Description: Not Specified Handle 0x0030, DMI type 36, 16 bytes Management Device Threshold Data Lower Non-critical Threshold: 1 Upper Non-critical Threshold: 2 Lower Critical Threshold: 3 Upper Critical Threshold: 4 Lower Non-recoverable Threshold: 5 Upper Non-recoverable Threshold: 6 Handle 0x0031, DMI type 35, 11 bytes Management Device Component Description: Default string Management Device Handle: 0x0025 Component Handle: 0x002F Threshold Handle: 0x0030 Handle 0x0032, DMI type 29, 22 bytes Electrical Current Probe Description: ABC Location: Motherboard Status: OK Maximum Value: Unknown Minimum Value: Unknown Resolution: Unknown Tolerance: Unknown Accuracy: Unknown OEM-specific Information: 0x00000000 Nominal Value: Unknown Handle 0x0033, DMI type 36, 16 bytes Management Device Threshold Data Handle 0x0034, DMI type 35, 11 bytes Management Device Component Description: Default string Management Device Handle: 0x0025 Component Handle: 0x0032 Threshold Handle: 0x0033 Handle 0x0035, DMI type 26, 22 bytes Voltage Probe Description: LM78A Location: Power Unit Status: OK Maximum Value: Unknown Minimum Value: Unknown Resolution: Unknown Tolerance: Unknown Accuracy: Unknown OEM-specific Information: 0x00000000 Nominal Value: Unknown Handle 0x0036, DMI type 28, 22 bytes Temperature Probe Description: LM78A Location: Power Unit Status: OK Maximum Value: Unknown Minimum Value: Unknown Resolution: Unknown Tolerance: Unknown Accuracy: Unknown OEM-specific Information: 0x00000000 Nominal Value: Unknown Handle 0x0037, DMI type 27, 15 bytes Cooling Device Temperature Probe Handle: 0x0036 Type: Power Supply Fan Status: OK Cooling Unit Group: 1 OEM-specific Information: 0x00000000 Nominal Speed: Unknown Or Non-rotating Description: Cooling Dev 1 Handle 0x0038, DMI type 29, 22 bytes Electrical Current Probe Description: ABC Location: Power Unit Status: OK Maximum Value: Unknown Minimum Value: Unknown Resolution: Unknown Tolerance: Unknown Accuracy: Unknown OEM-specific Information: 0x00000000 Nominal Value: Unknown Handle 0x0039, DMI type 39, 22 bytes System Power Supply Power Unit Group: 1 Location: To Be Filled By O.E.M. Name: To Be Filled By O.E.M. Manufacturer: To Be Filled By O.E.M. Serial Number: To Be Filled By O.E.M. Asset Tag: To Be Filled By O.E.M. Model Part Number: To Be Filled By O.E.M. Revision: To Be Filled By O.E.M. Max Power Capacity: Unknown Status: Present, OK Type: Switching Input Voltage Range Switching: Auto-switch Plugged: Yes Hot Replaceable: No Input Voltage Probe Handle: 0x0035 Cooling Device Handle: 0x0037 Input Current Probe Handle: 0x0038 Handle 0x003A, DMI type 16, 23 bytes Physical Memory Array Location: System Board Or Motherboard Use: System Memory Error Correction Type: None Maximum Capacity: 64 GB Error Information Handle: Not Provided Number Of Devices: 4 Handle 0x003B, DMI type 17, 84 bytes Memory Device Array Handle: 0x003A Error Information Handle: Not Provided Total Width: 64 bits Data Width: 64 bits Size: 16 GB Form Factor: DIMM Set: None Locator: ChannelA-DIMM0 Bank Locator: BANK 0 Type: DDR4 Type Detail: Synchronous Speed: 2133 MT/s Manufacturer: 04CD Serial Number: 00000000 Asset Tag: 9876543210 Part Number: F4-4000C19-16GTZR Rank: 2 Configured Memory Speed: 2133 MT/s Minimum Voltage: 1.2 V Maximum Voltage: 1.2 V Configured Voltage: 1.2 V Memory Technology: DRAM Memory Operating Mode Capability: Volatile memory Firmware Version: Not Specified Module Manufacturer ID: Bank 5, Hex 0xCD Module Product ID: Unknown Memory Subsystem Controller Manufacturer ID: Unknown Memory Subsystem Controller Product ID: Unknown Non-Volatile Size: None Volatile Size: 16 GB Cache Size: None Logical Size: None Handle 0x003C, DMI type 17, 84 bytes Memory Device Array Handle: 0x003A Error Information Handle: Not Provided Total Width: 64 bits Data Width: 64 bits Size: 16 GB Form Factor: DIMM Set: None Locator: ChannelA-DIMM1 Bank Locator: BANK 1 Type: DDR4 Type Detail: Synchronous Speed: 2133 MT/s Manufacturer: 04CD Serial Number: 00000000 Asset Tag: 9876543210 Part Number: F4-4000C19-16GTZR Rank: 2 Configured Memory Speed: 2133 MT/s Minimum Voltage: 1.2 V Maximum Voltage: 1.2 V Configured Voltage: 1.2 V Memory Technology: DRAM Memory Operating Mode Capability: Volatile memory Firmware Version: Not Specified Module Manufacturer ID: Bank 5, Hex 0xCD Module Product ID: Unknown Memory Subsystem Controller Manufacturer ID: Unknown Memory Subsystem Controller Product ID: Unknown Non-Volatile Size: None Volatile Size: 16 GB Cache Size: None Logical Size: None Handle 0x003D, DMI type 17, 84 bytes Memory Device Array Handle: 0x003A Error Information Handle: Not Provided Total Width: 64 bits Data Width: 64 bits Size: 16 GB Form Factor: DIMM Set: None Locator: ChannelB-DIMM0 Bank Locator: BANK 2 Type: DDR4 Type Detail: Synchronous Speed: 2133 MT/s Manufacturer: 04CD Serial Number: 00000000 Asset Tag: 9876543210 Part Number: F4-4000C19-16GTZR Rank: 2 Configured Memory Speed: 2133 MT/s Minimum Voltage: 1.2 V Maximum Voltage: 1.2 V Configured Voltage: 1.2 V Memory Technology: DRAM Memory Operating Mode Capability: Volatile memory Firmware Version: Not Specified Module Manufacturer ID: Bank 5, Hex 0xCD Module Product ID: Unknown Memory Subsystem Controller Manufacturer ID: Unknown Memory Subsystem Controller Product ID: Unknown Non-Volatile Size: None Volatile Size: 16 GB Cache Size: None Logical Size: None Handle 0x003E, DMI type 17, 84 bytes Memory Device Array Handle: 0x003A Error Information Handle: Not Provided Total Width: 64 bits Data Width: 64 bits Size: 16 GB Form Factor: DIMM Set: None Locator: ChannelB-DIMM1 Bank Locator: BANK 3 Type: DDR4 Type Detail: Synchronous Speed: 2133 MT/s Manufacturer: 04CD Serial Number: 00000000 Asset Tag: 9876543210 Part Number: F4-4000C19-16GTZR Rank: 2 Configured Memory Speed: 2133 MT/s Minimum Voltage: 1.2 V Maximum Voltage: 1.2 V Configured Voltage: 1.2 V Memory Technology: DRAM Memory Operating Mode Capability: Volatile memory Firmware Version: Not Specified Module Manufacturer ID: Bank 5, Hex 0xCD Module Product ID: Unknown Memory Subsystem Controller Manufacturer ID: Unknown Memory Subsystem Controller Product ID: Unknown Non-Volatile Size: None Volatile Size: 16 GB Cache Size: None Logical Size: None Handle 0x003F, DMI type 19, 31 bytes Memory Array Mapped Address Starting Address: 0x00000000000 Ending Address: 0x00FFFFFFFFF Range Size: 64 GB Physical Array Handle: 0x003A Partition Width: 4 Handle 0x0040, DMI type 20, 35 bytes Memory Device Mapped Address Starting Address: 0x00000000000 Ending Address: 0x003FFFFFFFF Range Size: 16 GB Physical Device Handle: 0x003B Memory Array Mapped Address Handle: 0x003F Partition Row Position: Unknown Interleave Position: 1 Interleaved Data Depth: 2 Handle 0x0041, DMI type 20, 35 bytes Memory Device Mapped Address Starting Address: 0x00800000000 Ending Address: 0x00BFFFFFFFF Range Size: 16 GB Physical Device Handle: 0x003C Memory Array Mapped Address Handle: 0x003F Partition Row Position: Unknown Interleave Position: 1 Interleaved Data Depth: 2 Handle 0x0042, DMI type 20, 35 bytes Memory Device Mapped Address Starting Address: 0x00400000000 Ending Address: 0x007FFFFFFFF Range Size: 16 GB Physical Device Handle: 0x003D Memory Array Mapped Address Handle: 0x003F Partition Row Position: Unknown Interleave Position: 2 Interleaved Data Depth: 2 Handle 0x0043, DMI type 20, 35 bytes Memory Device Mapped Address Starting Address: 0x00C00000000 Ending Address: 0x00FFFFFFFFF Range Size: 16 GB Physical Device Handle: 0x003E Memory Array Mapped Address Handle: 0x003F Partition Row Position: Unknown Interleave Position: 2 Interleaved Data Depth: 2 Handle 0x0044, DMI type 130, 20 bytes OEM-specific Type Header and Data: 82 14 44 00 24 41 4D 54 00 00 00 00 00 A5 AF 02 C0 00 00 00 Handle 0x0045, DMI type 131, 64 bytes OEM-specific Type Header and Data: 83 40 45 00 31 00 00 00 0E 00 00 00 00 00 01 00 F8 00 97 06 00 00 00 00 11 00 00 00 00 00 0E 00 65 04 21 00 00 00 00 00 FE 00 4C 0D 00 00 00 00 00 00 00 00 E0 01 00 00 76 50 72 6F 00 00 00 00 Handle 0x0046, DMI type 41, 11 bytes Onboard Device Reference Designation: Onboard - Other Type: Other Status: Enabled Type Instance: 1 Bus Address: 0000:00:00.0 Handle 0x0047, DMI type 41, 11 bytes Onboard Device Reference Designation: Onboard - Video Type: Video Status: Enabled Type Instance: 1 Bus Address: 0000:00:02.0 Handle 0x0048, DMI type 41, 11 bytes Onboard Device Reference Designation: Onboard - Other Type: Other Status: Enabled Type Instance: 2 Bus Address: 0000:00:12.0 Handle 0x0049, DMI type 41, 11 bytes Onboard Device Reference Designation: Onboard - Other Type: Other Status: Enabled Type Instance: 3 Bus Address: 0000:00:14.0 Handle 0x004A, DMI type 41, 11 bytes Onboard Device Reference Designation: Onboard - Other Type: Other Status: Enabled Type Instance: 4 Bus Address: 0000:00:14.2 Handle 0x004B, DMI type 41, 11 bytes Onboard Device Reference Designation: Onboard - Other Type: Other Status: Enabled Type Instance: 5 Bus Address: 0000:00:16.0 Handle 0x004C, DMI type 41, 11 bytes Onboard Device Reference Designation: Onboard - SATA Type: SATA Controller Status: Enabled Type Instance: 1 Bus Address: 0000:00:17.0 Handle 0x004D, DMI type 41, 11 bytes Onboard Device Reference Designation: Onboard - Other Type: Other Status: Enabled Type Instance: 6 Bus Address: 0000:00:1f.0 Handle 0x004E, DMI type 41, 11 bytes Onboard Device Reference Designation: Onboard - Other Type: Other Status: Enabled Type Instance: 7 Bus Address: 0000:00:1f.4 Handle 0x004F, DMI type 41, 11 bytes Onboard Device Reference Designation: Onboard - Other Type: Other Status: Enabled Type Instance: 8 Bus Address: 0000:00:1f.5 Handle 0x0050, DMI type 41, 11 bytes Onboard Device Reference Designation: Onboard - Ethernet Type: Ethernet Status: Enabled Type Instance: 1 Bus Address: 0000:00:1f.6 Handle 0x0051, DMI type 14, 8 bytes Group Associations Name: $MEI Items: 1 0x0000 (OEM-specific) Handle 0x0052, DMI type 219, 106 bytes OEM-specific Type Header and Data: DB 6A 52 00 01 04 01 55 02 00 94 06 81 85 39 30 00 00 00 04 40 00 00 00 00 00 00 00 00 40 80 02 FF FF FF FF FF FF FF FF FF FF FF FF FF FF FF FF FF FF FF FF FF FF FF FF 03 00 00 00 80 00 00 00 00 00 00 00 00 00 00 00 00 00 00 00 00 00 00 00 00 04 00 00 00 00 00 00 00 00 00 00 00 00 00 00 00 00 00 00 00 00 00 00 00 00 Strings: MEI1 MEI2 MEI3 MEI4 Handle 0x0053, DMI type 136, 6 bytes OEM-specific Type Header and Data: 88 06 53 00 00 00 Handle 0x0054, DMI type 13, 22 bytes BIOS Language Information Language Description Format: Long Installable Languages: 15 en|US|iso8859-1 zh|TW|unicode zh|CN|unicode ru|RU|iso8859-5 de|DE|iso8859-1 ja|JP|unicode ko|KR|unicode es|ES|iso8859-1 fr|FR|iso8859-1 it|IT|iso8859-1 pt|PT|iso8859-1 vi|VI|iso8859-1 id|ID|iso8859-1 tr|TR|iso8859-1 pl|PL|iso8859-1 Currently Installed Language: en|US|iso8859-1 Handle 0x0055, DMI type 127, 4 bytes End Of Table
-
I replaced my monitor today and now getting the message "DISABLING IRQ #16" at the console. I was using an old VGA via adapter to HDMI before without issues. New monitor is native 1080P with HDMI connector. Diags attached. ps. running latest BIOS on mobo. pss. I actually tried using the DisplayPort connectors on new monitor first but couldn't get a signal so I switched to HDMI. tower-diagnostics-20210719-1229.zip
-
-
After having replaced the motherboard, CPU, and RAM, it appears to be the power supply. Running a parity check to see if it tanks again.
-
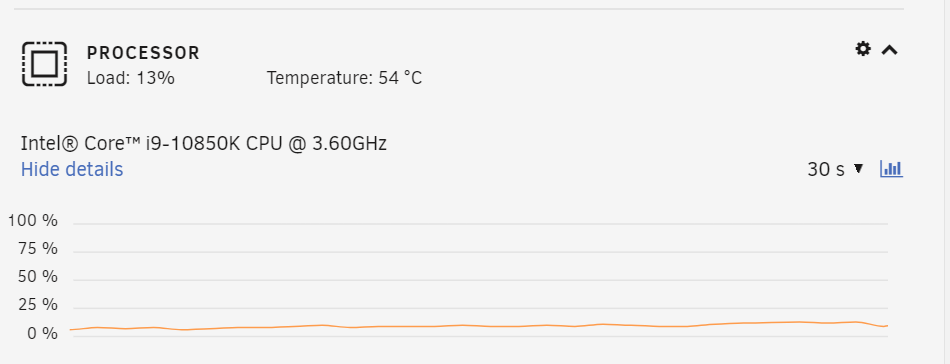
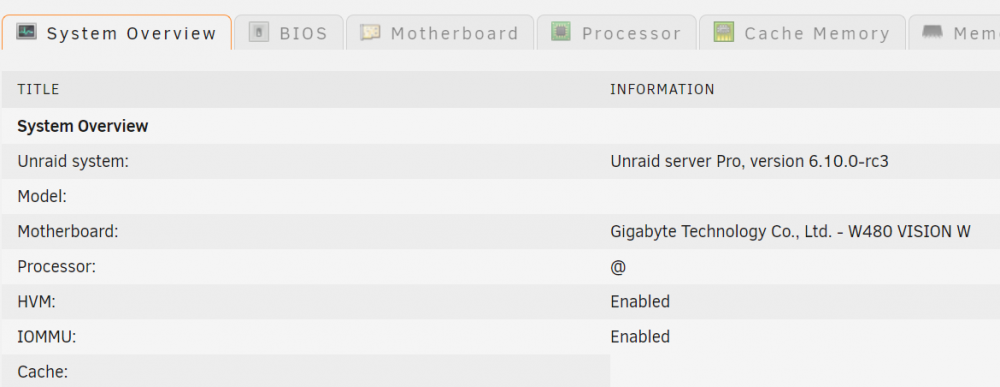
unRaid can't ID my new processor Intel® Core™ i9-10850K Processor https://ark.intel.com/content/www/us/en/ark/products/205904/intel-core-i9-10850k-processor-20m-cache-up-to-5-20-ghz.html
-
Reboot minutes into memtest. Maybe bad ram?
-
Just rebooted again barely into the parity check. Shutting down until I can get some feedback on remedies. ps. running Memtest to see whats what
-
Server rebooted itself in the middle of the night. Woke up to BIOS screen. Reboots always returned to BIOS screen. Looking at boot order I could not find USB. After a bit of futzing, I was able to repair the USB using windows pc and get into unRaid. Parity check started automatically. After a while (less than an hour?), system rebooted itself again but this time went right back into unRaid. Looked at logs and can't see anything odd. It has done the reboot thing twice now. Diag attached. tower-diagnostics-20210626-1335.zip
-
This refers to the issue I initially reported back before the 6.9.x series. It was fixed to great acclaim in 6.9 (at least from me lol). As you might recall, a change was made to the disk.cfg that caused it all to reset itself. At least that is how I understood it. The next update to 6.9.1 did not change this; still good with no erroneous warnings. However the update to 6.9.2 has brought it all back and in a much more widespread fashion. Whereas before I had usually only 3 or 4 disks (out of 15 array members) complaining, now I have 13 complaining. I even went so far as redistributing files on 3 disks that had entered the "red" warning stage so that all disks had at least 350GB of free space (all data disks are 8TB) but got another flood of critical warnings of impending doom, then "returned to normal" emails a moment later. Let me know if there is anything else you need. tower-diagnostics-20210408-2212.zip
-
Just noticed this today. The avatar image I assume gets pulled from the forum account ios missing. Top right. Included screenies and code snippet. <span class="relative z-0 flex items-center justify-center w-36px h-36px ml-8px rounded-full bg-transparent"> <img src="" alt=" Avatar" class="absolute z-10 inset-0 w-36px h-36px rounded-full overflow-hidden"> </span>
-
Disregard the celebration. I just tried to open my TV share and it lit up one drive on the server (activity light) and didn't display anything until it had spun up. Going to try setting "Cache pressure of directories on system:" back to 1.
-
I'm baaaack. I think I figured out my problem or at least my fix. I set "Minimum level depth (for adaptive depth)" to 2 from the default of 4. I also set "Cache pressure of directories on system" back to 10 from my previous 1 (I think the first one is the one that fixed it tho) Then I let the disks all spin down. Opened the share (from windows pc) with the largest number of folders in it (20k+) and it displayed instantly. It used to take for-freakin-ever to load them all up as it spun up each disk in the share. The thing that finally clicked for me (lightbulb moment) was in the help for "Minimum level depth": Sets the minimum folder level for the adaptive scan (user-share > child folder > grand child is two levels). Default is 4. For some reason I thought my depth was erm... deeper. My shares are pretty basic: Share (e.g., Movies) movie 1 movie 2 movie 3 etc. Question: was the problem related to it trying to cache the file names within the "movie n" folders. If so I have one share with 20K+ folders each with a file in it for 40K right there. I suspect not tho because the issue I had existed before that share grew so large.
-
I've done this several times to no avail.
-
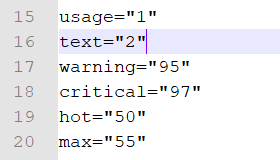
thanks for taking a look at this. Notifications range from ""high on usage (90%)" to "low on space (92%)". All drives are 8TB. tower-diagnostics-20200331-1103.zip
-
This is still happening twice a day. The notifications clearly are not obeying the drive settings, either global or per drive.


