


axipher
Members
-
Joined
-
Last visited
Everything posted by axipher
-
Others with the EAE timeout had luck with deleting codecs and either mapping the tmp folder, or fixing its permissions:
-
I haven't explored other email providers, but since Gmail is free, I set up an email address just for my server to use so that I can easily filter emails on my main email that are sent from the server's email address.
-
Ah, okay, thanks for the clarification, at least I have the new plug-in (along with your NUT) for now in case I forget to update before 6.12 official drops.
-
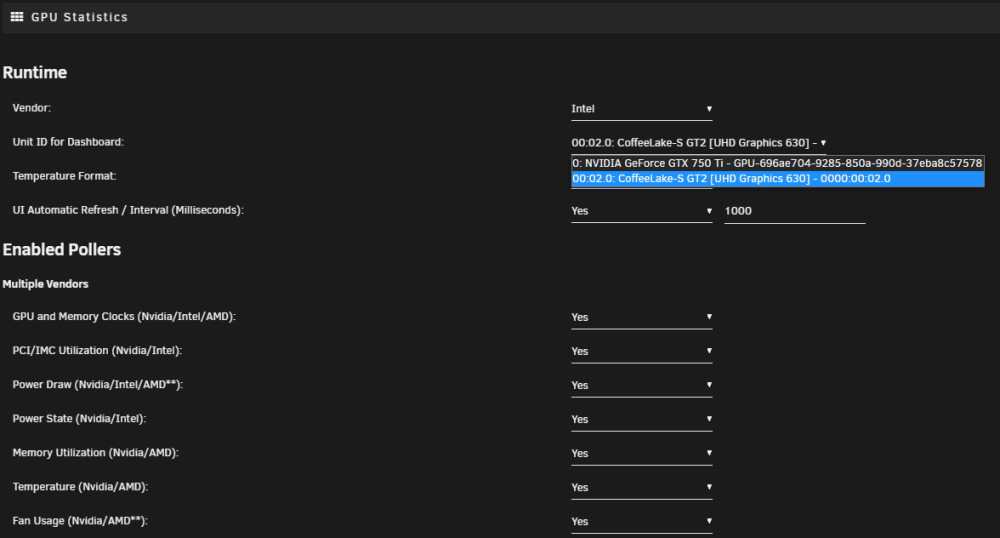
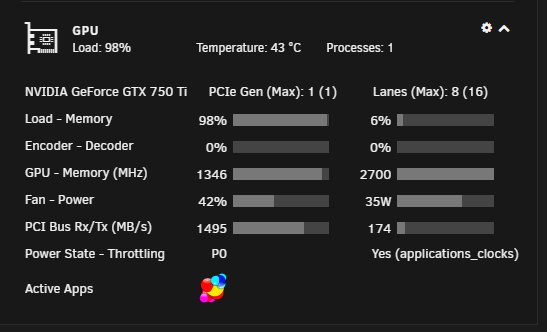
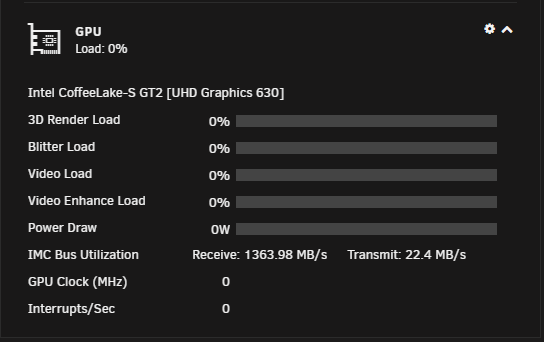
I'm using SimonF's version of the GPU Stats plugin, but for some reason can't get Multi-GPU to work. Does it support showing the stats for noth an Nvidia 750 Ti and Intel iGPU UDH 630? I'm on Unraid 6.11.5 and have the Intel GPU TOP and the Nvidia Driver plug-ins installed. Not sure if I'm missing something here, or it's not supported on 6.11.5 or this combination of GPU's. I can configure the GPU Stats plug-in for either Intel or Nvidia and they will both work for single GPU stats display on the Dashboard, just doesn't show the Multi-GPU checkboxes for me.
-
Not sure why this started appearing in my Fix Common Problems, but all my Dockers have the "up-to-date" with green checkmark so am I okay to just ignore this "problem" in Fix Common Problems? If so, why doesn't the Fix Common Problems check it any of the Dockers say "Not Available" before worrying users that their servers have problems and prompting them to install extra plugins?
-
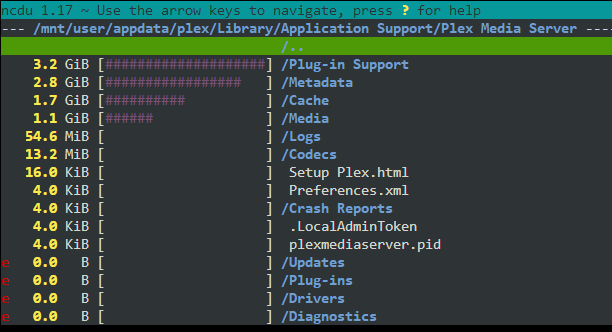
You definitely want your main Plex Appdata folder on an SSD for the best browsing experience. My current Plex library is using ~8 GB in its Appdata folder: - Movies: 2248 - TV Shows / Episodes: 444 / 12269 - Music Artists / Tracks: 31 / 1537 The Transcode directory should only have the current active streams and only for the amount of time you have set for transcode buffer, so unless you regularly have 20+ streams that your server is transcoding, you don't have to worry too much. I think mine with 4 streams once hit about 7 GB of usage, but that is purely me trying to remember something from years ago. With that said, and with Unraid supporting multiple pools now, I personally have my transcode directory mapped to an old Intel 660p SSD on it's own pool just called 'cache_temp' so that I'm not wastefully writing to my good redundant SSD cache pool. You could mount it to the linux temp file system at /dev/shm, but that is in your memory and if Plex does do something weird and doesn't delete previous transcode streams, then you eat your memory fast and cause other issues. The large Plex usage in my experience is mostly attributed to a few things: 1) Video Preview Thumbnails (Individual Library Advanced Settings > Advanced > Enable video preview thumbnails): This takes up a ton of space per video 2) Chapter thumbnails (Server Settings > Library > Generate chapter thumbnails): Takes up a good amount of space, less then video preview thumbnails, but still a good extra chunk 3) Lots of TV shows: Each episode gets meta data and with more scene changes, typically 3 or 4 episodes of TV will take up more space then a single movie
-
I believe it was related to the Data Breach Plex had earlier this year that required everyone to change their Plex password and had to reclaim servers in a lot of cases.
-
If I'm not mistaken, InfluxDB 1.3 - 1.8 don't have the web interface enabled, all command line or HTTP API on port 8083. Port 8086 is for data and returns a 404 on my working instance as well. I believe it was version 2 where they brought back the web interface for admin and visualizing.
-
Thanks for the note on needing to setup 2-factor to be able to access App Passwords. Google finally disabled "less secure apps" on my account so I had to add 2-factor so I can add an app password and get email notifications working again. Also took that opportunity to setup the discord notifications as well as those are pretty easy to set up now.
-
The change to V2 sent me through a few loops as well since this is on my hobby side so I was more or less blind-sided by it and was playing catch-up which made it feel harder than it was. Good luck on your adventure.
-
I had some similar issues when my InfluxDB docker updated to v2. Some of my home automation and sensors were all written with 1.8 endpoints and Grafana Dashboards built. I managed to get some of my data working after using this page: https://docs.influxdata.com/influxdb/v2.1/query-data/influxql/ But in the end, I found it much simpler for myself to just have two InfluxDB instances instead, one back on the 1.8 version for all my home automation, Telegraf, other dockers and basic data. Then I have another one using the newer 2.1 for my external web enabled things that I handle myself and can update with new endpoints for data writing and update all my Grafana dashboards. It does mean a little bit of extra tweaking in Grafana based on which version you are accessing and remembering the differences in the queries, but it was much easier to have two InfluxDB versions then convert all my older data that isn't publicly accessible anyway.
-
I believe traffic stats requires you to also be running a Unifi based router/gateway as well, not just a switch or access point.
-
Thanks for the Docker solution, I'll keep that in mind for if I try to go back to the current Telegraf docker once we find a solution for the smartmontools.
-
Which docker updated? InfluxDB has some changes from 1.8 to 2.0 that can break other dockers that assume basic Authorization (from my understanding) I've locked mine to: 'influxdb:1.8' Grafana has some changes form v7 to v8 that can break some dashboards and plugins using lots of the options or thresholds and value mappings I've locked mine to: 'grafana/grafana:8.0.2' Telegraf's most recent update also breaks collection of SMART and Docker statistics. I've locked mine to: 'telegraf:1.20.2-alpine' By locking the versions, then I know updates won't break those connections. It does mean you might miss out on important updates later on, so keeping tabs on those docker's development pages, or on here is still a good idea.
-
I'm running on the 'telegraf:alpine' default tag and had to make the following changes for it to work, this resulted in running 'Telegraf 1.20.3' per the docker logs. 1) Remove the following 'Post Arguments' under 'Advanced View'. This gets rid of the 'apk error' but also gets rid of 'smartmontools' which means you will lose out on some disk stats for certain dashboards in Grafana. /bin/sh -c 'apk update && apk upgrade && apk add smartmontools && telegraf' 2) Open up '/mnt/user/appdata/telegraf/telegraf.conf' and comment out the following two lines. This gets rid of the 'missing smartctl' errors and also gets rid of the constant error for not being able to access 'docker.sock'. There might be a fix for the docker problem if someone can share it as I find it really useful to monitor the memory usage of each docker from Grafana but currently had to give that up on current version of Telegraf #[[inputs.smart]] #[[inputs.docker]] As others stated, reverting to an older version works as well if the new Telegraf provides nothing new for your use case and would be the recommended route, but I just wanted to document the couple things I had to change to get the latest Telegraf docker running again alongside InfluxDB 1.8 (tag: influxdb:1.8) and Grafana v8 (tag: grafana/grafana:8.0.2). At this point I will probably spend next weekend locking most of my dockers in to current versions and setup a trial Unraid box on an old Dell Optiplex for testing latest dockers before upgrading on my main system.
-
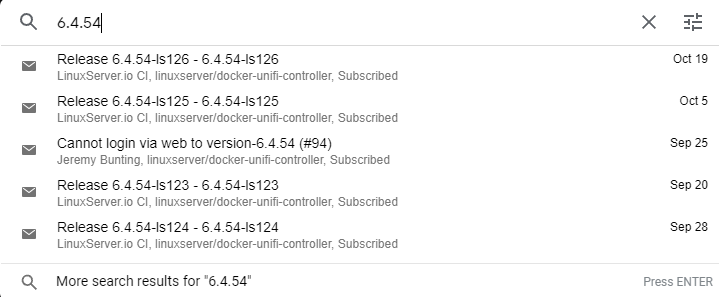
There can be updates for the 6.4.54 branch in terms of the docker, I'm not sure what they entail exactly without looking at the release note for each one:
-
I just migrated to a UDM-Pro over the weekend, but previous to that I was using 6.4.54 via UnRaid. I had no problems with the container itself, just issues with actual Unifi Software and its New Dashboard. One thing to keep in mind was that I still had DPI turned off as that was the cause of my Unifi Container ballooning in memory on previous releases and I never turned it back on. Otherwise the 6.4.54 container itself was running no issues for my previous if anyone else was loking for a few more positive reports before they upgraded. Also NGinx Proxy Container worked great for hiding my Unifi Controller behind a sub-domain of mine before I migrated to the UDM-Pro in case anyone is looking for a way to get somewhat HTTPS connection while not at home, or use Wireguard to access your network and then the container from there.
-
Thanks for this, was driving me nuts every time my Windows VM that runs some scripts reboots, the time is off by my timezone and I need to toggle off/on the auto sync time option. This change in the VM XML fixed that issue.
-
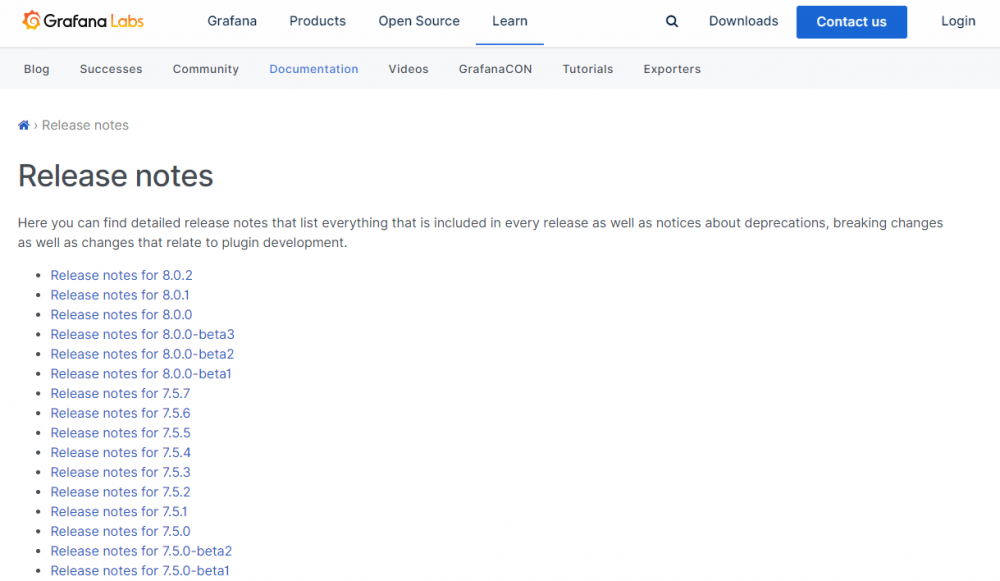
Something weird has been going on with Grafana. A short time ago, it updated to V8.0 which broke a bunch of my value mappings. I managed to fix those under new templates. Today there was another update for Grafana Docker and now it's back at version 7.5.8 which isn't even on their release page: https://grafana.com/docs/grafana/latest/release-notes/ This change back from 8.0 broke some of my dashboard panels again. for now I've gone and put in "grafana/grafana:8.0.2" as my repository to force the version as the default seems to not be consistent with what version it grabs and v7 to v8 changes a lot of the panel configs.
-
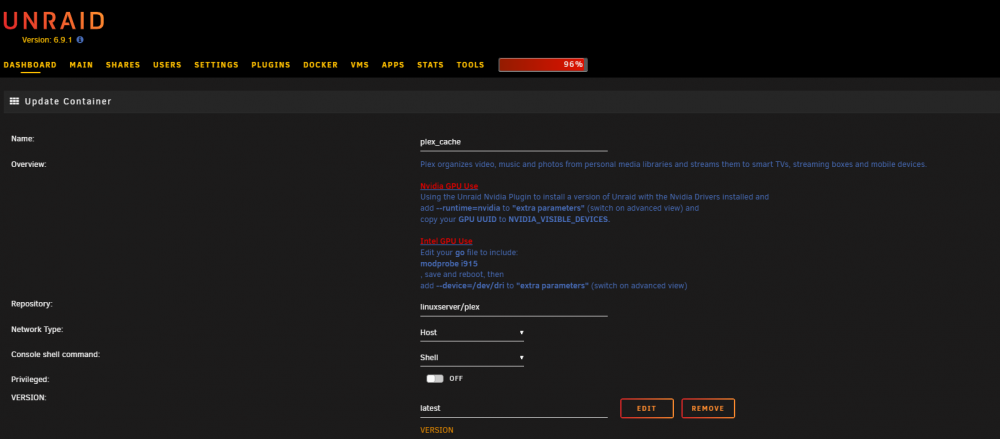
These are my current settings, at least the top main ones. The rest are just folder mappings or the port mappings.
-
This might be related to a recent Plex release that is upgrading the secure portion to using Let's Encrypt that might not be playing nicely with some browsers. I just tried and it's working for me in Firefox, Edge (Chromium) and Chrome. Not sure if that is fully implemented in the latest docker release and if Plex is forcing a change in the secure connections settings on certain installs. https://support.plex.tv/articles/206225077-how-to-use-secure-server-connections/?utm_source=Plex&utm_medium=email&utm_content=network_security_button&utm_campaign=Newsletter_Mar_24_2021_RoW_PP I do clear my cache/cookies once a month or so in all my browsers (CTRL + SHIFT + DELETE) in most to bring up the dialog. Maybe that might clear some things up for you as well if you are using the secure access mode.
-
I believe for most people, it has been traced back to having DPI turned on, turning off DPI has brought my memory usage under 1 GB, previous to that it would climb to 4-6 GB each week before the weekly CA Auto Backup kicked in and restarted the docker. There were some flags people were adding to limit memory usage, but for me, I just realized I didn't need DPI for home use and gave that up until I can afford a Dream Machine Pro to slot in my rack to replace the Unifi Docker.
-
Definitely some insight on the choices behind the Unraid and technologies and why certain versions are used instead of the latest or alternatives.
-
The Free Account for two instances works for this plan, that is what I'm using with a spare account that monitors my UnRaid host and main Windows Server that hosts TeamSpeak and Game Servers.
-
Thanks for the update to the guide mate


