


Mlatx
Members
-
Joined
-
Last visited
Everything posted by Mlatx
-
Here is what I did. 1. Copy the current USB contents somewhere 2. Wipe the usb with a fresh 6.12.3 installation 3. Replace the config folder with the one I copied I still can't boot. I'm getting stuck at the bzfirmware checksum. How can I get around this?
-
The past few days I've been having issues with unraid becoming unresponsive after nightly docker updates. I went to downgrade to 6.12.3, and now it won't boot. I have a backup, but it's on the server. The software I use to copy from the server from my mac has not copied for a while now unfortunately. Rather than remove the drives to find the correct one, how can I get back into unraid? I would hope the easiest way would be to download 6.12.4 and replace the files on the flash drive that may have been corrupted leaving the system configuration intact.
-
I'm having the same issue the last couple of days. I have syslog server running, and there are no visible errors. It runs fine during the day. When the dockers update at midnight, the UI is unavailable as well as all docker apps. Today, I downgraded to 6.12.3, and now it won't boot up. I believe I have a backup from when I moved to 6.12 or really hope I do. I had no issues with 6.12.3. Here are my syslog events since it became unresponsive. Sep 21 00:00:01 server Docker Auto Update: Community Applications Docker Autoupdate running Sep 21 00:00:01 server Docker Auto Update: Checking for available updates Sep 21 00:00:36 server Docker Auto Update: Found update for AdGuard-Home. Not set to autoupdate Sep 21 00:00:36 server Docker Auto Update: Stopping postgresql14 Sep 21 00:00:36 server kernel: veth5f54955: renamed from eth0 Sep 21 00:00:36 server Docker Auto Update: Stopping sabnzbd Sep 21 00:00:41 server Docker Auto Update: Installing Updates for postgresql14 adminer sabnzbd Sep 21 00:00:51 server Docker Auto Update: Restarting postgresql14 Sep 21 00:00:52 server kernel: eth0: renamed from veth0d401ff Sep 21 00:00:52 server Docker Auto Update: Restarting sabnzbd Sep 21 00:00:52 server sSMTP[10781]: Creating SSL connection to host Sep 21 00:00:52 server sSMTP[10781]: SSL connection using TLS_AES_256_GCM_SHA384 Sep 21 00:00:55 server sSMTP[10781]: Sent mail for "my email" (221 2.0.0 Service closing transmission channel) uid=0 username=root outbytes=661 Sep 21 00:00:55 server Docker Auto Update: Community Applications Docker Autoupdate finished Sep 21 00:01:34 server root: /etc/libvirt: 920 MiB (964665344 bytes) trimmed on /dev/loop3 Sep 21 00:01:34 server root: /var/lib/docker: 34.7 GiB (37309169664 bytes) trimmed on /dev/loop2 Sep 21 00:01:34 server root: /mnt/cache: 1.6 TiB (1781115658240 bytes) trimmed on /dev/sdc1
-
I think have fixed the issue. I’ve assigned a static IP to unraid since I’ve had the system, over 5 years. There were no issues until the past week. I don’t know what changed. I went from static to dynamic IP assigned by pfsense. All networking issues have been fixed since last night.
-
You are a life saver. I'm having networking issues and figured I'd try upgrading the bios. I forgot to enable IOMMU, and unraid booted fine. After enabling it, it would not boot. I made this change, and I can boot back in. Thank you.
-
I'm still having out of memory issues. Here is the latest log if anyone can find any issues. server-diagnostics-20230604-1726.zip
-
Looking at the syslog server results, I see these lines before it went down again. Jun 4 14:18:54 server kernel: eth0: renamed from veth8a18a6f Jun 4 14:19:41 server kernel: veth6e45a3d: renamed from eth0 Jun 4 14:20:24 server kernel: vethfa89d03: renamed from eth0 Jun 4 14:20:25 server kernel: eth0: renamed from vethf117695 Jun 4 14:22:33 server kernel: veth107ce0c: renamed from eth0 Jun 4 14:22:34 server kernel: eth0: renamed from vetha05b5fd I changed ethernet cables and saw no change. I'm going to update the bios and try again.
-
Hi All, I've recently started having issues with the unraid wan being down. I use pfsense. pfsense is the DNS provider and open dns as a backup. Never had an issue before. I installed Authelia recently. The issues are with docker's updating and accessing community applications. Here is the latest diagnostics. Any ideas on what is wrong? server-diagnostics-20230603-1314.zip
-
Thanks. I'll try limiting Ram per docker and see how that goes.
-
HI All, I'm using SWAG and just went through the Authelia video. I compile the configuration.yml in Code server. Upon starting, I'm getting the following errors. time="2023-05-28T16:16:15-05:00" level=error msg="Configuration: failed to load configuration from yaml file(/config/configuration.yml) source: yaml: line 37: did not find expected key" time="2023-05-28T16:16:15-05:00" level=error msg="Configuration: option 'jwt_secret' is required" time="2023-05-28T16:16:15-05:00" level=error msg="Configuration: authentication_backend: you must ensure either the 'file' or 'ldap' authentication backend is configured" time="2023-05-28T16:16:15-05:00" level=error msg="Configuration: access control: 'default_policy' option 'deny' is invalid: when no rules are specified it must be 'two_factor' or 'one_factor'" time="2023-05-28T16:16:15-05:00" level=error msg="Configuration: session: option 'domain' is required" time="2023-05-28T16:16:15-05:00" level=error msg="Configuration: storage: configuration for a 'local', 'mysql' or 'postgres' database must be provided" Here is the config file with relevant info hidden theme: dark jwt_secret: "16 character passcode" default_redirection_url: https://mydomain.com/ server: host: 0.0.0.0 port: 9091 read_buffer_size: 4096 write_buffer_size: 4096 path: "authelia" log: level: info file_path: /config/logs/authelia.log duo_api: hostname: myapi.duosecurity.com integration_key: myintegrationkey secret_key: mysecret authentication_backend: disable_reset_password: false file: path: /config/users_database.yml password: algorithm: argon2id iterations: 1 key_length: 32 salt_length: 16 memory: 512 parallelism: 8 access_control: default_policy: deny rules: - domain: - "sub1.mydomain.com" - "sub2.mydomain.com" - "sub3.mydomain.com" - "sub4.mydomain.com" - "sub5.mydomain.com" policy: bypass - domain: - "sub6.mydomain.com" - "sub7.mydomain.com" resources: -"^*/admin.*$" - "sub8.mydomain.com" resources: -"^*/login.*$" - "sub9.mydomain.com" resources: -"^*/identification.*$" policy: two_factor session: name: authelia_session secret: "16 character passcode" expiration: 1h inactivity: 5m remember_me_duration: 1M domain: mydomain.com regulation: max_retries: 4 find_time: 2m ban_time: 60m redis: host: redis port: 6379 password: "redis pass" database_index: 0 maximum_active_connections: 10 minimum_idle_connections: 0 storage: encryption_key: "64 character passcode no special characters" mysql: host: local ip port: 3306 database: authelia username: authelia password: "authelia pass" notifier: disable_startup_check: false smtp: username: email password: "password" host: smtp.server.com port: 587 sender: sender subject: "[Authelia] {title}" startup_check_address: [email protected] disable_require_tls: false tls: skip_verify: false minimum_version: TLS1.2 The yml formatting looks correct in code server. What can be the issue?
-
Hi All, This just started happening. The second event happened on 5/27 at about 1:50 am. The unraid GUI gets slow, and my memory is at 99% usage while the CPU is pinned to 100%. It lasted for about 10 minutes this last instance. The only things that have changed this past week are as follows. 1. Upgraded Frigate to .12 2. Installed Redis and Paperless NGX Otherwise the system has been running with the same software. I'm attaching the logs. Can someone please help ID this? server-diagnostics-20230527-1229.zip
-
i misunderstood this when it was posted above. this worked, thanks.
-
Spoke to soon. After deleting and re-installing Whoogle yesterday, it showed up-to-date. Today, it show not available again.
-
Reinstalling it fixed the issue for me as well.
-
For the last few weeks, Whoogle is showing the version as not available. Is anyone else seeing this?
-
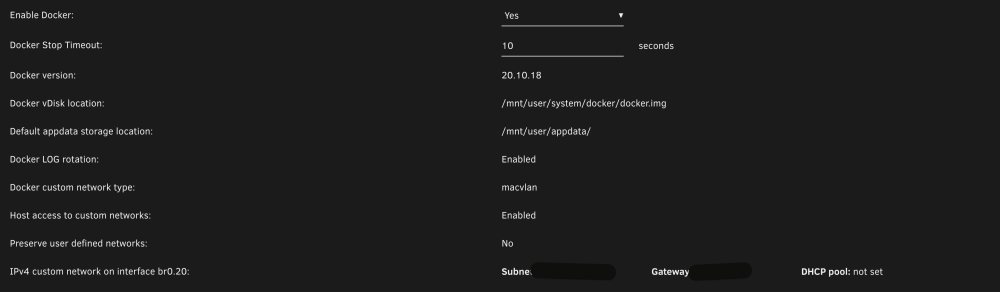
Hi All, I decided to setup docker to run in it's own vlan. I have vlan 20 setup for docker, which shows up as custom br0.20. When I assign containers to that, all runs well. I also have a proxynet network setup for nginx. That network is on the br0 network. I'd like to move that to br0.20. I have a couple of questions. Can I setup a custom proxynet network to run on br0.20? If so, how do I do that? If not, do I need to setup another vlan for a proxy network? Since I"m not on the main networks IP range, am I ok with macvlan, or should I use ipvlan? I was having macvlan broadcasts crash my server when it was in bridged mode with or without custom IP's. One last question. Docker does not automatically default to br0.20. It's the only network I have in settings. Why is that?
-
I wanted to comment here in case someone has a similar issue. Going to ipvlan with cusom IP's gave me another kind of issue. My server wasn't crashing, but my dockers were randomly going offline. Using ipvlan without custom IP's solved the problem. If I need custom IP's in the future, I'll put dockers on their own vlan.
-
I want to report back. Going from macvlan to ipvlan solved the issue. I'm not using any custom IP's. Using ipvlan with custom IP's caused problems with my containers having intermittent connectivity. If I need custom IP's in the future, I'll setup a vlan for docker.
-
I've change it to ipvlan. I am not having the same issues I had when I had custom IP's, so let' see if this addresses the problem. I'll post back if this solution works.
-
How do I find out if there is some remnant of a custom IP address? I saw this error just pop up: php-fpm[5996]: [WARNING] [pool www] server reached max_children setting (50), consider raising it Is that a macvlan issue as well?
-
I don't have any custom IP addresses. I did, and had macvlan show up before. I posted in anotherr thread I started. ipvlan did not fix the issue. It caused other issues. Then I removed all custom IP addresses. I have the standard bridge network for internal dockers. I created a network, proxynet, for external dockers. And my nzbget has no network routing through delugevpn. I've never had these issues until 6.10.
-
I think I fixed the trim issue. I did not realize I had my cache drives on the SAS controller, which apparently doesn't trim. Now that they are connected to the mobo controller, trim works. I'm not sure if that is what cause the lockup. There are some warnings and error sin the log today related to netfiler, kworker, and call trace. server-diagnostics-20221020-0909.zip
-
I recently had issues with macvlan crashing unraid. I tried to go with ipvlan, but issues with that cause me to revert back to macvlan without unique IP's. That's great and no issues with macvlan in the logs. Today, my server crashed shortly after what looks like disks spinning down. That was the last point in the log before restarting. The PSU is new, so I doubt it is a power issue. For now, I don't have disks spinning down. Also, I see ipv6 comments in the log, but unraid and pfsense are set to not use ipv6. What would cause disks spinning down to freeze the system? Why are ipv6 entries shown? To add some more context, I am seeing this error throughout the log not shown in the attached snipiet. Oct 15 00:00:20 server kernel: critical target error, dev sdg, sector 1950353247 op 0x3:(DISCARD) flags 0x800 phys_seg 1 prio class 0 Oct 15 00:00:20 server kernel: BTRFS warning (device sdg1): failed to trim 1 device(s), last error -121 I tried to manually run trim using, fstrim -v /mnt/cache/, and the same error showed up. I'll run an extended smart test on my cache drive. Could this be an imminent cache failure, or is it something else? log.txt
-
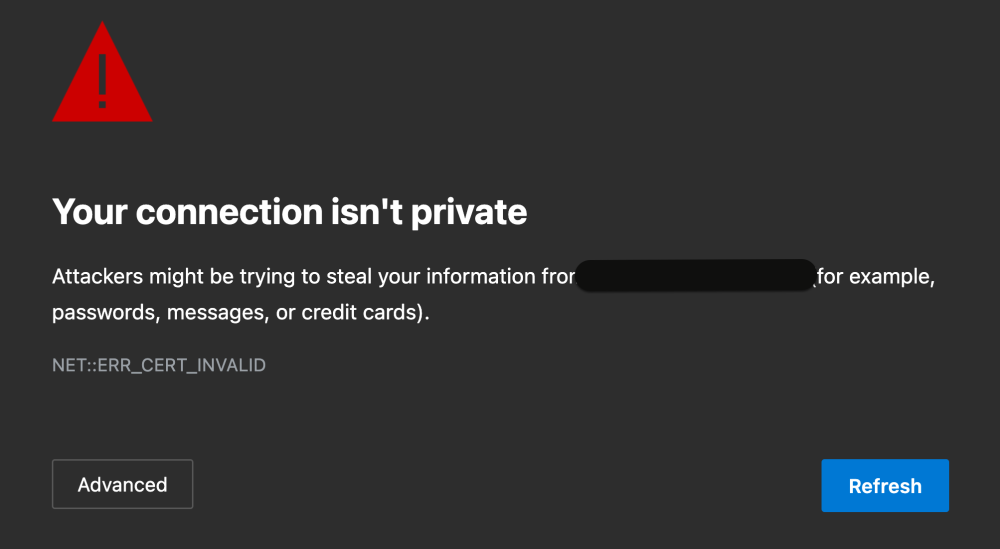
My docker image got corrupted and was in read only mode. I deleted it, restarted docker services, and re-installed apps. Deleting the docker image wiped out proxynet, so I created it again and had to go into the applications that used it and re-enable it. Since then, I get the "your connection isn't private" error. I'm using pfsense, and the configuration is fine. It's my domain hosted on cloudflare. What could be the problem? Solved: I decided to delete the app and appdata folder and start from scratch. I copied the content of appdatae elsewhere. With the new installation up, I copied back my proxy.conf files. I added my cloudflare account. Swag restarted and shutdown unexpectedly. On the restart, everything was back up and running.
-
Since that was the easiest option, that is what I did. Thanks for pointing it out.


