


Duggie264
Members
-
Joined
-
Last visited
Everything posted by Duggie264
-
So, depite this being a recent rebuild (had a struggle resolving some VPN issues) and working without fault for over a week before thsi issue manifested (immediatly post an update) I could not find the problem, however managed to reoslve the symptoms by completely erasing the appdata folders and images, and rebuilding from scratch.
-
Hi, I have just updated my container, and I have lost connection to it (Authentication Failed) from oher containers. It seems to start and run OK, however all the preferences are blank, and if I fill them in and click apply/save, they are blank again when I re-open preferences. I have downgraded, but the issue perists. I have updated back to lates and issue perisists. Any idea? Created by... ___. .__ .__ \_ |__ |__| ____ | |__ ____ ___ ___ | __ \| |/ \| | \_/ __ \\ \/ / | \_\ \ | | \ Y \ ___/ > < |___ /__|___| /___| /\___ >__/\_ \ \/ \/ \/ \/ \/ https://hub.docker.com/u/binhex/ 2024-07-02 21:48:04.780385 [info] Host is running unRAID 2024-07-02 21:48:04.809344 [info] System information Linux 8a9f79087f80 6.1.79-Unraid #1 SMP PREEMPT_DYNAMIC Fri Mar 29 13:34:03 PDT 2024 x86_64 GNU/Linux 2024-07-02 21:48:04.849722 [info] SHARED_NETWORK not defined (via -e SHARED_NETWORK), defaulting to 'no' 2024-07-02 21:48:04.885921 [info] PUID defined as '99' 2024-07-02 21:48:04.928030 [info] PGID defined as '100' 2024-07-02 21:48:04.995172 [info] UMASK defined as '000' 2024-07-02 21:48:05.032635 [info] Permissions already set for '/config' 2024-07-02 21:48:05.072638 [info] Deleting files in /tmp (non recursive)... 2024-07-02 21:48:05.132992 [info] VPN_ENABLED defined as 'yes' 2024-07-02 21:48:05.175084 [info] VPN_CLIENT defined as 'openvpn' 2024-07-02 21:48:05.214735 [info] VPN_PROV defined as 'custom' 2024-07-02 21:48:05.259379 [info] OpenVPN config file (ovpn extension) is located at /config/openvpn/privado.ams-025.udp.1194.ovpn 2024-07-02 21:48:05.360141 [info] VPN remote server(s) defined as 'ams-025.vpn.privado.io,' 2024-07-02 21:48:05.391894 [info] VPN remote port(s) defined as '1194,' 2024-07-02 21:48:05.428314 [info] VPN remote protcol(s) defined as 'udp,' 2024-07-02 21:48:05.467626 [info] VPN_DEVICE_TYPE defined as 'tun0' 2024-07-02 21:48:05.505366 [info] VPN_OPTIONS not defined (via -e VPN_OPTIONS) 2024-07-02 21:48:05.544037 [info] NAME_SERVERS defined as '84.200.69.80,37.235.1.174,1.1.1.1,37.235.1.177,84.200.70.40,1.0.0.1' 2024-07-02 21:48:11.078408 [info] LAN_NETWORK defined as '192.168.1.0/24' 2024-07-02 21:48:11.138617 [info] LAN_NETWORK exported as '192.168.1.0/24' 2024-07-02 21:48:11.176417 [info] VPN_USER defined as 'yeah you dont need to know this' 2024-07-02 21:48:11.215889 [info] VPN_PASS defined as 'or this' 2024-07-02 21:48:11.261060 [info] VPN_INPUT_PORTS not defined (via -e VPN_INPUT_PORTS), skipping allow for custom incoming ports 2024-07-02 21:48:11.300181 [info] VPN_OUTPUT_PORTS not defined (via -e VPN_OUTPUT_PORTS), skipping allow for custom outgoing ports 2024-07-02 21:48:11.337989 [info] ENABLE_STARTUP_SCRIPTS defined as 'no' 2024-07-02 21:48:11.382047 [info] ENABLE_SOCKS defined as 'no' 2024-07-02 21:48:11.423863 [info] ENABLE_PRIVOXY defined as 'no' 2024-07-02 21:48:11.462392 [info] DELUGE_DAEMON_LOG_LEVEL defined as 'info' 2024-07-02 21:48:11.501404 [info] DELUGE_WEB_LOG_LEVEL defined as 'info' 2024-07-02 21:48:11.540861 [info] DELUGE_ENABLE_WEBUI_PASSWORD defined as 'yes' 2024-07-02 21:48:11.582641 [info] Starting Supervisor... 2024-07-02 21:48:11,822 INFO Included extra file "/etc/supervisor/conf.d/delugevpn.conf" during parsing 2024-07-02 21:48:11,822 INFO Set uid to user 0 succeeded 2024-07-02 21:48:11,825 INFO supervisord started with pid 7 2024-07-02 21:48:12,829 INFO spawned: 'start-script' with pid 294 2024-07-02 21:48:12,832 INFO spawned: 'watchdog-script' with pid 295 2024-07-02 21:48:12,832 INFO reaped unknown pid 8 (exit status 0) 2024-07-02 21:48:12,840 DEBG 'start-script' stdout output: [info] VPN is enabled, beginning configuration of VPN 2024-07-02 21:48:12,840 INFO success: start-script entered RUNNING state, process has stayed up for > than 0 seconds (startsecs) 2024-07-02 21:48:12,840 INFO success: watchdog-script entered RUNNING state, process has stayed up for > than 0 seconds (startsecs) 2024-07-02 21:48:13,244 DEBG 'start-script' stdout output: [info] Adding 192.168.1.0/24 as route via adapter eth0 2024-07-02 21:48:13,247 DEBG 'start-script' stdout output: [info] ip route defined as follows... -------------------- 2024-07-02 21:48:13,249 DEBG 'start-script' stdout output: default via 172.17.0.1 dev eth0 172.17.0.0/16 dev eth0 proto kernel scope link src 172.17.0.10 192.168.1.0/24 via 172.17.0.1 dev eth0 local 127.0.0.0/8 dev lo table local proto kernel scope host src 127.0.0.1 local 127.0.0.1 dev lo table local proto kernel scope host src 127.0.0.1 broadcast 127.255.255.255 dev lo table local proto kernel scope link src 127.0.0.1 local 172.17.0.10 dev eth0 table local proto kernel scope host src 172.17.0.10 broadcast 172.17.255.255 dev eth0 table local proto kernel scope link src 172.17.0.10 2024-07-02 21:48:13,250 DEBG 'start-script' stdout output: -------------------- 2024-07-02 21:48:13,258 DEBG 'start-script' stdout output: iptable_mangle 16384 0 ip_tables 28672 3 iptable_filter,iptable_nat,iptable_mangle x_tables 45056 12 ip6table_filter,xt_conntrack,iptable_filter,xt_tcpudp,xt_addrtype,xt_nat,ip6_tables,ip_tables,iptable_nat,xt_MASQUERADE,iptable_mangle,xt_mark 2024-07-02 21:48:13,258 DEBG 'start-script' stdout output: [info] iptable_mangle support detected, adding fwmark for tables 2024-07-02 21:48:13,379 DEBG 'start-script' stdout output: [info] iptables defined as follows... -------------------- 2024-07-02 21:48:13,382 DEBG 'start-script' stdout output: -P INPUT DROP -P FORWARD DROP -P OUTPUT DROP -A INPUT -s correct Public IP/32 -i eth0 -j ACCEPT -A INPUT -s 172.17.0.0/16 -d 172.17.0.0/16 -j ACCEPT -A INPUT -s correct Public IP/32 -i eth0 -j ACCEPT -A INPUT -i eth0 -p tcp -m tcp --dport 8112 -j ACCEPT -A INPUT -i eth0 -p udp -m udp --dport 8112 -j ACCEPT -A INPUT -s 192.168.1.0/24 -d 172.17.0.0/16 -i eth0 -p tcp -m tcp --dport 58846 -j ACCEPT -A INPUT -p icmp -m icmp --icmp-type 0 -j ACCEPT -A INPUT -i lo -j ACCEPT -A INPUT -i tun0 -j ACCEPT -A OUTPUT -d correct Public IP/32 -o eth0 -j ACCEPT -A OUTPUT -s 172.17.0.0/16 -d 172.17.0.0/16 -j ACCEPT -A OUTPUT -d correct Public IP/32 -o eth0 -j ACCEPT -A OUTPUT -o eth0 -p tcp -m tcp --sport 8112 -j ACCEPT -A OUTPUT -o eth0 -p udp -m udp --sport 8112 -j ACCEPT -A OUTPUT -s 172.17.0.0/16 -d 192.168.1.0/24 -o eth0 -p tcp -m tcp --sport 58846 -j ACCEPT -A OUTPUT -p icmp -m icmp --icmp-type 8 -j ACCEPT -A OUTPUT -o lo -j ACCEPT -A OUTPUT -o tun0 -j ACCEPT 2024-07-02 21:48:13,385 DEBG 'start-script' stdout output: -------------------- 2024-07-02 21:48:13,387 DEBG 'start-script' stdout output: [info] Starting OpenVPN (non daemonised)... 2024-07-02 21:48:13,399 DEBG 'start-script' stdout output: 2024-07-02 21:48:13 Note: --data-ciphers-fallback with cipher 'AES-256-CBC' disables data channel offload. 2024-07-02 21:48:13 OpenVPN 2.6.11 [git:makepkg/ddf6bf6d2a135835+] x86_64-pc-linux-gnu [SSL (OpenSSL)] [LZO] [LZ4] [EPOLL] [PKCS11] [MH/PKTINFO] [AEAD] [DCO] built on Jun 20 2024 2024-07-02 21:48:13 library versions: OpenSSL 3.3.1 4 Jun 2024, LZO 2.10 2024-07-02 21:48:13,400 DEBG 'start-script' stdout output: 2024-07-02 21:48:13 DCO version: N/A 2024-07-02 21:48:13,400 DEBG 'start-script' stdout output: 2024-07-02 21:48:13 NOTE: the current --script-security setting may allow this configuration to call user-defined scripts 2024-07-02 21:48:13,401 DEBG 'start-script' stdout output: 2024-07-02 21:48:13 TCP/UDP: Preserving recently used remote address: [AF_INET]correct Public IP:1194 2024-07-02 21:48:13 Socket Buffers: R=[212992->212992] S=[212992->212992] 2024-07-02 21:48:13 UDPv4 link local: (not bound) 2024-07-02 21:48:13 UDPv4 link remote: [AF_INET]correct Public IP:1194 2024-07-02 21:48:13,419 DEBG 'start-script' stdout output: 2024-07-02 21:48:13 TLS: Initial packet from [AF_INET]correct Public IP:1194, sid=92d6a28f f5ca694f 2024-07-02 21:48:13,489 DEBG 'start-script' stdout output: 2024-07-02 21:48:13 VERIFY OK: depth=1, CN=Privado 2024-07-02 21:48:13,489 DEBG 'start-script' stdout output: 2024-07-02 21:48:13 VERIFY KU OK 2024-07-02 21:48:13 Validating certificate extended key usage 2024-07-02 21:48:13 ++ Certificate has EKU (str) TLS Web Server Authentication, expects TLS Web Server Authentication 2024-07-02 21:48:13 VERIFY EKU OK 2024-07-02 21:48:13 VERIFY OK: depth=0, CN=ams-025.vpn.privado.io 2024-07-02 21:48:13,650 DEBG 'start-script' stdout output: 2024-07-02 21:48:13 Control Channel: TLSv1.2, cipher SSLv3 DHE-RSA-AES256-SHA, peer certificate: 4096 bits RSA, signature: RSA-SHA512, peer temporary key: 4096 bits DH 2024-07-02 21:48:13 [ams-025.vpn.privado.io] Peer Connection Initiated with [AF_INET]correct Public IP:1194 2024-07-02 21:48:13 TLS: move_session: dest=TM_ACTIVE src=TM_INITIAL reinit_src=1 2024-07-02 21:48:13,651 DEBG 'start-script' stdout output: 2024-07-02 21:48:13 TLS: tls_multi_process: initial untrusted session promoted to trusted 2024-07-02 21:48:14,903 DEBG 'start-script' stdout output: 2024-07-02 21:48:14 SENT CONTROL [ams-025.vpn.privado.io]: 'PUSH_REQUEST' (status=1) 2024-07-02 21:48:14,918 DEBG 'start-script' stdout output: 2024-07-02 21:48:14 PUSH: Received control message: 'PUSH_REPLY,redirect-gateway def1 bypass-dhcp,dhcp-option DNS 198.18.0.1,dhcp-option DNS 198.18.0.2,rcvbuf 493216,sndbuf 493216,explicit-exit-notify 5,route-gateway 172.21.46.1,topology subnet,ping 20,ping-restart 40,ifconfig 172.21.46.194 255.255.254.0,peer-id 13' 2024-07-02 21:48:14 OPTIONS IMPORT: --sndbuf/--rcvbuf options modified 2024-07-02 21:48:14,919 DEBG 'start-script' stdout output: 2024-07-02 21:48:14 Socket Buffers: R=[212992->986432] S=[212992->986432] 2024-07-02 21:48:14 OPTIONS IMPORT: --ifconfig/up options modified 2024-07-02 21:48:14 OPTIONS IMPORT: route options modified 2024-07-02 21:48:14 OPTIONS IMPORT: route-related options modified 2024-07-02 21:48:14 OPTIONS IMPORT: --ip-win32 and/or --dhcp-option options modified 2024-07-02 21:48:14 Using peer cipher 'AES-256-CBC' 2024-07-02 21:48:14 net_route_v4_best_gw query: dst 0.0.0.0 2024-07-02 21:48:14 net_route_v4_best_gw result: via 172.17.0.1 dev eth0 2024-07-02 21:48:14 ROUTE_GATEWAY 172.17.0.1/255.255.0.0 IFACE=eth0 HWADDR=02:42:ac:11:00:0a 2024-07-02 21:48:14,919 DEBG 'start-script' stdout output: 2024-07-02 21:48:14 TUN/TAP device tun0 opened 2024-07-02 21:48:14 net_iface_mtu_set: mtu 1500 for tun0 2024-07-02 21:48:14,919 DEBG 'start-script' stdout output: 2024-07-02 21:48:14 net_iface_up: set tun0 up 2024-07-02 21:48:14 net_addr_v4_add: 172.21.46.194/23 dev tun0 2024-07-02 21:48:14 /root/openvpnup.sh tun0 1500 0 172.21.46.194 255.255.254.0 init 2024-07-02 21:48:14,927 DEBG 'start-script' stdout output: 2024-07-02 21:48:14 Data Channel: cipher 'AES-256-CBC', auth 'SHA256', peer-id: 13 2024-07-02 21:48:14 Timers: ping 20, ping-restart 40 2024-07-02 21:48:14 Protocol options: explicit-exit-notify 5 2024-07-02 21:48:18,182 DEBG 'start-script' stdout output: 2024-07-02 21:48:18 net_route_v4_add: correct Public IP/32 via 172.17.0.1 dev [NULL] table 0 metric -1 2024-07-02 21:48:18,182 DEBG 'start-script' stdout output: 2024-07-02 21:48:18 net_route_v4_add: 0.0.0.0/1 via 172.21.46.1 dev [NULL] table 0 metric -1 2024-07-02 21:48:18 net_route_v4_add: 128.0.0.0/1 via 172.21.46.1 dev [NULL] table 0 metric -1 2024-07-02 21:48:18 net_route_v4_add: 0.0.0.0/0 via 172.21.46.1 dev [NULL] table 0 metric -1 2024-07-02 21:48:18 Initialization Sequence Completed 2024-07-02 21:48:21,038 DEBG 'start-script' stdout output: [info] Attempting to get external IP using 'http://checkip.amazonaws.com'... 2024-07-02 21:48:21,178 DEBG 'start-script' stdout output: [info] Successfully retrieved external IP address correct Public IP.10 2024-07-02 21:48:21,179 DEBG 'start-script' stdout output: [info] VPN provider 'custom' not supported for automatic port forwarding, skipping incoming port assignment 2024-07-02 21:48:21,214 DEBG 'watchdog-script' stdout output: [info] Deluge listening interface IP 0.0.0.0 and VPN provider IP 172.21.46.194 different, marking for reconfigure 2024-07-02 21:48:21,222 DEBG 'watchdog-script' stdout output: [info] Deluge not running 2024-07-02 21:48:21,228 DEBG 'watchdog-script' stdout output: [info] Deluge Web UI not running 2024-07-02 21:48:21,232 DEBG 'watchdog-script' stdout output: [info] Attempting to start Deluge... [info] Removing deluge pid file (if it exists)... 2024-07-02 21:48:21,651 DEBG 'watchdog-script' stdout output: [info] Deluge key 'listen_interface' currently has a value of '172.21.32.153' [info] Deluge key 'listen_interface' will have a new value '172.21.46.194' [info] Writing changes to Deluge config file '/config/core.conf'... 2024-07-02 21:48:21,978 DEBG 'watchdog-script' stdout output: [info] Deluge key 'outgoing_interface' currently has a value of 'tun0' [info] Deluge key 'outgoing_interface' will have a new value 'tun0' [info] Writing changes to Deluge config file '/config/core.conf'... 2024-07-02 21:48:22,260 DEBG 'watchdog-script' stdout output: [info] Deluge key 'default_daemon' currently has a value of '59ca9119f156488fba9c7a3ee7ad56cd' [info] Deluge key 'default_daemon' will have a new value '59ca9119f156488fba9c7a3ee7ad56cd' [info] Writing changes to Deluge config file '/config/web.conf'... 2024-07-02 21:48:22,315 DEBG 'watchdog-script' stdout output: [info] Deluge process started [info] Waiting for Deluge process to start listening on port 58846... 2024-07-02 21:48:22,786 DEBG 'watchdog-script' stdout output: [info] Deluge process listening on port 58846 2024-07-02 21:48:25,457 DEBG 'watchdog-script' stderr output: <Deferred at 0x14f0f21704d0 current result: None> 2024-07-02 21:48:25,564 DEBG 'watchdog-script' stdout output: [info] No torrents with state 'Error' found 2024-07-02 21:48:25,565 DEBG 'watchdog-script' stdout output: [info] Starting Deluge Web UI... 2024-07-02 21:48:25,565 DEBG 'watchdog-script' stdout output: [info] Deluge Web UI started Any Ideas?
-
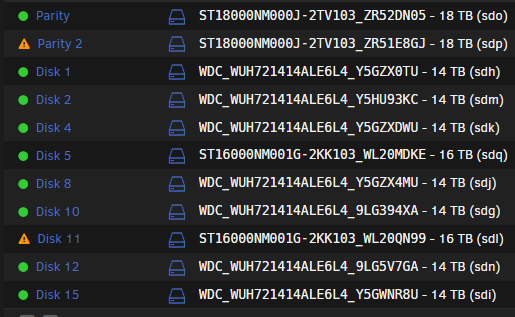
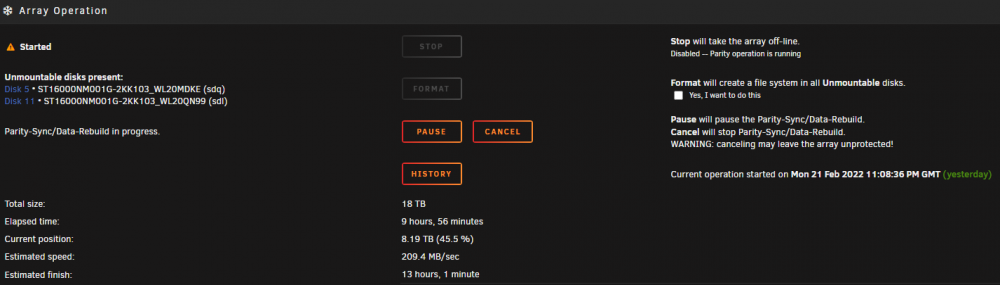
Thanks @JorgeB, Just for completeness: I had a couple of disk failures that resulted in a dual Parity swap procedure - Successfull I then recieved some newer replacement HDD that necessitated another dual parity swap procedure. Parity copy went smoothly, prior to the disk rebuild, I accidentally clicked a drop down on the main page. This meant that I would have to redo the parity copy (16-->18TB). I then did a search, and came across this thread (which should be linked from ther Parity Swap procedure page!) Everything would have went well, had I not missed the bit about dual parity and not using the "29" at the end of the cmds... so I now have this: and this Disks 5 and 11 were the locations of the original missing/failed disks, that should have been rebuilt on the two old p[arity disks that you can see occupying thier slots (MDKE anbd QN99) However as I incorrectly entered 29... I am guessing that: Parity 1 Valid Parity 2 Invalid (being rebuilt across disk set as you confirmed above) Disk 5 (original Parity 1) - should be getting overwritten with original emulated Disk 5 data? Disk 11 (original Parity 2) - should be getting overwritten with origianl emulated Disk 11 data? So I suppose the real question is, what will the outcome of this be?
-
So when starting the Array, would it try and rebuild P2 from the original P2 disk first, or would it just rebuild parity 2 from across the disk set (thus resulting in the loss of data from the failed disk the old P2 is replaceing, I assume?)
-
@JorgeB, just out of curiosity, if you had dual parity, and left in the numbers "29" after each command, then proceeded to start the array, what is the likely outcome.... wish I was asking for a friend... 🤔🤨😒🙄😔
-
Awesome, thanks for the help and information! best get swapping 😎
-
Yeah I am positive - they were brand new drives and were clicking from the get go - one failed to even initialise, and by the time I realised both the other drives had mechanical issues, one had already successfully hounded the array, which subsequently died. Also happy with the parity swap procedure, just wasn’t sure how much more risk there would be swapping out a parity drive when there are already two failed data drives! cheers for your assistance bud, much appreciated!
-
Yeah two dead data drives.
-
Thanks @itimpi So I already have dual parity, the issue now is I have dual (array) drive failures. I do have 2 16TB drives, but will I be able to swap out one of the Parity drives, when I already have two disks dead?
-
BLUF: Can I replace a failed disk with a larger than parity disk (temporarily)? Background: I purchased three disks, one failed on testing, the other two were installed, subsequently one failed. The manufacturer, as part of the returns process has refunded the entire purchase amount to paypal for me, but I am now time limited in and have to return all three disks. All my disks (array and dual parity) are 14TB. I have two brand new 16TB disks. My array now shows two disks missing (as expected) and is running "at risk" Question 1. Will Unraid allow me to (temporarily) replace the missing 14TB drives with 16TB drives (I appreciate how parity works, but do not know A) if the extra two TB on the array disks will cause a parity fail, or B) if they will just be unprotected, or C) if Unraid will even allow the process). I have further 16TB drives on the way that will replace the parity drives in the event of B) 2. Am I correct in assuming that as I am missing two disks, I will be unable to swap a 14TB parity drive out for a 16TB (i.e. the swap-disable process?)
-
had this a couple of times, was rebuilding so didn't really care as I was due restarts anyway. Just had it whilst chasing what makes my Docker Log fill up so quickly. Specifically I am running Microsoft Edge Version 97.0.1072.55 (Official build) (64-bit), and I opened the terminal from the dashboard, as soon as I entered the command "co=$(docker inspect --format='{{.Name}}' $(docker ps -aq --no-trunc) | sed 's/^.\(.*\)/\1/' | sort); for c_name in $co; do c_size=$(docker inspect --format={{.ID}} $c_name | xargs -I @ sh -c 'ls -hl /var/lib/docker/containers/@/@-json.log' | awk '{print $5 }'); YE='\033[1;33m'; NC='\033[0m'; PI='\033[1;35m'; RE='\033[1;31m'; case "$c_size" in *"K"*) c_size=${YE}$c_size${NC};; *"M"*) p=${c_size%.*}; q=${p%M*}; r=${#q}; if [[ $r -lt 3 ]]; then c_size=${PI}$c_size${NC}; else c_size=${RE}$c_size${NC}; fi ;; esac; echo -e "$c_name $c_size"; done " I started getting the nginx hissy fit Jan 10 10:18:44 TheNewdaleBeast nginx: 2022/01/10 10:18:44 [error] 3871#3871: nchan: Out of shared memory while allocating message of size 10016. Increase nchan_max_reserved_memory. Jan 10 10:18:44 TheNewdaleBeast nginx: 2022/01/10 10:18:44 [error] 3871#3871: *4554856 nchan: error publishing message (HTTP status code 500), client: unix:, server: , request: "POST /pub/update2?buffer_length=1 HTTP/1.1", host: "localhost" Jan 10 10:18:44 TheNewdaleBeast nginx: 2022/01/10 10:18:44 [error] 3871#3871: MEMSTORE:00: can't create shared message for channel /update2) I have 256GB Memory, and was at less than 11% utilisation so that wasn't an obvious issue, the output from df -h shows no issues either. Filesystem Size Used Avail Use% Mounted on rootfs 126G 812M 126G 1% / tmpfs 32M 2.5M 30M 8% /run /dev/sda1 15G 617M 14G 5% /boot overlay 126G 812M 126G 1% /lib/firmware overlay 126G 812M 126G 1% /lib/modules devtmpfs 126G 0 126G 0% /dev tmpfs 126G 0 126G 0% /dev/shm cgroup_root 8.0M 0 8.0M 0% /sys/fs/cgroup tmpfs 128M 28M 101M 22% /var/log tmpfs 1.0M 0 1.0M 0% /mnt/disks tmpfs 1.0M 0 1.0M 0% /mnt/remotes /dev/md1 13T 6.4T 6.4T 51% /mnt/disk1 /dev/md2 13T 9.5T 3.3T 75% /mnt/disk2 /dev/md4 13T 767G 12T 6% /mnt/disk4 /dev/md5 3.7T 3.0T 684G 82% /mnt/disk5 /dev/md8 13T 9.6T 3.2T 76% /mnt/disk8 /dev/md10 13T 9.1T 3.7T 72% /mnt/disk10 /dev/md11 13T 8.9T 3.9T 70% /mnt/disk11 /dev/md12 13T 7.0T 5.8T 55% /mnt/disk12 /dev/md15 13T 5.7T 7.2T 45% /mnt/disk15 /dev/sdq1 1.9T 542G 1.3T 30% /mnt/app-sys-cache /dev/sdh1 1.9T 17M 1.9T 1% /mnt/download-cache /dev/nvme0n1p1 932G 221G 711G 24% /mnt/vm-cache shfs 106T 60T 46T 57% /mnt/user0 shfs 106T 60T 46T 57% /mnt/user /dev/loop2 35G 13G 21G 38% /var/lib/docker /dev/loop3 1.0G 4.2M 905M 1% /etc/libvirt tmpfs 26G 0 26G 0% /run/user/0 I then ran the following commands in order to restore connectivity (after first restart I had no access) root@TheNewdaleBeast:~# /etc/rc.d/rc.nginx restart Checking configuration for correct syntax and then trying to open files referenced in configuration... nginx: the configuration file /etc/nginx/nginx.conf syntax is ok nginx: configuration file /etc/nginx/nginx.conf test is successful Shutdown Nginx gracefully... Found no running processes. Nginx is already running root@TheNewdaleBeast:~# /etc/rc.d/rc.nginx restart Nginx is not running root@TheNewdaleBeast:~# /etc/rc.d/rc.nginx start Starting Nginx server daemon... and normal service was restored Jan 10 10:22:40 TheNewdaleBeast root: Starting unraid-api v2.26.14 Jan 10 10:22:40 TheNewdaleBeast root: Loading the "production" environment. Jan 10 10:22:41 TheNewdaleBeast root: Daemonizing process. Jan 10 10:22:41 TheNewdaleBeast root: Daemonized successfully! Jan 10 10:22:42 TheNewdaleBeast unraid-api[13364]: ✔️ UNRAID API started successfully! Not sure if this is helpful, but to me it appeared that issue was caused (or coincidental with) use of web terminal.
-
Good news (Phew) rebooted and restarted Array and all is looking good so far!
-
Yeah I couldn't either - just wanted to ask first this time, rather than waiting until I am deeply mired in a rebooted server with no Array, no Diagnostics and all I have is a sheepish grin!
-
@rxnelson - Good Point, and most likely why it didn't work for me! I had just moved my 1080 GTX from an i7 6700K based gaming rig to my Dual Xeon E5-2660 Unraid rig, and completely forgot that the Xeons don't have integrated graphics 🙄However I would be curious to know if it will work with an integrated or non-nvidia GPU? Oh and apologies for late reply - I am not getting notifications for some reason!
-
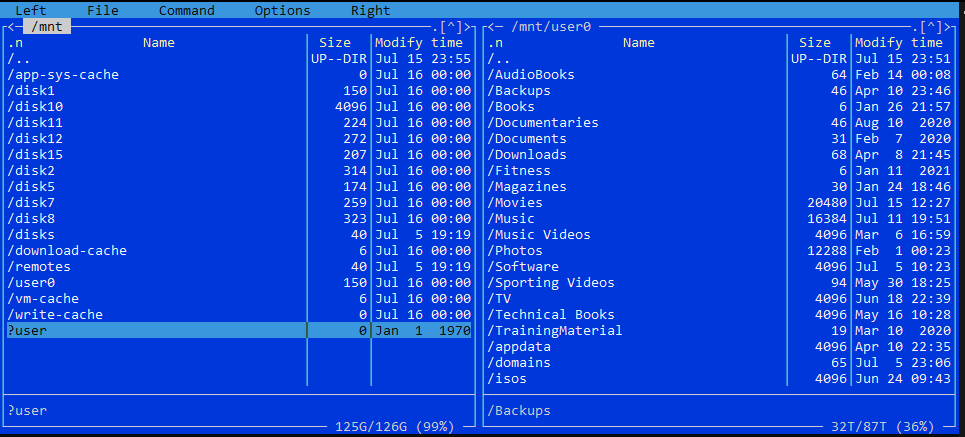
BLUF: User Shares Missing. in MC mnt/user is missing, mnt/user0 is there and there is a ?user in red. Server has not yet been restarted (only array stop/started) Good evening, I had 13x256GB, 1x1TB SSD and 1x1TB NVME in a giant cache pool. With multiple cache pools now a thing, I wanted to break down my cache and sort out my shares as follows: Get Rid of old cache pool: Disabled Docker and VM Set all my shares to Cache: Yes. Called in Mover to move everything to the array* ** Shut down the array. Removed all drives from the cache pool, then deleted it. * When mover finished there were still some appdata files in Cache and Disk 2 so I spun up MC via ssh and did the following: 1. mnt/disk2/appdata ---> mnt/disk10/ 2. mnt/cache/appdata ---> mnt/disk10/ **When I exited MC and returned to the GUI window I noticed that all my user shares had disappeared (Ahhh F%$£!) I immediately downloaded diagnostics - the one ending 2305 I then spent a bit of time looking for similar errors - wasn't massively concerned as all data is still there. Create New Cache Pools Created the 4 new cache pools. Set the FS to XFS for the single drives and Auto for the actual pools Started the array back up and formatted everything to mount them again. Still no User shares - immediately downloaded diagnostics again - the one ending 2355 on looking in MC I see this: no User on the left, but User0 on the right shows the Shares structure still there. I fully accept that I may have done something wrong/stupid etc, but have three questions: 1. Can someone help? and if so 2. How do I recover my Shares and 3. What did I do that actually screwed it up (as I do like to learn, albeit painfully) Many thanks in anticipation of your assistance! thenewdalebeast-diagnostics-20210715-2305.zip thenewdalebeast-diagnostics-20210715-2355.zip
-
Allegedly, from 465.xx.onwards nvidia drivers now support passthrough (GPU Passthrough), as passthrough was software hobbled in drivers to "force" upgrades/purchase of Tesla/Quadro. However unable to passthrough EVGA 1080 GTX SC - 8GB successfully to a Win 10 VM - I czn see it in device manager but is a code 43 regardless. Will attempt this script this week at some point if I get time.
-
Hi, just started getting this crash today, any ideas? 2020-04-19 15:23:48.353687 [info] System information Linux ################# 4.19.107-Unraid #1 SMP Thu Mar 5 13:55:57 PST 2020 x86_64 GNU/Linux 2020-04-19 15:23:48.383161 [info] PUID defined as '99' 2020-04-19 15:23:48.415129 [info] PGID defined as '100' 2020-04-19 15:23:48.918075 [info] UMASK defined as '000' 2020-04-19 15:23:48.945899 [info] Permissions already set for volume mappings 2020-04-19 15:23:48.972882 [warn] TRANS_DIR not defined,(via -e TRANS_DIR), defaulting to '/config/tmp' 2020-04-19 15:23:49.004719 [info] Deleting files in /tmp (non recursive)... 2020-04-19 15:23:49.030933 [info] Starting Supervisor... 2020-04-19 15:23:49,197 INFO Included extra file "/etc/supervisor/conf.d/plexmediaserver.conf" during parsing 2020-04-19 15:23:49,197 INFO Set uid to user 0 succeeded 2020-04-19 15:23:49,199 INFO supervisord started with pid 6 2020-04-19 15:23:49.004719 [info] Deleting files in /tmp (non recursive)... 2020-04-19 15:23:49.030933 [info] Starting Supervisor... 2020-04-19 15:23:49,197 INFO Included extra file "/etc/supervisor/conf.d/plexmediaserver.conf" during parsing 2020-04-19 15:23:49,197 INFO Set uid to user 0 succeeded 2020-04-19 15:23:49,199 INFO supervisord started with pid 6 2020-04-19 15:23:50,202 INFO spawned: 'plexmediaserver' with pid 55 2020-04-19 15:23:50,202 INFO reaped unknown pid 7 2020-04-19 15:23:50,437 DEBG fd 8 closed, stopped monitoring <POutputDispatcher at 139734334410080 for <Subprocess at 139734334410224 with name plexmediaserver in state STARTING> (stdout)> 2020-04-19 15:23:50,438 DEBG fd 10 closed, stopped monitoring <POutputDispatcher at 139734334410368 for <Subprocess at 139734334410224 with name plexmediaserver in state STARTING> (stderr)> 2020-04-19 15:23:50,438 INFO exited: plexmediaserver (exit status 255; not expected) 2020-04-19 15:23:50,438 DEBG received SIGCHLD indicating a child quit 2020-04-19 15:23:51,441 INFO spawned: 'plexmediaserver' with pid 60 2020-04-19 15:23:51,731 DEBG fd 8 closed, stopped monitoring <POutputDispatcher at 139734335288080 for <Subprocess at 139734334410224 with name plexmediaserver in state STARTING> (stdout)> 2020-04-19 15:23:51,731 DEBG fd 10 closed, stopped monitoring <POutputDispatcher at 139734333605152 for <Subprocess at 139734334410224 with name plexmediaserver in state STARTING> (stderr)> 2020-04-19 15:23:51,731 INFO exited: plexmediaserver (exit status 255; not expected) 2020-04-19 15:23:51,732 DEBG received SIGCHLD indicating a child quit 2020-04-19 15:23:53,736 INFO spawned: 'plexmediaserver' with pid 65 2020-04-19 15:23:54,021 DEBG fd 8 closed, stopped monitoring <POutputDispatcher at 139734334119840 for <Subprocess at 139734334410224 with name plexmediaserver in state STARTING> (stdout)> 2020-04-19 15:23:54,021 DEBG fd 10 closed, stopped monitoring <POutputDispatcher at 139734334410368 for <Subprocess at 139734334410224 with name plexmediaserver in state STARTING> (stderr)> 2020-04-19 15:23:54,021 INFO exited: plexmediaserver (exit status 255; not expected) 2020-04-19 15:23:54,021 DEBG received SIGCHLD indicating a child quit 2020-04-19 15:23:54,021 DEBG fd 8 closed, stopped monitoring <POutputDispatcher at 139734334119840 for <Subprocess at 139734334410224 with name plexmediaserver in state STARTING> (stdout)> 2020-04-19 15:23:54,021 DEBG fd 10 closed, stopped monitoring <POutputDispatcher at 139734334410368 for <Subprocess at 139734334410224 with name plexmediaserver in state STARTING> (stderr)> 2020-04-19 15:23:54,021 INFO exited: plexmediaserver (exit status 255; not expected) 2020-04-19 15:23:54,021 DEBG received SIGCHLD indicating a child quit 2020-04-19 15:23:57,027 INFO spawned: 'plexmediaserver' with pid 70 2020-04-19 15:23:57,323 DEBG fd 8 closed, stopped monitoring <POutputDispatcher at 139734335288080 for <Subprocess at 139734334410224 with name plexmediaserver in state STARTING> (stdout)> 2020-04-19 15:23:57,323 DEBG fd 10 closed, stopped monitoring <POutputDispatcher at 139734333605056 for <Subprocess at 139734334410224 with name plexmediaserver in state STARTING> (stderr)> 2020-04-19 15:23:57,324 INFO exited: plexmediaserver (exit status 255; not expected) 2020-04-19 15:23:57,324 DEBG received SIGCHLD indicating a child quit 2020-04-19 15:23:58,325 INFO gave up: plexmediaserver entered FATAL state, too many start retries too quickly 2020-04-19 15:23:58,325 INFO gave up: plexmediaserver entered FATAL state, too many start retries too quickly
-
Hi I am currently running: Unraid: 6.8.3, Sonarr: Version 2.0.0.5344, Mono Version 5.20.1.34 Ombi: 3.0.4892 I have searched for this issue, but can't seem to find a directly related issue or resolution. I have series that are not marked available. For this example - Friends (1994). Upon pressing the Request radio button, then selecting the Select option, I see that the final episodes from S09 and S10 are marked as missing. I then opened SONARR, and both episodes are there (and watchable), however after a little bit more digging, it appears that the final episodes of both these sesons are range marked episode e.g. S10E17E18. My questions is: Is there a simple way to get Ombi to recognise these episodes, and thus marking the entire series as available? Many Thanks Duggie
-
Generating some 4096 RSA certs - should more than one thread be getting allocated? Cheers Duggie
-
Hi, Installed this plugin on 6.6.7, and after changing the settings to what I require, am unable to get a client to connect - I will continue fault finding, but in the meantime, if you set LZO compression to No in the Server Config page, whenever you create files, line 17 is simply a 0. should it be "comp-LZO No" or "comp-LZO 0"?
-
Query - installed SABNZBVPN, have it all up and woirking except.... files are downloading to /config/downloads instad of /data/downloads. When I look in SABNZB settings the default user folder has a "Default Base Folder: /config" which I am not able to change (within SABNZBVPN). This is the same as the system folders. Should the default base folder for User not be /data ? Cheers Duggie OK cancel this, just had to go back to root then select data instead of config, then my downloads/complete and incomplete folder! Still think the default folder for User should be Data though, would provide consistency with other containers? Cheers Duggie
-
Thanks, that has got me past that hurdle, although for some reason it sill wants the protocol name on a separate line OK, so after a little more work, I was able to get it up and running. 1. Had to add username and password within the docker settings itself. From the ovpn config file; 2. Remove the "proto udp" line 3. Add " 443 udp" to end of remote line. 4. Change "ns-cert-type server" to "--remote-cert-tls server" [removes warning of deprecated command from log file] Seems to be good at the moment, so thanks again!
-
Binhex, Hello, and thank you for your enormous amount of very fine work! I am running UnRAID 6.3.5, with DelugeVPN docker (yours, obviously - have an issue I have mentioned in that support thread) and PlexPass docker. When I click on the Photos library I get the following error; There was an error loading the timeline for this library The photos timeline requires Plex Media Server 1.5.4 or higher Media Server installed version is: Version 1.11.0.4633 - and when I click for update version it tells me it is up to date. I suspect that I am missing somethin obvious, can you assist? Regards Duggie Just got the update - Many Thanks BinHex!
-
Hi, Relative n00b here, just setting up Deluge VPN, have installed the docker, and added my VPN providers .opvn file to \\........\appdata\binhex-delugevpn\openvpn it contains the folowing lines: client dev tun reneg-sec 0 persist-tun persist-key ping 5 ping-exit 30 nobind comp-lzo adaptive remote-random ns-cert-type server route-metric 1 CERT HERE CERT HERE PK HERE remote REMOTE VPN SERVER DN proto udp (items in bold altered for privacy) When I attempt to start DVPN, the log states " VPN_PORT not found in /config/openvpn/OPVNFILENAME.ovpn I have tried adding "port 443" after the remote line, but this seems to have no effect. Am I missing something really obvious, before I start deep diving into the issue? Thanks, Duggie


