





sjerisman
Members
-
Joined
-
Last visited
-
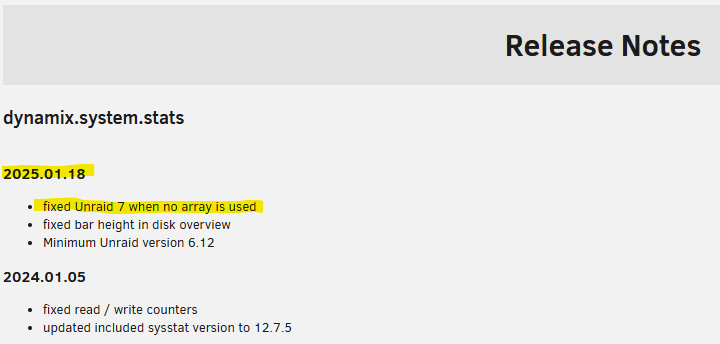
@NoRaid99 - My PR was merged and a new version of System Stats was released. Working fine on my systems. Hopefully it fixes the plugin on your systems as well.
-
@Rysz (or whoever maintains this currently) I've traced the issue down to a divide-by-zero error that causes the page to stop rendering. I've opened a Pull Request that fixes the issue by bypassing the array calculation logic (and display logic) if there isn't an array found. https://github.com/bergware/dynamix/pull/97 This seems to fix the issue on my test system (although it looks like there might be a unrelated style issue on the Disk Stats page still). EDIT: I've since been able to fix the display issue as well (it was actually a pre-existing issue affecting anyone with a small number of disks). Can someone please review the PR and release an update for this plugin?
-
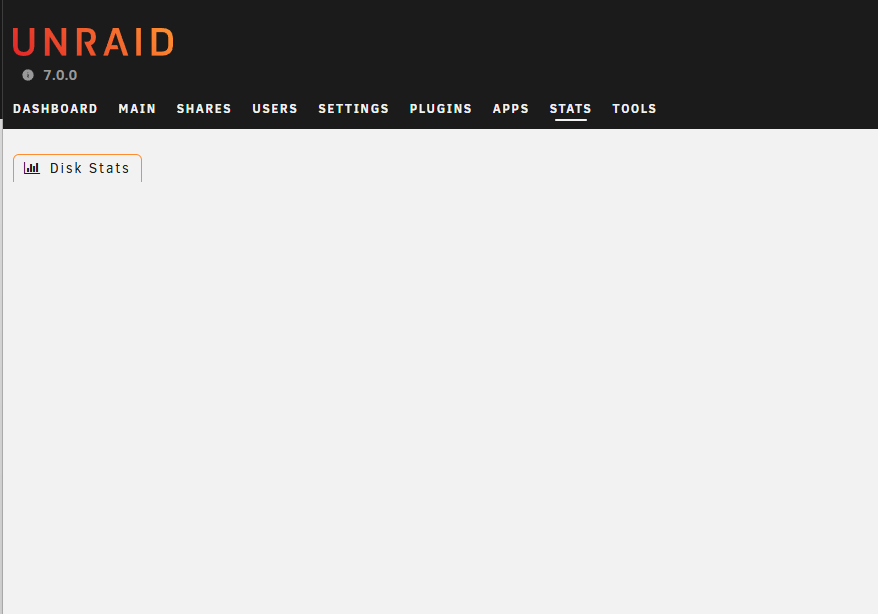
The System Statistics plugin is not working with the newly released UnRaid 7.0.0 when only Pool drives are used (i.e. no Array). Navigating to the Stats tab just renders a blank page: I was seeing the same behavior on the beta and rc builds. Priority is a bit higher now that the official stable build has been released.
-
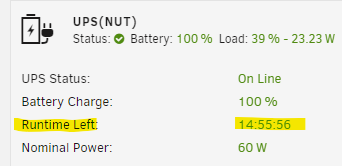
Hi there. I have a custom battery backup with a huge battery that provides multi-day uptime. I noticed that this plugin seems to truncate anything over a day of runtime and just reports the remaining time as 'HH:MM:SS', which is a bit misleading. Would it be possible to change the display format to report as 'DD HH:MM:SS' (or maybe just 'DD.X days') if the runtime is more than a day?

-
Ok makes sense. beta2 did come out yesterday and has the exact same style issues. But again, no rush, just wanted to make sure you knew.
-
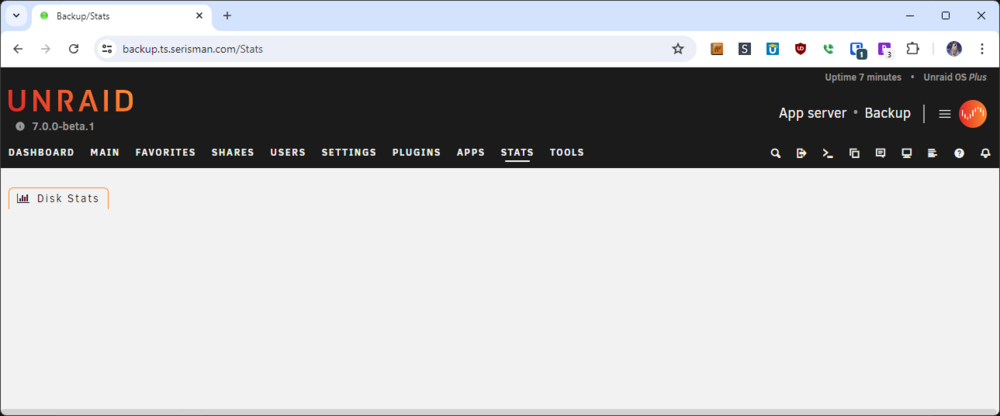
System Statistics seems to be broken with the v7.0.0 beta. I just get an empty page when I navigate to the 'Stats' tab. This is on a system with only a ZFS Pool where the UnRaid Array has been removed. Possibly the plugin currently needs an UnRaid Array to operate?
-
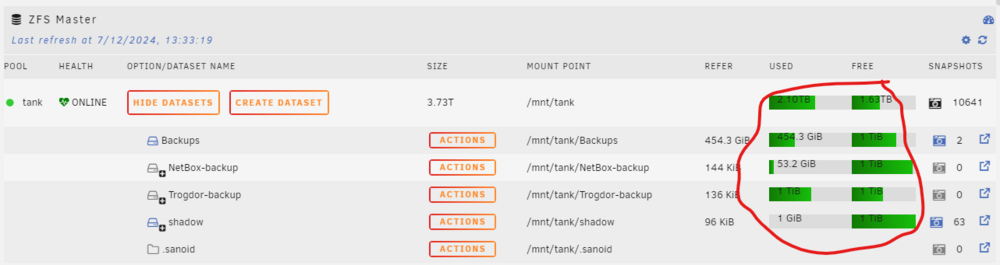
@Iker - Not sure if you've tried out the v7.0.0 beta yet? One (extremely minor) issue I noticed with this plugin is the usage information is offset vertically now. Probably some style(s) changed with v7.
-
My PRs got merged, so it looks like these bug fixes / enhancements will be part of the next release (whenever that is).
-
Ok, I've submitted a PR for this 'enhancement' as well: https://github.com/unraid/webgui/pull/1551
-
I've submitted a PR to fix this issue: https://github.com/unraid/webgui/pull/1550 I'll try and work on another one for my original enhancement suggestion.
-
@Iker - Thanks for the great plugin! I'd like to propose two possible enhancements for a future version: Have a refresh icon per pool. Right now there is only a global refresh icon. This will cause disks in the array to spin up if any of them are formatted as zfs even if I'm only interested in getting updates for a 'cache' pool at the moment. A 'refresh' icon per pool would allow targeted refreshing. I could refresh just a 'cache' or UD' pool and let the array drives stay spun down. Another possible option is to ignore refreshing pools where the datasets are currently hidden. Would it be possible to add the 'written' property to the Snapshot Admin table view. It can be queried with `zfs list -o written` similar to how you are getting the other properties. I usually find 'written' is more meaningful to me than 'used' when looking at historical snapshots. My understanding is that 'written' refers to how much space was written to a filesystem or snapshot relative to the previous snapshot, whereas 'used' refers to the amount of unique data that applies to only that snapshot (not reused by any other further snapshots) and the amount that would be freed if it was deleted. Both are useful, but I think 'written' is actually more relevant usually (at least to me).
-
@SimonF - Thanks for the great plugin! I was able to fairly easily get it to do most of what I want. I did have to go research elsewhere how to setup the keyfiles for remote ssh access, but that was fairly easy to figure out and get working as well. I'm stuck on retention for the remote server though. I understand that this is still not implemented on the source server side, but is there something I'm missing to be able to apply retention directly on the remote server? What are other people doing to cleanup old snapshots that have been sent from another server? In my case, I have a BTRFS pool with some subvols on a 'source' UnRaid server that I want to keep ~3 days worth of hourly snapshots on, and then send them to a BTRFS pool on a 'remote' UnRaid server. The remote server should then keep 14 days of the hourly snapshots, but then also take daily and weekly snapshots, each with their own retention periods. So, I have one schedule on the source server to create the hourly snaps, tag them with 'Hourly' and send them to the remote server. Then, I have two schedules on the remote server to create the daily and weekly snaps, tagged as 'Daily' and 'Weekly'. I think the retention of the hourly snaps on the source server is working ok, and I think retention of the daily and weekly snaps on the remote server is working ok as well, but what should I do about the hourly snaps on the remote server? I tried creating an hourly schedule on the remote server, basically just to handle the retention cleanup, but it doesn't seem like it considers the received incremental snaps when it applies retention. Is this just a bug, or does it purposely exclude snaps that were received from a different server? So, again... what are other people doing for retention on 'remote' servers? Maybe custom scripts, or am I just missing something obvious? And, just because it is fresh in mind... here are a few general useability observations: It would be nice to be able to sort the list of snaps from newest to oldest instead of the current default of oldest to newest. It would be nice to see the schedule's tag on the list view, maybe instead of the slot #. Or, maybe allow a short description that could be shown there. I keep accidentally clicking on the schedule's + icon thinking I'm editing the schedule row. I'm not sure why that moves down from the subvol row to the schedule row once there are schedules? Maybe leave the + on the subvol row, and then move the clock icon over to where the + currently is on the schedule row? Maybe change the clock icon to a 'edit' icon as well?
-
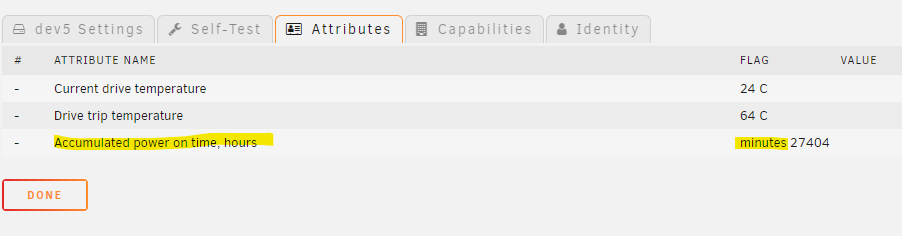
I also noticed that SAS SSDs or HDDs that show 'Accumulated power on time, hours' incorrectly show 'minutes xxxxxx' instead of 'hours xxxxxx' or just 'xxxxxx'. Example: Raw data: > smartctrl -a /dev/xxx ... === START OF READ SMART DATA SECTION === SMART Health Status: OK Percentage used endurance indicator: 22% Current Drive Temperature: 31 C Drive Trip Temperature: 64 C Accumulated power on time, hours:minutes 27404:25 ... 27404 is the number of hours, not minutes. Not sure if it is scrapping the value wrong, or just displaying it weirdly.
-
Hello, I have a bunch of SAS SSDs that currently only display drive temperature information in the SMART Attributes tab. The SSDs in question are: Toshiba PX04SVB096 and PX04SRB096, but I assume this applies to other SAS SSDs as well. It would be really nice if we could also see the 'Percentage used endurance indicator'. This value is available as `Percentage used endurance indicator: xx%` through either of these commands: smartctl -a /dev/xxx smartctl -l ssd /dev/xxx Or, as `"scsi_percentage_used_endurance_indicator"= xx` though the JSON command: smartctl -a -j /dev/xxx Examples: > smartctl -a /dev/xxx ... === START OF READ SMART DATA SECTION === SMART Health Status: OK Percentage used endurance indicator: 10% ... > smartctl -l ssd /dev/xxx ... === START OF READ SMART DATA SECTION === Percentage used endurance indicator: 10% > smartctl -a -j /dev/xxx ... "smart_status": { "passed": true }, "scsi_percentage_used_endurance_indicator": 10, "temperature": { "current": 25, "drive_trip": 64 }, ...
-
Just a thought... What if any old backup files were converted to the new format after a plugin upgrade or after opting into the new naming convention? (i.e. use the filenames read and then remove the timestamps and move the files to new subfolders)





