






falconexe
Community Developer
-
Joined
Everything posted by falconexe
-
I hear you. Unfortunately, there is no possible way to to carry forward anyone's modifications from a personal branch into a new release automatically. That being said, no one has to upgrade unless they want to, but my goal is to provide must have features in each release so that people will want to. This whole UUD concept takes work from both sides. It always has, and always will. It is just too dynamic of a situation. I look at the UUD as more of a foundation and insanely good template to start from. I'm trying to make it as out of the box as possible, but due to the nature of this being based around user customization and infinite hardware combinations, it requires that special touch from each user to make it their own. My hope is that as people start messing with it, these concepts and skills will be built over time, and everyone who uses the UUD will gain knowledge. Then the end users can start sharing code and stuff they have built with the UUD community. If you run on server hardware and can use IPMI, the UUD should just work out of the box with minimal effort like setting the upper variables. If you run on desktop/consumer hardware, you'll have to ditch IPMI, and use Sensors instead. That is where it takes some effort, but I have helped a few folks out there get up and running with Sensors, and it works great once you know how to bend it to your will. I'm glad you think it looks great and I wanted to personally say thanks for your appreciation of my work. It means a lot!
-
On each update (if you choose to use it) you will need to set the variables, datasources, and modify the queries again. If you want, you can just copy the JSON for a particular 1.3 panel you have modified (got working for your hardware) and just import it into the 1.4 dashboard. Alternatively, if there is something you must have from 1.4, you can do the opposite and import it into your working (stable) version of 1.3. All kinds of options... FYI, many people have contacted me me and said that they love 1.4 and that it is working perfectly for them. So if 1.3 works for you, there should be know reason 1.4 won't work for you too. You'll just need to put some time into it. Let me know if I can help.
-
Hey everyone, I added a UUD News section to post # 1. In case you didn't see, the UUD was featured in the official UNRAID monthly newsletter. I am super humbled to be included in that, and I wanted to thank the UUD community for making this what it is! 2020-09-28: The UUD is Featured in the Official UNRAID Monthly Newsletter (September 2020)! http://eepurl.com/hekG2f
-
And easy on your CPU ha ha it might burn up. Never seen an UNRAID server so pegged. Folding at Home is a beast. Glad to know the RED CPU Core thresholds are working correctly LOL.
-
And yeah, time for some more drives LOL!
-
So for some reason, his sensors plugin would not work, even though it was installed correctly and we ran though the sensors-detect process. It didn't even work on UNRAID natively, so there may be something else going on with that server. If anyone else had run into this issue, and has a solution, let us know. Once you get the sensors issue resolved, your Telegraf should start reporting that module within Grafana and you can update your queries accordingly. @MrLondon has similar hardware and his sensors plugin worked perfectly.
-
Install TeamViewer and DM me your code and passcode. I’ll dial in and personally get this working for you. I’m just messing with computer stuff today anyway.
-
Well it’s most likely not Grafana because if it was a single internal setting, they should all log out around the same timeout. Very odd. I have my Grafana dashboards up 24/7 and the only time I ever have to log in again, is if I clear browser history (cookies). 🤷🏻♂️ Try another computer.
-
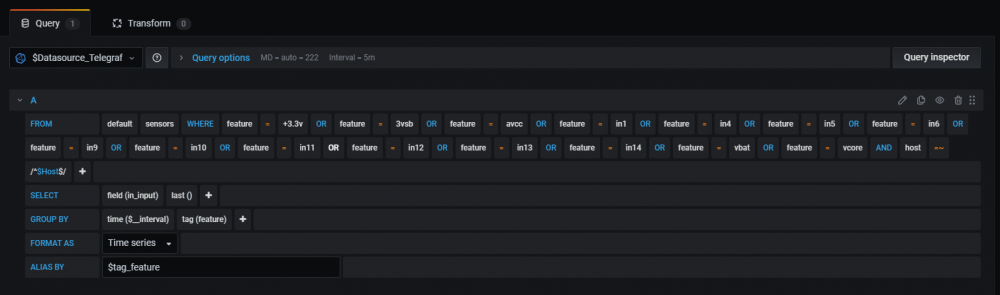
For anyone using Sensors instead of IPMI for System Power, here is a query I just made on MrLondon's computer. It works great...

-
Glad you like 1.4! Yeah if you don't run Cache, then you would use /mnt/user. That is why I updated all applicable panel descriptions to point that out. Glad that you saw that and that it made sense. It should be possible to pull voltages from sensors on non server hardware. I would look around for a "feature" that looks like power readings. You'll have to play around with the query, just like we did on that virtual meeting we held. The 1.4 query uses IPMI and REGEX to pull anything with a unit of "Volts". That won't be possible with sensors, but there should be an equivalent catch-all, and/or you will have to add multiple queries to grab each voltage/component you want to monitor. Send me a quick TeamViewer invite (DM) and I can hop on real quick and see if we can figure it out. If we do, I'll screenshot the code and post it here.
-
On another note, I just released the Ultimate UNRAID Dashboard Version 1.4! @testdasi, feel free to include it with GUS in your next update. Check it out Here:
-
No worries! Good Luck. Let us know what you find out. It may help someone else in the future.
-
@SpencerJ The Updated Version 1.4 Screenshots are Live on Page #1, Post #1.
-
@SpencerJ Feel Free to Update the Official UNRAID Press Releases. You can include my Reddit Handle now which is "TheRealJalexis".

-
Sorry for the wait. There was WAY MORE documentation than I thought. There were A LOT of changes ha ha. I'm already working hard on Version 1.5 which will introduce a unified Plex/Varken Dashboard into the UUD. Stay tuned!
-
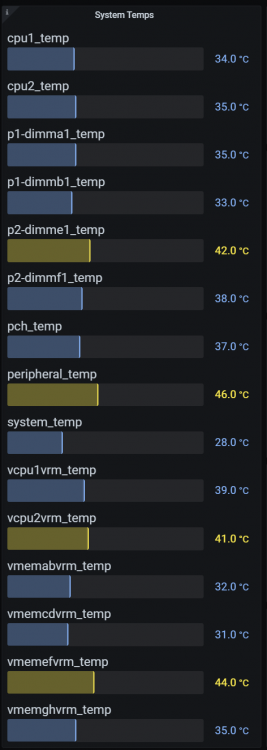
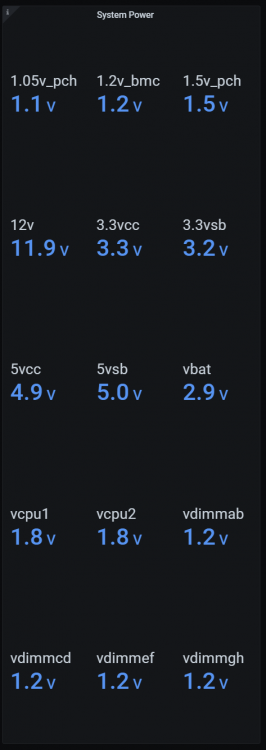
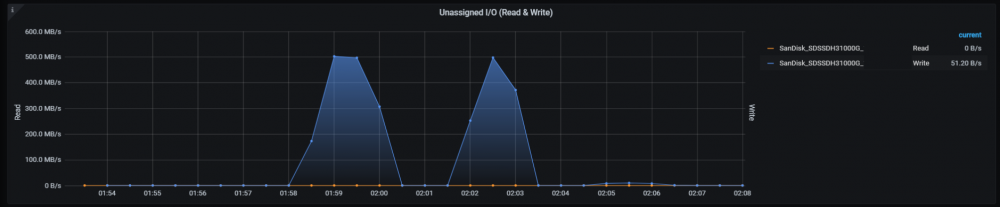
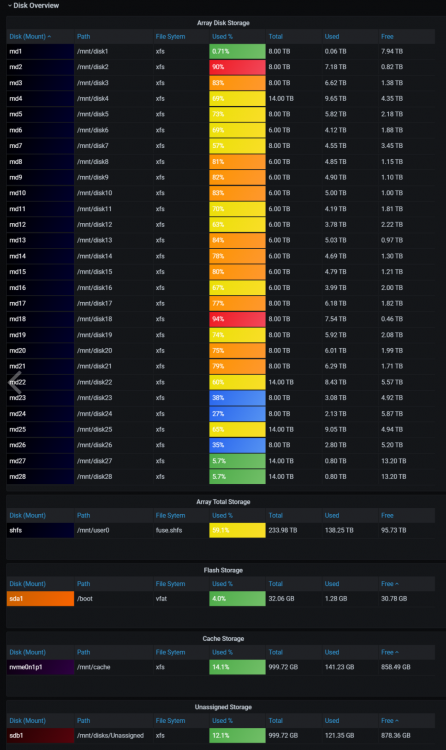
The Ultimate UNRAID Dashboard Version 1.4 is here! This is a MASSIVE 😁 update adding many new powerful features, panels, and hundreds of improvements. The main goal of this release is to increase usability and simplify the dashboard so more people can modify it without getting lost in REGEX and having to ask for support as often. As a result, the most complex queries have been rewritten in a way that is clear and transparent, while still remaining just as powerful. Finally, I have added requested features and threw in some new bells and whistles that I thought you guys would like. As always, I'm here if you need me. ENJOY! Highlights: Keep it Simple - Added User Transparency Back Into Dashboard by Removing REGEX on Certain Panels This Will Make it Extremely Easy to Customize the Dashboard to Your Specific Needs/Requirements You Can Now See Exactly How Certain Panels are Derived and Making Modifications is Self Explanatory This Will Also Make Support MUCH Easier For Everyone! Multi-Host Support Change the Host Drop Down Variable and Monitor Another Host Instantly Added the Host Variable to Every Single Panel The Entire Dashboard Can Now Monitor Any Host in Real Time With a Single Variable Change Via Drop Down Menu! Initial Support For Non Server Hardware Initial Support For Sensors Plugin to Monitor Non Server Hardware (Only Used If IPMI Is NOT Supported on Your Hardware) Requires New "sensors" Plugin (See Dependencies Section on Post #1) Added Template Sensor Queries (Disabled By Default) You Will Need to Modify These Example Queries As Required For Your Non Server Hardware These are Just Building Blocks to Help Those Who Cannot Use IPMI Please See the Forum Topic For Detailed Help! Initial Support For Unassigned Drives Added Ability For Unassigned Drives Via 2 Variables (Serial and Path) Added Unassigned Drives to Panels Throughout Dashboard Where Applicable Default Dashboard Comes With Only 1 Unassigned Path Variable You Will Need to Add Additional Path Variables to Include/Exclude Multiple Unassigned Drive Paths Support For Multiple Cache Drives in DiskIO Graphs Support For Multiple Unassigned Drives in DiskIO Graphs Monitoring of ALL System Temps Monitoring of ALL System Voltages Monitoring of ALL System Fans Monitoring of RAM DIMM Temps Further GUI Refinements to Assist with Smaller Resolution Monitors Variable Changes Removed Redundant And/Or Unneeded Variables Cleans Up and Reduces Clutter Of Upper Variable Menu Re-Ordered Variables Smaller Length Variables Are Now First (Typically Row 1) Longer Length Variables Are Now Last (Typically Row 2) Standardized Dashboard to Use Single Datasource Instead of 3 Before: Telegraf/Disk/UPS After: Telegraf This Also Keeps the Variables Menu Cleaner With Less Clutter (2 Less Variables!) Standardized All Variables Names in Title Case, Logical Prefixes, and Added Underscores to Separate Words Shortened Variable Label Text When/Where Possible Changed All Panels to Use Default Min Interval Setting of Datasource Set Once in on Datasource and All Panels Not Explicitly Set Will Auto Adjust Only Those Panels Different From the Default Min Interval Are Now Explicitly Set (Example: Array Growth) Modified and Added New Auto-Refresh Time Interval Options In Drop Down Menu Now: 30s,1m,5m,10m,15m,30m,1h,2h,6h,12h,1d Replaced All "Retro LCD" Bar Gauges With "Basic" (Cleaner GUI With Unified Aesthetic) Adjusted All Panel Thresholds to Be More Accurate on Color Changes (See Bug Fixes) Added GROUP BY "time($_interval)" To All Panels Increases Overall Dashboard Performance Removed Min/Max/Avg Values From All Line Graphs to Decrease Screen Width Requirements Shows More Data on Smaller Screens Corrected Various Grammatical Errors Bug Fixes and Optimizations Hundreds of Other Quality of Life and Under the Hood Improvements You Can't See Them, But They're There...In Code...LOTS OF CODE Bug Fixes: Changed Remaining Panels Using FROM "autogen" to "default" Updated All Aliases to Match Panel Names There Were Still Some Discrepancies Adjusted All Threshold Values to Be 1/10th Below Desired Measurement Forces Color Change on Next Whole Number Example: 90% Is Supposed to Be Red, But Would Still Show Preceding Orange Threshold Color (89.9% Resolves This) New Panels: Overwatch System Temps Monitors ALL System Temps (Including CPU) Uses IPMI Unit "degrees_c" to Pull Values Instead of Individual Names Added/Modified Panel Description System Power Monitors ALL System Voltages Uses IPMI Unit "volts" to Pull Values Instead of Individual Names Added/Modified Panel Description Fan Speeds (Replaces Fan Speed Gauges): Monitors ALL System Fans Uses IPMI Unit "rpm" to Pull Values Instead of Induvial Names Also Fixes Issue Where Labels Were Not Being Dynamically Generated Added/Modified Panel Description RAM Load: Show Current Ram Usage % Replaces RAM Used % Disk I/O Unassigned I/O (Read & Write) Adds Support to Monitor Disk I/O of Unassigned Drives Does Not Show Min/Max/Avg Values On Line Graph to Decrease Screen Width Requirements Shows More Data on Smaller Screens Added Ability to Show Multiple Unassigned Drives by Serial Number Disk Overview Unassigned Storage Adds Support to Monitor Storage of Unassigned Drives Detailed Server Performance RAM DIMM Temps Adds Support to Monitor RAM DIMM Temps Uses IPMI & REGEX Panel Changes: Overwatch ALL Subpanels Overhauled Look and Feel Array Total Added Sparkline Graph Array Utilized Added Sparkline Graph Array Available Added Sparkline Graph Array Utilized % Added Sparkline Graph Cache Utilized Added Sparkline Graph Cache Utilized % Added Sparkline Graph CPU Load Added Sparkline Graph RAM Load Added Sparkline Graph 1GbE Network Renamed Panel Changed to Orientation to Vertical Added Sparkline Graph 10GbE Network Renamed Panel Changed to Orientation to Vertical Added Sparkline Graph Array Growth (Year) Renamed Panel Previously Named "Array Growth (Annual)" DISK I/O Cache I/O (Read & Write) Removed Min/Max/Avg Values From Line Graph to Decrease Screen Width Requirements Shows More Data on Smaller Screens Added Ability to Show Multiple Cache Drives by Serial Number Array I/O (Read) Removed Min/Max/Avg Values From Line Graph to Decrease Screen Width Requirements Shows More Data on Smaller Screens Array I/O (Write) Removed Min/Max/Avg Values From Line Graph to Decrease Screen Width Requirements Shows More Data on Smaller Screens Disk Overview Array Disk Storage Added Used % Field Now Used to Indicate Drive Free Space By Color Modified Thresholds to Be More Accurate Total Array Storage Renamed Panel Previously Named "Array Storage" Added Used % Field Now Used to Indicate Drive Free Space By Color Modified Thresholds to Be More Accurate Drive Temperatures Renamed Panel Formerly "Drive Temperatures (Celsius)" Added Support For Unassigned Drives Detailed Server Performance Network Interfaces (RX) Removed Min/Max/Avg Values From Line Graph to Decrease Screen Width Requirements Shows More Data on Smaller Screens Network Interfaces (TX) Removed Min/Max/Avg Values From Line Graph to Decrease Screen Width Requirements Shows More Data on Smaller Screens Network 1GBe Renamed Panel Formerly "Network 1GBe (eth0)" Removed Min/Max/Avg Values From Line Graph to Decrease Screen Width Requirements Shows More Data on Smaller Screens Network 10GBe Renamed Panel Formerly "Network 10GBe (eth2)" Removed Min/Max/Avg Values From Line Graph to Decrease Screen Width Requirements Shows More Data on Smaller Screens RAM Removed Min/Max/Avg Values From Line Graph to Decrease Screen Width Requirements Shows More Data on Smaller Screens CPU Package Removed Min/Max/Avg Values From Line Graph to Decrease Screen Width Requirements Shows More Data on Smaller Screens CPU 01 Load Renamed Panel Formerly "CPU 01" Removed Min/Max/Avg Values From Line Graph to Decrease Screen Width Requirements Shows More Data on Smaller Screens Removed REGEX and Manually Set Cores Individually Increases Supportability Makes it Easier For Novice Users by Increasing Query Transparency Ensures Tags Stay Ordered Numerically (1,10,11...2,20,21... Is Now 1,2,...10...20...) Renamed Each Core With +1 Array Order Naming (Core 00 Now = Core 01...) CPU 02 Load Renamed Panel Formerly "CPU 02" Removed Min/Max/Avg Values From Line Graph to Decrease Screen Width Requirements Shows More Data on Smaller Screens Removed REGEX and Manually Set Cores Individually Increases Supportability Makes it Easier For Novice Users by Increasing Query Transparency Ensures Tags Stay Ordered Numerically (1,10,11...2,20,21... Is Now 1,2,...10...20...) Renamed Each Core With +1 Array Order Naming (Core 00 Now = Core 01...) CPU 01 Core Load Changed Bar Gauge Type From "Retro LCD" to "Basic" Changed Bar Gauge Orientation to Vertical CPU 02 Core Load Changed Bar Gauge Type From "Retro LCD" to "Basic" Changed Bar Gauge Orientation to Vertical Fan Speeds Renamed Panel Formerly "IPMI Fan Speeds" Removed Min/Max/Avg Values From Line Graph to Decrease Screen Width Requirements Shows More Data on Smaller Screens Updated Panel Descriptions: Overwatch System Temps Note: Uses IPMI System Power Note: Uses IPMI Fan Speeds Note: Uses IPMI Array Total: Note: Change Path to "mnt/user" if Cache Drive is Not Present Array Utilized Note: Change Path to "mnt/user" if Cache Drive is Not Present Array Available Note: Change Path to "mnt/user" if Cache Drive is Not Present Array Utilized % Note: Change Path to "mnt/user" if Cache Drive is Not Present Array Growth (Day) Note: Change Path to "mnt/user" if Cache Drive is Not Present Array Growth (Week) Note: Query Options > Min Interval - Must Match on Week/Month/Year To Stay In Sync Set to 2 Hours by Default For Performance Reasons) - Change Path to "mnt/user" if Cache Drive is Not Present\ Disk Overview Array Disk Storage Note: Uses Variable Array Total Storage Note: Change Path to "mnt/user" if Cache Drive is Not Present Unassigned Storage Note: Uses Variable Drive S.M.A.R.T. Health Summary Removed Description Drive Life Removed Description Detailed Server Performance CPU 01 Core Load Removed Description CPU 02 Core Load Removed Description RAM DIMM Temps Note: Uses IPMI & REGEX Removed/Converted/Deprecated Panels: Overwatch CPU 01 Temp CPU 02 Temp RAM Free % Fan Speed Gauges Variables: New Drives_Unassigned Used to Select Unassigned Drives(s) From Drop Down Menu Path_Unassigned Used to Set a Single Unassigned Drive Path For Inclusion/Exclusion in Drive Panels Add Additional Unassigned Path Variables to Include/Exclude Additional Unassigned Drive Paths Renamed Host Formerly "host" Datasource_Telegraf Formerly "telegrafdatasource" CPU_Threads Formerly "cputhreads" UPS_Max_Watts Formerly "upsmaxwatt" UPS_kWh_Price Formerly "upskwhprice" Currency Formerly "currency" Drives_Flash Formerly "flashdrive" Drives_Cache Formerly "cachedrives" Drives_Parity Formerly "paritydrives" Drives_Array Formerly "arraydrives" Deprecated diskdatasource upsdatasource See Post Number 1 For the New Version 1.4 JSON File!



-
Yeah it’s not worth the Tax paperwork🤦🏻♂️😂. Just hit that like button. 👍🏻
-
Ha ha. I really need to get something going for that. I have a Venmo and PayPal, but I just feel bad. I do this for fun... My reward is your LIKES and THANKS.
-
Ha ha. Eating dinner. It will be up in the next few hours.
-
Try a different browser on the same computer, and then try the same browser on a different computer. That is not normal behavior, nor should you have to explicitly set something to stop this behavior. Out of the box, Grafana does not auto log you off. Credentials are stored in browser cookies. If cookies are cleared, you will have to log in again. Might be a browser specific setting...
-
The time has nearly come. Just finishing up documentation.
-
You're welcome. Glad you are liking it. It is one of 2 things. 1. The query is off, and needs to be adjusted. Please post a screenshot of the actual query by editing the panel. 2. Some dockers run on virtual networks inside of UNRAID, so IF they show up, they still won't report the correct true bandwidth. I have tested both host and bridge mode and neither solve the issue, but they do route the traffic differently though the internal virtual networks. Even I (the developer) have this issue. If you look at the new network panel I added in version 1.3, and fire up Plex, you should see 1 or more networks reflect that traffic, it just won't say "Plex". That is why I am adding dedicated Plex monitoring to version 1.5. The network monitoring that I am releasing next is PERFECT...
-
You need to assign a new unique ID as well. It should be the next field below. You can just add a single character or assign an ID of your choosing.
-
Yeah, you can go ahead and get everything (InfluxDB, Telegraf, Grafana) installed and configured that is listed in the Dependencies section on Page/Post #1.
-
Thanks. Glad you’re liking it so much! We’ll be here when you take the plunge. I highly recommend waiting until next weekend when 1.4 drops. Well worth the short wait!





