

falconexe
-
Posts
789 -
Joined
-
Days Won
15
Content Type
Profiles
Forums
Downloads
Store
Gallery
Bug Reports
Documentation
Landing
Posts posted by falconexe
-
-
So I looked into InfluxDB 2.0 and it uses a new query language called "Flux". So far, I have not seen any advantages over the InfluxDB 1.X "InfluxQL", with regards to the UUD. If fact, it poses some limitations as seen below:
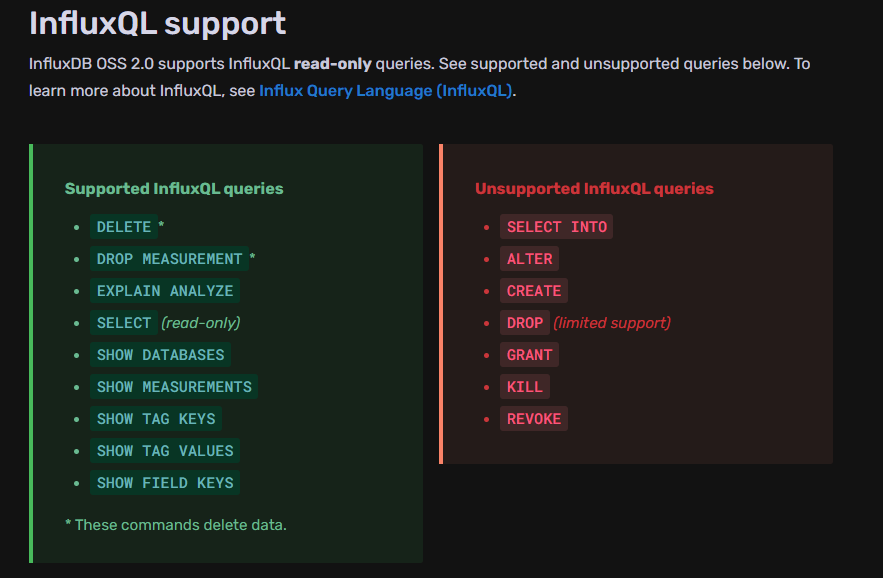
For a while, InfluxDB 2.0 did not even support InfluxQL, which the UUD is written in. Now it does, but only supports read only queries.
Sources:
- https://github.com/VictorRobellini/pfSense-Dashboard/issues/33#issuecomment-803437229
- https://github.com/grafana/grafana/issues/32183
- So, does any one know WHY I would re-develop UUD 1.7 into "Flux" for InfluxDB 2.0?
- What would be the benefit?
- What are the opportunities with InfluxDB 2.0 and the "Flux" query language (QL)?
- I have not deep dived into it yet, but for the needs and requirements of the UUD, I don't see this as a must have, YET. Unless of course "InfluxQL" becomes unsupported. In that case, I will have no choice.
Let me know your thoughts.-
 1
1
-
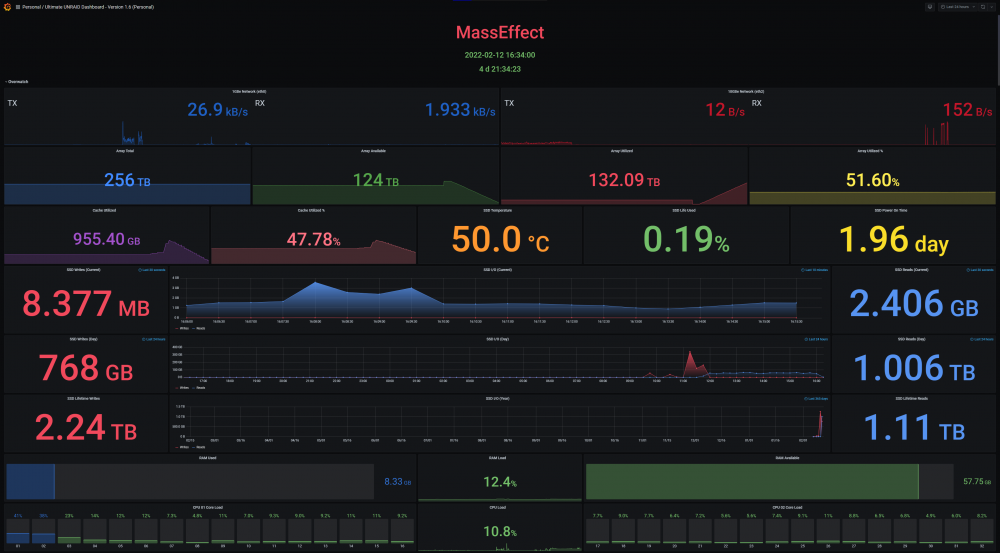
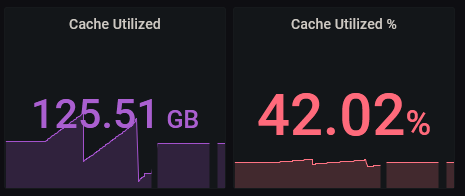
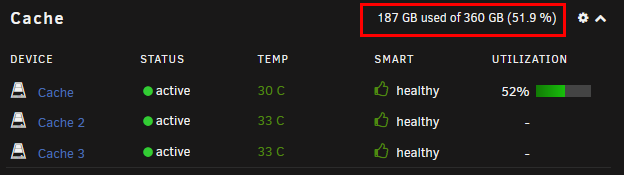
What the heck. I am kind of a Cache nerd, so I added a CURENT I/O graph to round it as well. I also added Write/Read stat panels to each of the 3 durations (Current, Day, & Year). Finally, I moved the Cache storage metrics to the Cache area, and then put a Lifetime Power On Time stat panel to round it out. I like it, and it suites my needs and focus on Cache health.
-
2
-
-
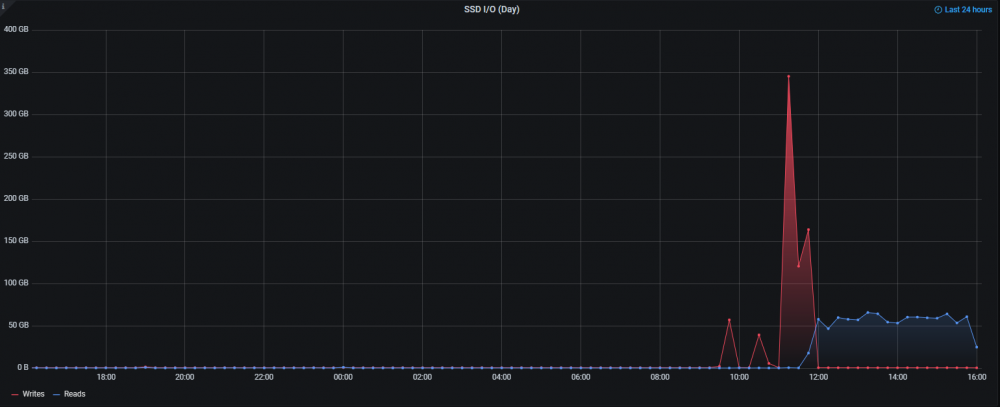
I added Read values to the Daily SSD Writes (Last 24 Hours). This is what it looks like when the MOVER offloads 2TB from Cache to the array. My new 2TB Samsung 970 Evo Plus is solid. Pretty Sweet graph.
-
1
-
-
DEVELOPER UPDATE:
Hey everyone. It's been a while since I actually messed with the UUD. I got remarried, and she's down with the UUD, so... we'll see if I get back into this. Today I am messing around with some new SSD Cache panels within a new style of header up top being more WIDE and CACHE focused. I just installed a new 2TB cache NVMe drive, so now was a great time to dive back in.
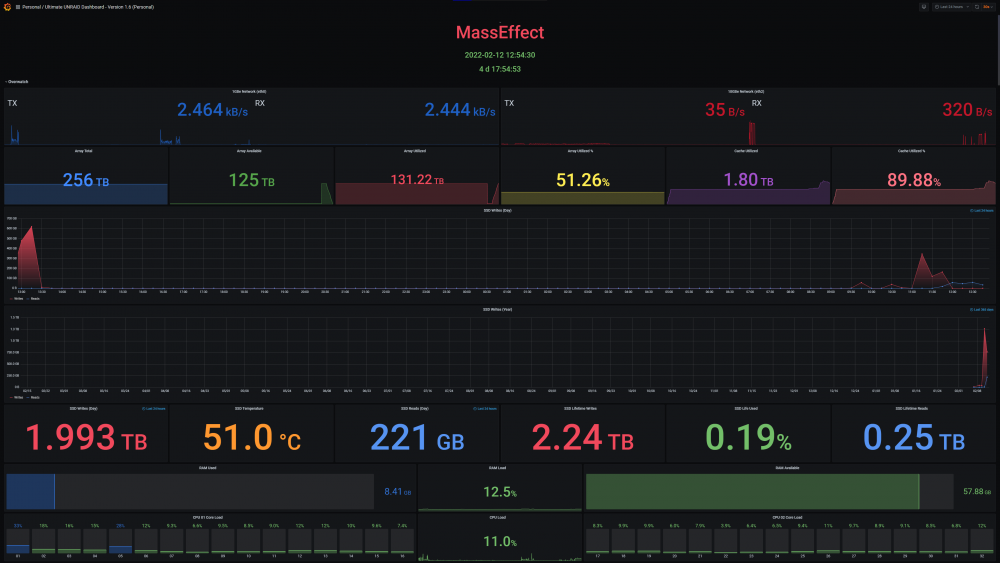
I'm aware of Influx DB 2.0 and a number of changes that have occurred since UUD 1.6 was released. Perhaps when I get some time, I will see if upgrading the UUD to support Influx DB 2.0 is even possible. I also still had a few more ideas up my sleeves for UUD 1.7, IF I decide to proceed with it.
UUD 1.7 Ideas:
- Nvidia GPU Panels
- Realtime Log Panels Using an UNRAID Log Server
- Actual Working Buttons to Control UNRAID via the UUD
Let me know your thoughts. In the meantime, I'll be getting back to dabbling in this stuff. Cheers!
-
2
-
 1
1
-
8 hours ago, [RIVINS] said:
Thank you it's almost working now.
The icon's are not showing, what i did found out its trying to get the icon from.
https://10.20.10.13/state/plugins/dynamix.docker.manager/images/idrac6-icon.png
My Base url is set to https://10.20.10.13
But without logging into unraid i can't get access to those icons. so i think Grafana is not able to get those icon's
is there another way to give them acces to those icon's ?
i am using Unraid Domain with valid ssl so the local ip is getting forwared can that be a problem ?
And the last thing i am not getting any VM Details.

Again thanks ALLOT and sorry for bad English. And late response.
Sincerely.
Vincent
Welcome! I answered this in the release notes. Try right clicking any broken picture and open that link in a new tab. UNRAID should then prompt you to log in. Once you are logged into this secondary tab, go back to the UUD and refresh the dashboard “F5” or use the browser controls. Then simply close that other tab you used to authenticate (you don’t need to keep it open). As long as you don’t clear your browser cookies, you should be good to go. Glad you are making progress and enjoying the UUD.Happy New Year everyone!!!
-
1
-
-
2 hours ago, boosting1bar said:
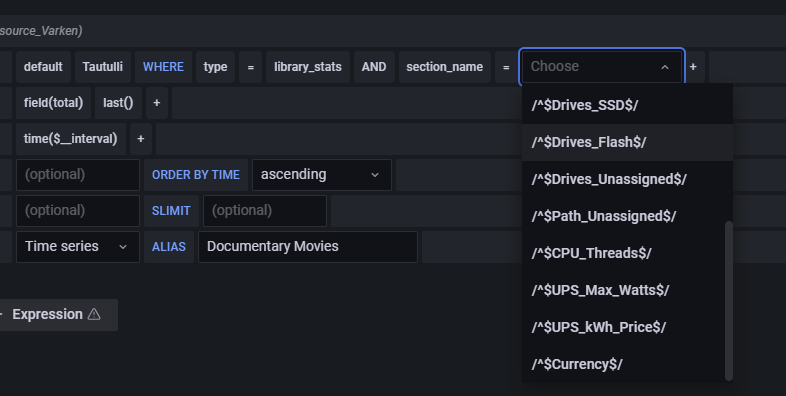
I'm stuck here but I think I know the answer. When you say library section, you mean you have numerous different folders in your library, correct? Sections like Documentary Movies, Horror Movies, etc. as opposed to one folder for Movies, one folder for TV Shows, etc. If that's the case that would obviously mean recreating the library into numerous folders for hundreds to thousands of movies for a lot of users. Is there a way to pull the Plex Genre tag from the files instead of library folders which would allow using the data that's already there? Love the UUD, really amazing work on such an awesome project!
You need to change the sections in the UUD to your sections in your Plex. Nothing needs to change in Plex for anyone. I just provided samples of different options from my own personal library. So if movies are just in 1 folder, you can easily do that. It’s completely customizable.I do not believe you can do it by Plex Genre. You are limited to what Varken can see in Tautulli.
-
On 7/6/2021 at 3:21 AM, JorgeB said:
My point was that this has been a known issue for many years now, that affects some users particularly bad, here's just one example
Thanks for pointing out my thread. This is THE ONLY thing that I am disappointed in with UNRAID since 2014. This still plagues me today, unless I use the crazy work around that I discussed in that thread. Without it, I never break 400MB/s, which is particularly sad when you have all the necessary hardware in place to hit 10Gb/s.
-
The Ultimate UNRAID Dashboard that I developed has all of this S.M.A.R.T disk info, but uses Telegraf. It’s nice to have both options. The UUD displays this in a “pretty” format. Let me know if you need a link to it. ich777 can also point you to it as he is aware of my work.
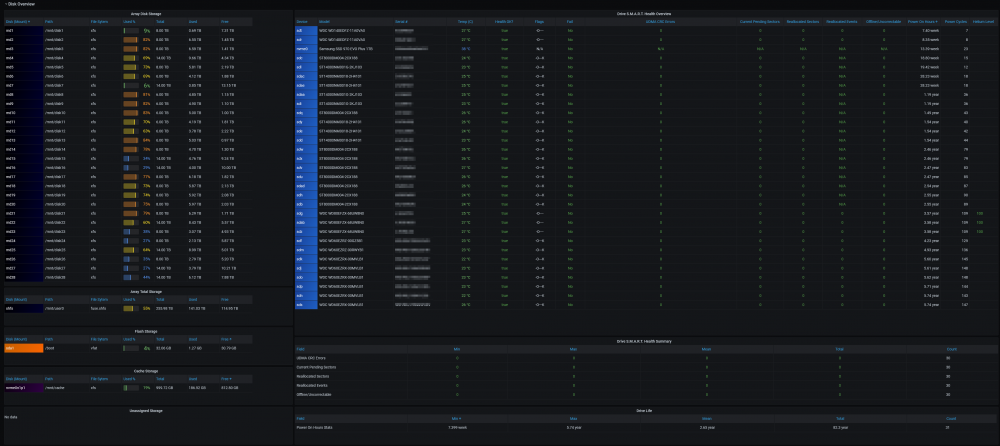
Edit: Here is the link:-
1
-
1
-
-
-
9 hours ago, stFfn said:
did anyone figure out how to fix this?. i´ve seen a few more have this problem.
This has been covered many times in the forum posts after the release of UUD 1.6. Please check that out and let us know if you are still stuck. -
Great work man! Thanks for DMing me about your projects. I know what I’m adding to the Ultimate UNRAID Dashboard (UUD) Version 1.7! 😂
@SpencerJ You see this yet? This might just be juicy enough to pull me out of retirement/hiatus and get the UUD 1.7 out. I’ll look into this in August. I’m getting married this month!
-
4
-
-
39 minutes ago, FreeMan said:
I've just noticed an interesting inconsistency.
As reported by the WebGUI:

As reported by UUD:
I know that the UUD is only refreshing every 30 seconds, but trust me, my system is NOT capable of writing 62GB to the cache drives in 30 seconds.
Forgive this second image. I've tried deleting it twice, but it persists...

Check Your timeframe in the upper right. Set it to the last hour and see if it changes. When is your mover running?
Note: If you are using cache pools, then you’ll need to explicitly modify the query to account for all cache drives in the pool that makes up that instance of “Cache”.
Also, to remove the second image on your post, you need to delete the second (or all) of the attachments in the post of that image. If not, it will stick the dupe on the end… Once they are all deleted, save your post. They should now be gone. Edit it again, upload the single photo, stick it where you want it, then save.
-
1 hour ago, devineavenger said:
Hello... Firstly, thanks for the dashboard. Secondly, the costs for the ups, daily, monthly, yearly... They're not displaying what they should, how do I know? basic math :)) I use 24 kWh a day at a price of .55 (local currency), it should display around 13 ish, it shows as 29... same for the others.. cost this year is 3210 instead of 2400 ish... soo... I think it needs some more tinkering
")
These are averages over specific timeframes. -
3 hours ago, noties said:
So I finally figured this out. I had the InfluxDB container on my UnRAID bridge network and the Varken container on my custom docker network (br1). For whatever reason, Varken (or InfluxDB) would not successfully write the library_stats tag key to the DB. The moment I moved my InfluxDB to my docker network, library_stats started writing. Unfortunately, this forced me to move everything in my Grafana stack to my docker network -- including telegraf. Everything appears to be working except for VM/docker icons which I think I can do without and may remove those panels. I think this pertains to the docker network not being able to communicate with the UnRAID IP.
I did need to make one change to my telegraf.conf that pertained to the APCUPSD. I changed the servers statement to point to my UnRAID IP instead of 127.0.0.1.
# # Monitor APC UPSes connected to apcupsd
[[inputs.apcupsd]]
#   # A list of running apcupsd server to connect to.
#   # If not provided will default to tcp://127.0.0.1:3551
servers = ["tcp://10.1.1.99:3551"]
Glad you figured everything out! This will surely help a lot of people that run custom network/bridge configs. Thanks for sharing.
-
3 hours ago, stFfn said:
well this was kinda my question. does anyone know a way to do all of that? how to get on that data and how to impliment it into this dashboard

Nope. Good luck. -
37 minutes ago, stFfn said:
does anyone have a good tutorial on how to impliment data from the fritzbox router into this dashboard?
or is it not even possible?
I’m the developer. As long as you can get the data into an InfluxDB (or alternate) data source, Grafana will it will handle it dynamically, and therefore you could add it into your UUD dash. You need some middleware or an API (like how we use Telegraph and Varkin now) to send the data from your app into a valid datasource. It could even be a SQL database. It just needs to be one of the approved Grafana data sources, and it should slice and dice.
-
5 minutes ago, noties said:
Masked for privacy. It does seem to be working for other tiles in the dashboard like Stream Overview, Stream Bandwidth, Media Types, Media Qualities, etc. The library tiles are the only thing having an issue.

I do see library_stats data getting written to Influx in my Varken logs:

Yeah I figured, just wanted to be sure. Try removing each element in the query until you are at the base, then try to build it again from that. Sometimes Grafana gets messed up in the JSON and does not display elements as it should. Sometimes the select statement can act as a filter for the items in the from statement (possibly a Grafana bug). You can also just try making a new panel from scratch and see if these elements show up. -
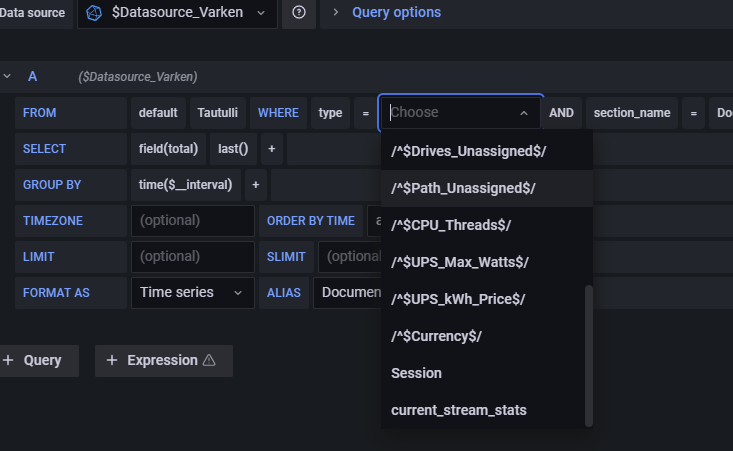
31 minutes ago, noties said:
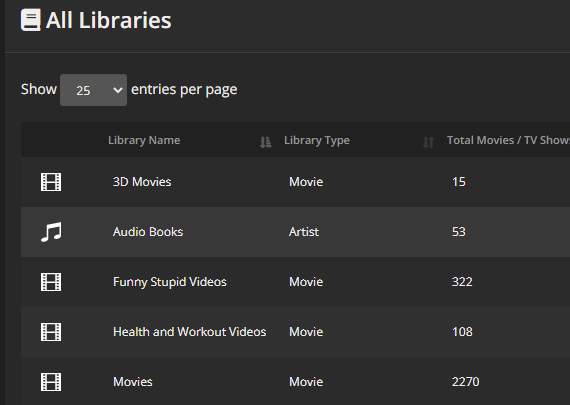
Yeah, I've done that with other tiles in the dashboard, but this one is not giving me any choices so I'm wondering if I have something misconfigured on the Varken, Grafana, or Tautulli side of things.
In fact, I don't see library_stats as an available choice. I'm wondering if that's the cause, though I'm not sure where I need to enable that or if it's possible. I don't see anything to enable in Tautulli and I can see all of my libraries there.
Relevant varken.ini for tautulli
[tautulli-1]
url = 10.3.3.110:8181
fallback_ip = x.x.x.x
apikey = xxxxxxxxxx
ssl = false
verify_ssl = false
get_activity = true
get_activity_run_seconds = 30
get_stats = true
get_stats_run_seconds = 3600
Is your API key masked on purpose for privacy or is it actually missing? -
1 minute ago, Symon said:
Are you still happy with Duplicacy? I'm right now in the situation that I've set up rclone with gdrive (plex) and am now looking for a solution to backup my shares to Gdrive as well. Currently, I can't decide whether to just copy the shares and upload them to GDrive every week with a script (1 TB of Data) or use a solution like Duplicacy.
I've had no issues with Duplicacy. I did test some extensive restores and all worked out and checksummed correctly. However, for such a small amount of data, I would just RClone the differentials. That way you have direct file access (even though they are encrypted).
Another thought is that I REALLY love TRESORIT. It's pricey but it is THE ABSOLUTE BEST box type sync with high quality encryption out there. It blows DropBox out of the Water. If you are under 2TB, I'd go TRESORIT and use a Windows Machine with a program called SyncFoldersPro. This is how I backup my NFO files and metadata for Kodi, etc.. I use SyncFoldersPro to simultaneously backup (with advanced filters) to my onsite backup server and Tresorit online backup. Works like a charm!
-
1
-
-
On 6/1/2021 at 12:55 AM, Digaumspider said:
Hello and thanks for the work on this.
I'm new to unRaid and I've been learning quite a lot recently. I'm interested in running this solution and found on one of your posts that the "Grafana-Unraid-Stack" would run with your UUD and it does run nicely, but I'd like to update it to your latest 1.6 version, instead of the deprecated 1.3 that comes with the "Grafana-Unraid-Stack" container.
I've been trying to find the information on how to proceed with that update to that container, but couldn't find it anywhere.
Would it be possible to point a Noob in the needed direction to update the Grafana-Unraid-Stack for the UUD 1.6 and future versions?
Thank you very much.
Yes, of course. Just download the UUD 1.6 JSON file from post #1, and then import it to Grafana manually. The new dashboard will appear and you can modify as needed. This has been detailed in this forum topic a few times. Please keep in mind that you will have many new dependencies and plugins that will be required when migrating from 1.3 to 1.6. Good luck!
-
And what the heck, I will be the 1,000th reply to my own thread ha ha.
Thanks for everyone's interest and support for the UUD!
-
 1
1
-
-
On 5/18/2021 at 2:25 AM, corgan said:
@falconexe The developer of the Grafana dynamic-image-panel just released a new Version with a new feature request from me.
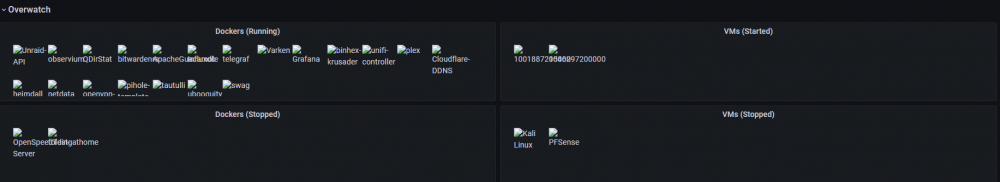
It's now possible to show the status of a container/vm as an image overlay. So it's possible to get an overview with just one request.
Download pre-release version 2.3.0 or install via grafana-cli command line
grafana-cli --pluginUrl https://github.com/Dalvany/dalvany-image-panel/releases/download/v2.3.0/dalvany-image-panel-2.3.0.zip plugins install dalvany-image-panellooks pretty cool
Config:
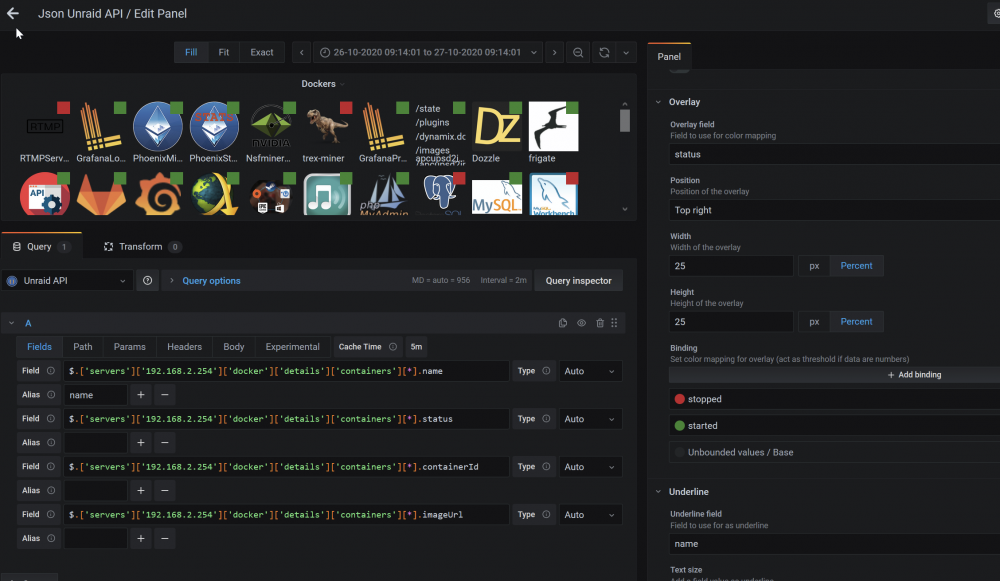
That's sweet man. Thanks for all of your work in this area. When I come back, I'll add this to UUD 1.7 and consolidate the Running/Non-Running panels!
-
1
-
-
Hey guys. I just found out about Chia. Is there any info you can provide about how to setup the docker/tips tricks/ and anything else I should know. I have a spare 100TB on my main server. What are your thoughts on Chia so far? I was pretty heavy into bitcoin mining a while back. I know that Chia transactions are supposed to be enabled right now. Thanks guys.
-
@FreeMan sorry man. Not sure what caused that. I know that Docker updates can really screw with stuff. Maybe the Grafana images plugin got updated and reset parameters? Good luck man.


Ultimate UNRAID Dashboard (UUD)
in User Customizations
Posted · Edited by falconexe
Dude, I'm really freaking pumped!!! I FINALLY figured this thing out that has been bugging me for over a year. Remember how I added a Plex Log with real time statistics of streams? Well I suppressed the % Viewed because I could never get it to work right.
The issue was that over the 10 minute timeframe (each single data point = 10 minutes), there would be multiple values for % Viewed. For instance, if 1% equals 1 minute, you would have 10 different percent viewed data points (rows in the table) for that single time data point like 12:10 (X10 Percent Viewed rows between 12:00 - 12:10). Needles to say, this was freaking ugly because it would 10X the data for each data point. So instead of 6 rows for an hour, I would end up with 60 (per user)!
Tonight, I bring you the FINISHED PLEX Log with TRUE gradient gauge coloring based on ACTUAL % Viewed, and only 1 Data Point for Each 10 Minute timeframe per user. Viola!
Here is what you need to do in order for this to work correctly.
To Get the Progress % to Show Up Only Once For Each 10 Minute Period:
To Get the Sweet Dynamic Color Gauges Based on Actual Percent Viewed:
@SpencerJ