






falconexe
Community Developer
-
Joined
Everything posted by falconexe
-
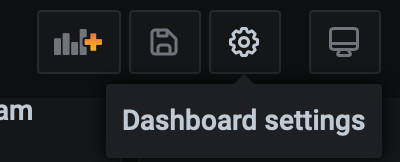
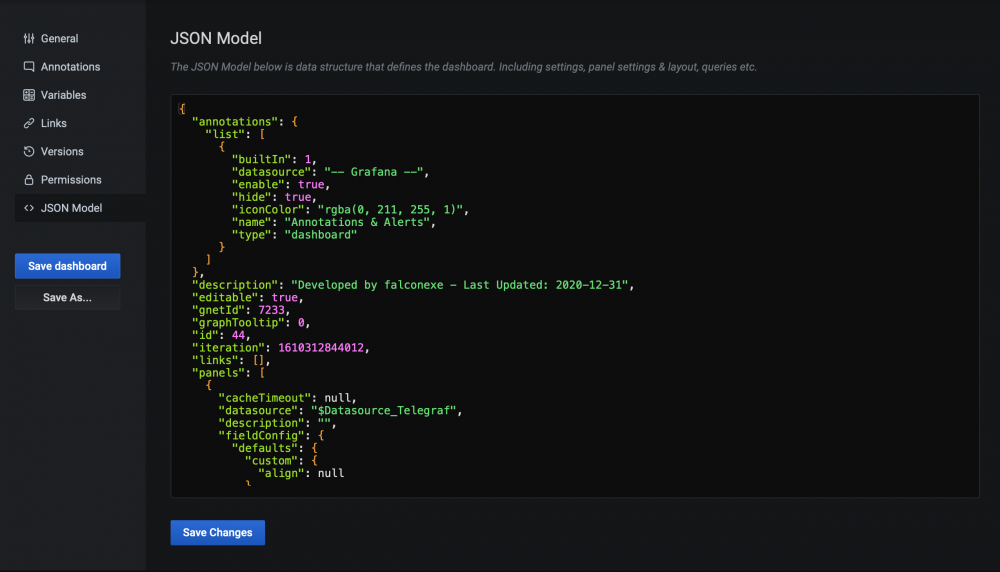
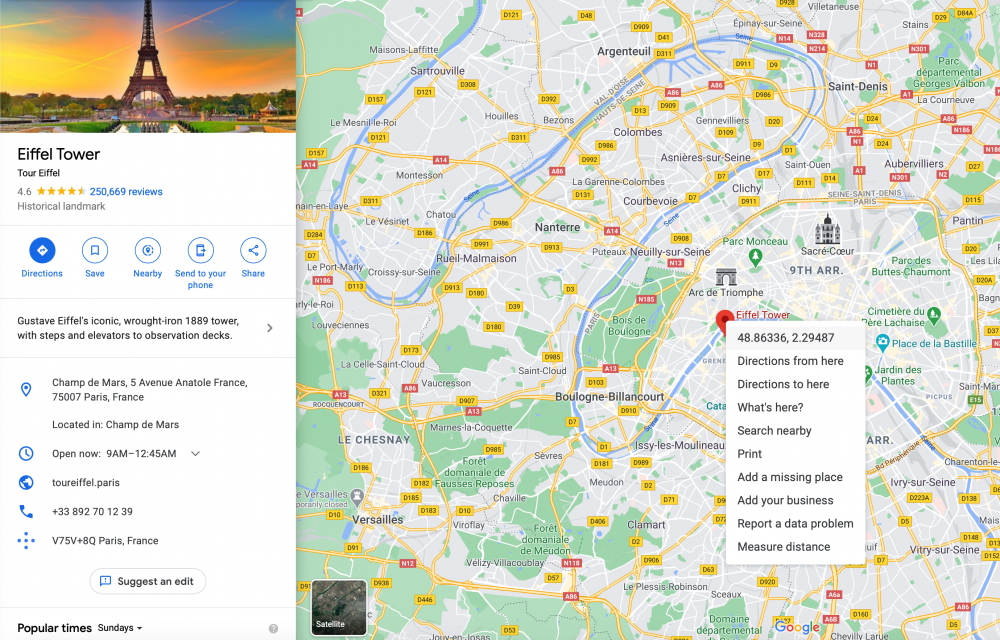
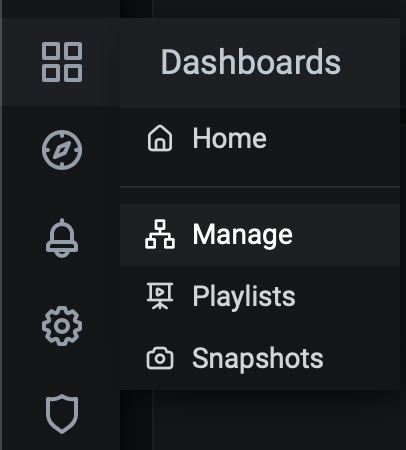
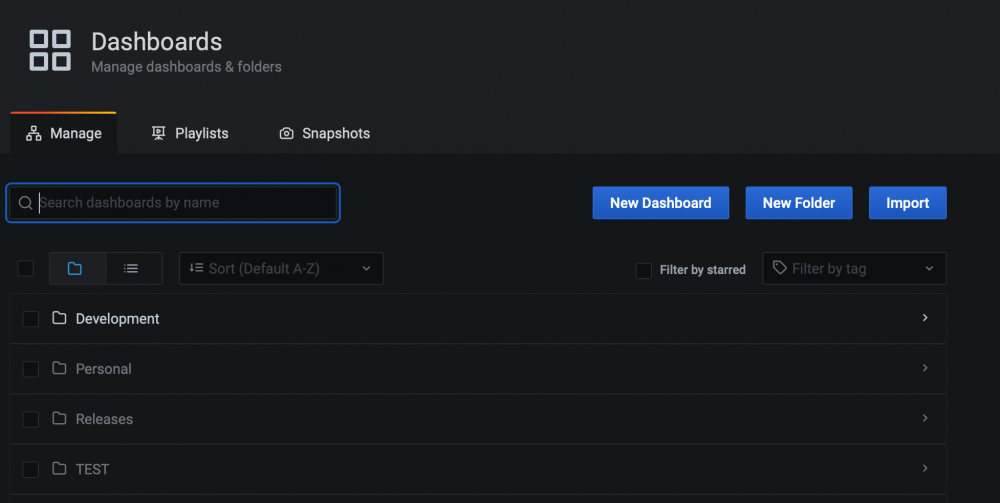
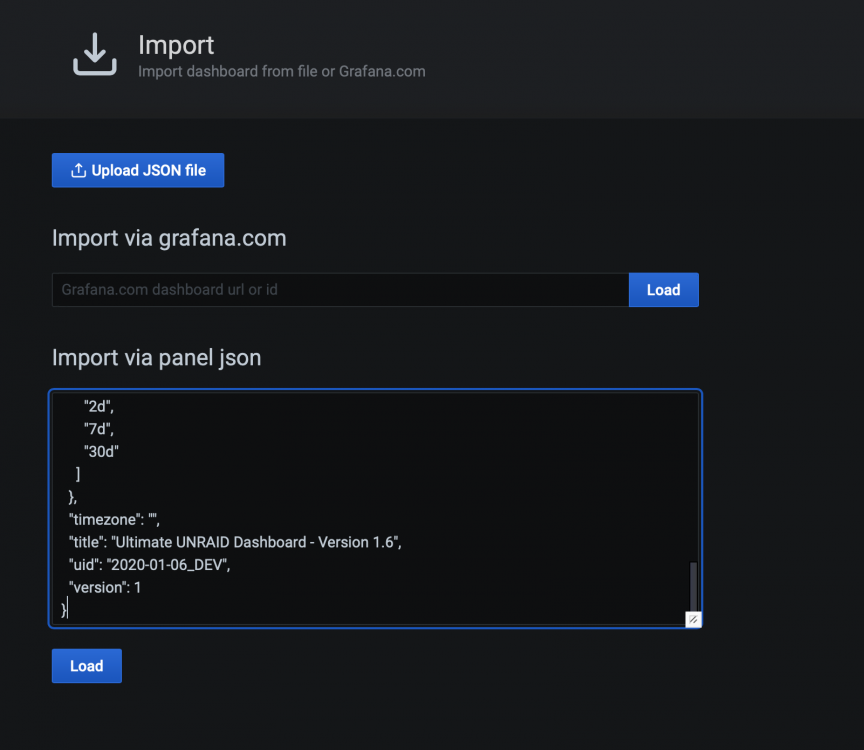
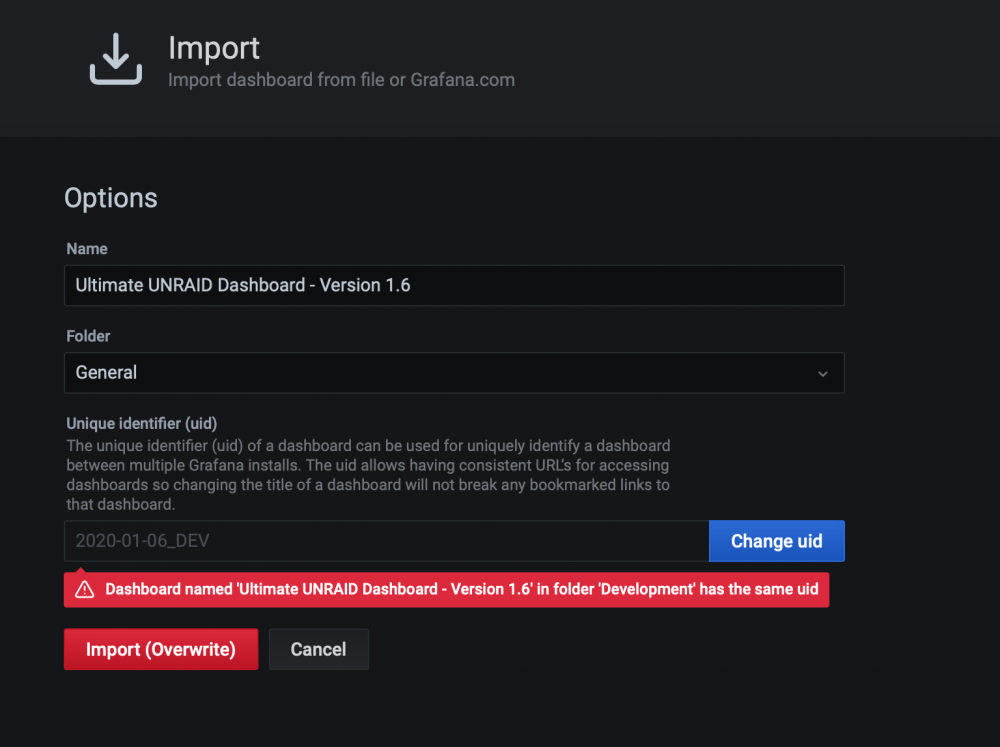
I couldn't get the edit button to work, so I provided this manual tutorial below. Obviously, doing through a panel edit is MUCH easier LOL. Did you just keep trying? How did you get to the edit menu?

-
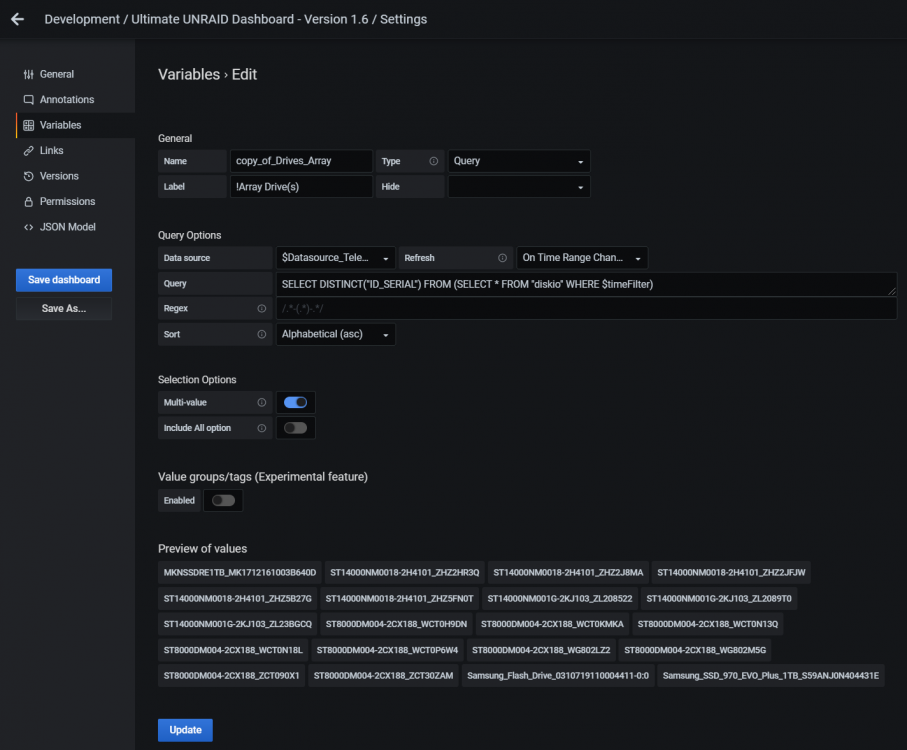
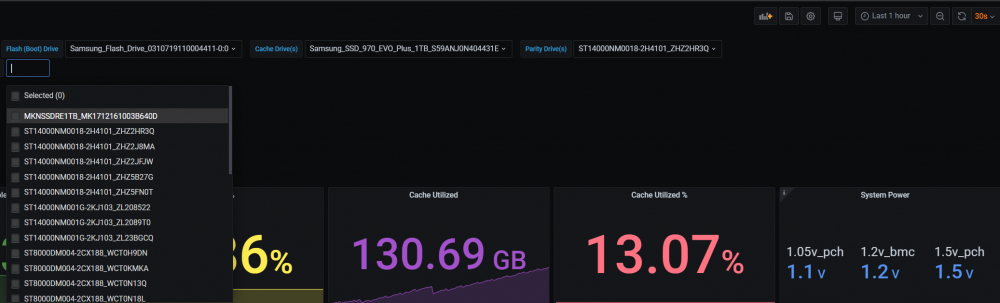
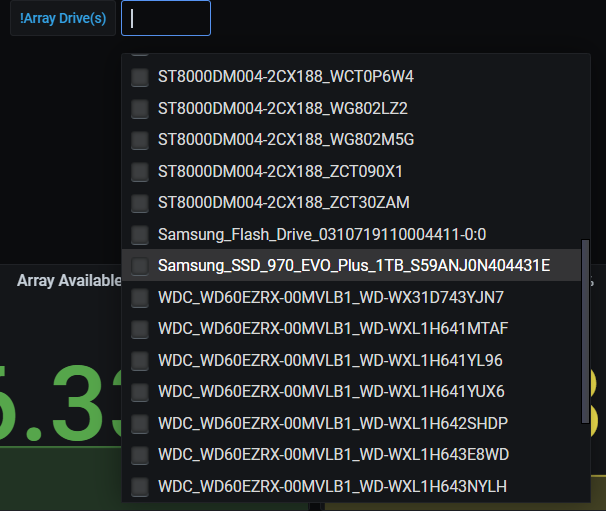
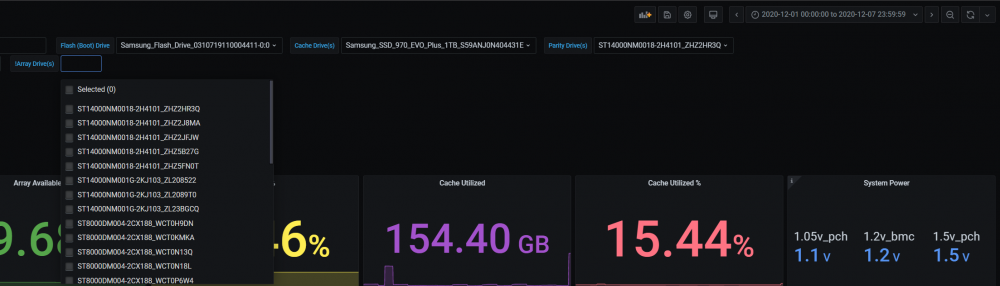
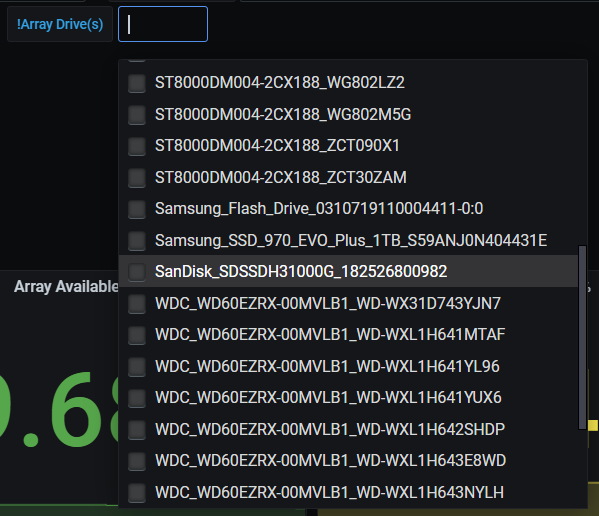
Hey guys. I am hard at work on VERSION 1.6! I just came across an exciting new fix that I will be implementing in the next version to isolate variable contents to match the selected timeframe of the dashboard. I recently swapped out some drives and noticed that the old ones, along with the new ones, were still showing up in the drive variable drop down menus. This was bugging the crap out of me, so I was determined to fix it. @GilbN and I were looking into REGEX and retention policies, but I stumbled on a way to use sub queries (tricky stuff) to isolate the variable content to exactly match the timeframe selected in the dash. Source: https://github.com/jorgedlcruz/vmware-grafana/issues/27 TLDR: Old Drives Won't Show Up in the Drive Variables Anymore! Panels That Use These Variables Won't Show Stale Data Anymore! The Details are Below: So by using a sub query inside of a query, and filtering by the "time filter" (built in variable) you can have the variables be dynamic in the fact that only the variable values that were present during the selected timeframe will show up. So if you choose the last 24 hours, and you performed a drive swap 2 days ago, the old drive will no longer show up. Vice versa, if you select a week ago, the new disk will no longer show up, but the old one will. I tested this and it works awesome! I am going to implement this across ALL of my variables to ensure they are dynamic. Some Key Info: You Need to Set the Variable Refresh to "On Time Range Change" The Variable Drop Down Menus ONLY Update Once a Time Filter is Selected (Changed) Example: Last Week to Last 24 Hours You Can Also Filter Variables by Setting a Specific Date Range (Calendar) If a Timeframe Includes Overlap, the Drop Down Will Contain ALL Variable Values Present During that Overlap Example: Drive Swap Occurred 2 Weeks Ago, and "Last Month" Time Range is Selected Variable Drop Down Will Include Values For Both Drives Weeks 1-2 AND (Old Drive) Weeks 3-4 (New Drive) Here is an Example of the Implementation: OLD Query: SHOW TAG VALUES FROM "diskio" WITH KEY = "ID_SERIAL" New Query: SELECT DISTINCT("ID_SERIAL") FROM (SELECT * FROM "diskio" WHERE $timeFilter) Example Results: A Sandisk SSD drive was my old Unassigned Drive, and it was replaced by a Mushkin SSD drive. SanDisk Present / Mushkin Missing Because it Was Not Installed Yet (Last Month - 2020-12-01 thru 2020-12-07) You can see that the Mushkin Drive is Not Present at the Top You can see the SanDisk Drive Is Present SanDisk Gone Because it Was Uninstalled/ Mushkin Present (Last Hour): You can see that the Mushkin Drive is Present at the Top You can see the SanDisk Drive Is Gone From the List Let me know your thoughts!
-
I have not seen that one before... Did you runt the following Post Arguments in the Telegraf Docker to install IPMI?

-
Yes, I answered this in detail a few pages back. Search the topic for “Map”.
-
Hey wanted to shout out a congrats to @GilbN for officially becoming the latest UNRAID Community Developer! @SpencerJ You deserve it Man!

-
I literally just went through this same issue after swapping my unassigned drives. What fixed it was a complete reboot of my UNRAID server and then clearing my browser cookies and restarting the dashboard. Try that and report back.
-
Never seen those errors before. Sounds like DiskIO and/or SMART are having problems if you are not getting drives to populate in the variable drop downs. I’ll check back this weekend. If any one else can assist, please chime in. Thanks guys!
-
Not like that! Mine barely registers. What were the charts? What was your timeline?
-
Unfortunately, I'm crazy busy with my professional work, and will be until this weekend. I have not seen those before. And I find it odd that you getting ZERO data in Grafana. Usually if these 2 plugins were broken, you would get other stuff reporting at least. The fact that you have nothing sounds like a fundamental install issue with one of the 3 main dockers (Grafana/Telegraf/InfluxDB). Are you by chance using GUS? Please check your docker parameters, docker config/ini files, all dependencies found on page 1 on this topic, and Gilbn's tutorial website if you haven't already. Also have a look at the video series that was posted a few pages back for some additional insight. @GilbN, or anyone else, have any thoughts, or ever run into/seen this?
-
Hmm. You down for a virtual meeting? PM me if you are. We can figure it out. @Boomháuer Please screenshot your query. We may have to refine the query with a GROUP BY clause and/or MATH (SUM).
-
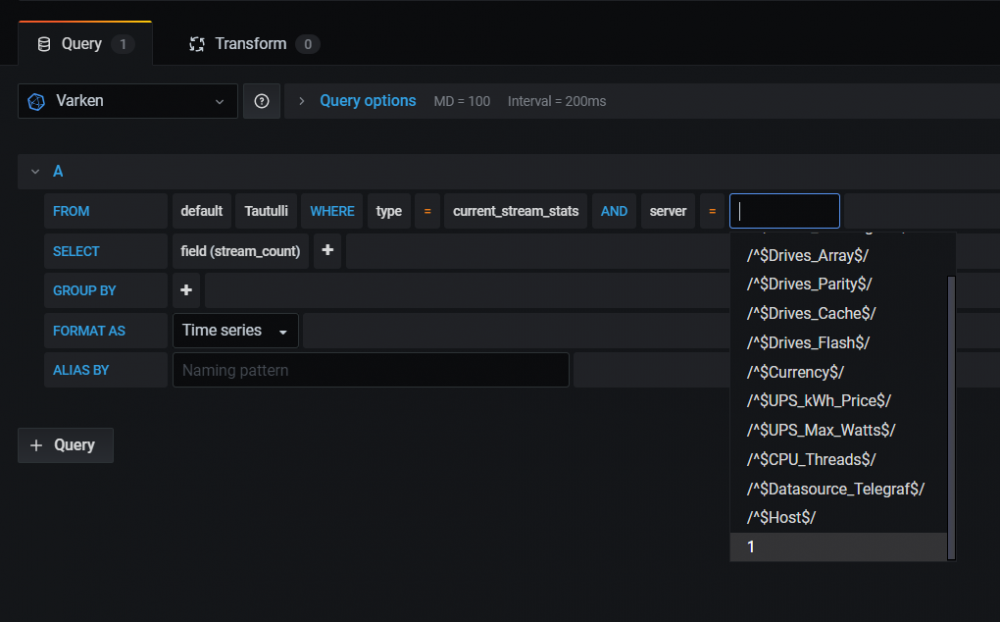
SORRY. Use “OR”. Updated my original...it was late. This logic states look for server 1 or server 2. It would be impossible for both servers to be (one server). So it can’t be both 1 and 2, but you can query 1 or 2 (giving you a dataset of both). BOOLEAN LOGIC...
-
You could also use this to COMBINE stats form multiple servers as well. So if you split libraries or something like that, you are covered. Or if you want to see your total LAN/WAN bandwidth across all PLEX streams across multiple servers, etc... Just add 2 or more Server Tags like: server = "1" OR server = "2"
-
Yep it is that CRAZY SIMPLE: Just add a Server Tag and select the Number of your Tautulli instance. @Boomháuer There you go man!
-
Yep, I was just thinking the same thing...
-
But you do need to reference the different Tautulli instances (Tautulli-1, Tautulli-2, etc.) within the Varken config somehow. Like I said, I haven't even looked at this, but maybe it is MUCH simpler than I thought.
-
Honestly, I haven't got that far and It's not a use case I have. I'm just guessing about the secondary datasource, but it does sound right when I think about it. Tell you what, I'll go through the motions when I get some time and setup a second Plex/Tautulli/Varken setup on my backup server to test this. Once I have it all figured out, I'll include it in a future UUD update (if it is possible and not a limitation). Anyone else running 2 or more Plex servers? Is this is huge advantage for anyone else? @Boomháuer If you happen to figure it out on your own, let me know how you solved it. @GilbN I'm interested to get your thoughts/take on this. Feel free to chime in man. You're welcome.
-
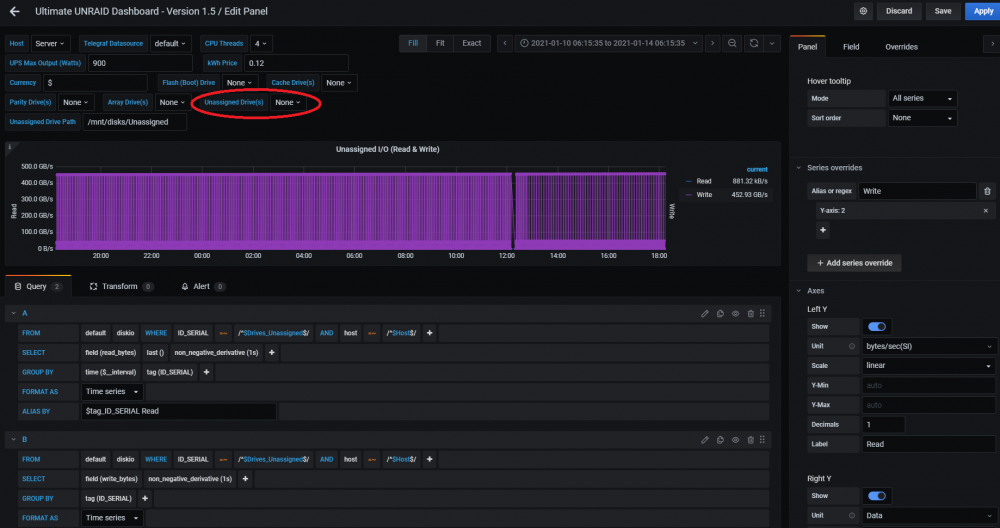
You need to set all of the variables in the top of the dash, including the Unassigned Drive(s) one which drives this panel via the "$Drives_Unassigned" Variable. If you don't set these, most of the dash is DOA. Note: This information was previously provided in post number 1 under the Dependencies section.

-
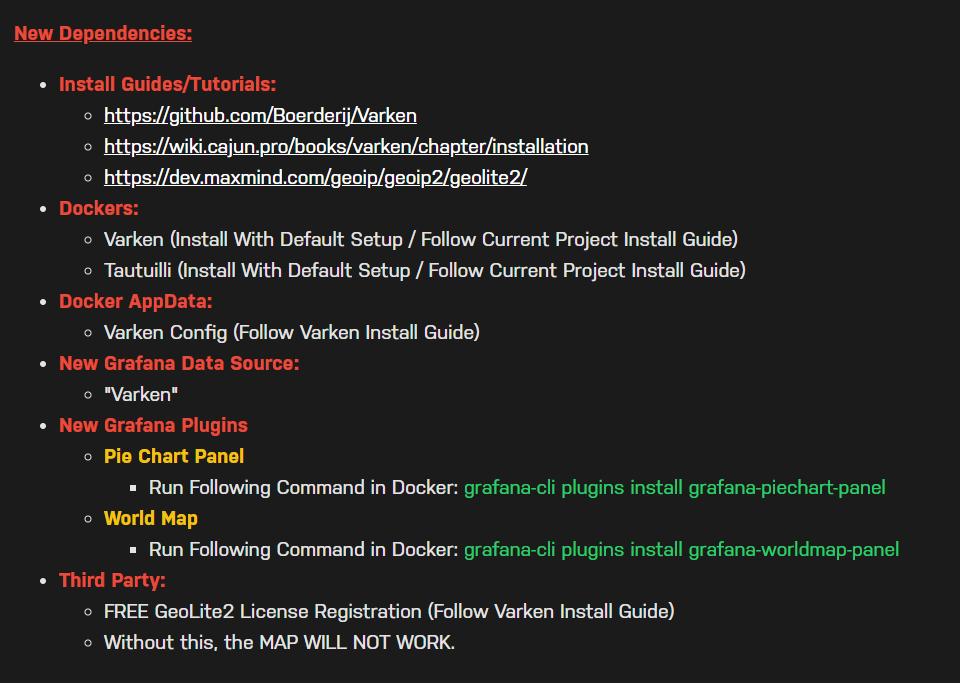
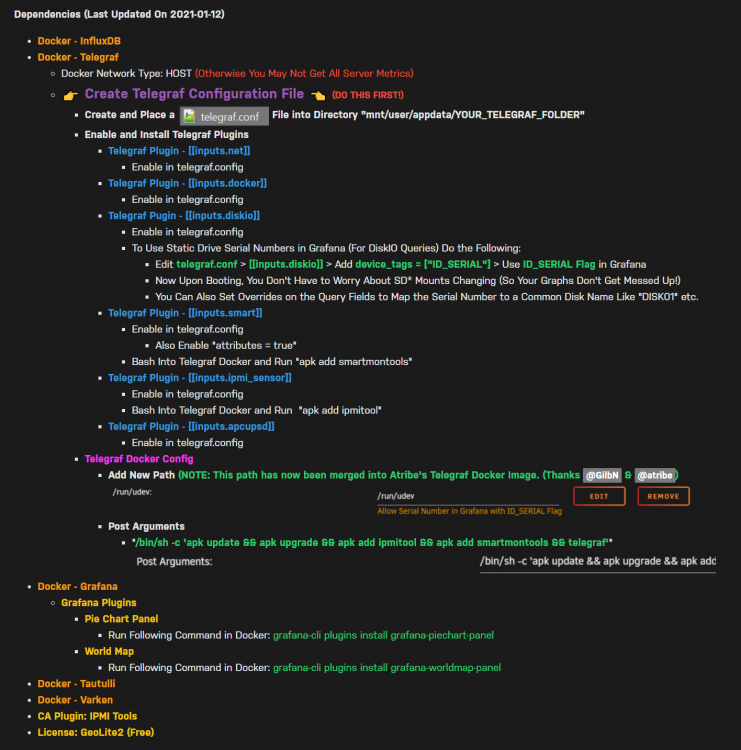
I updated the instructions in multiple areas to include these new Grafana plugin steps. These are in the Varken install guides, but it is also nice to have in-line... Version 1.5 Release Notes: Post Number 1 Dependencies:
-
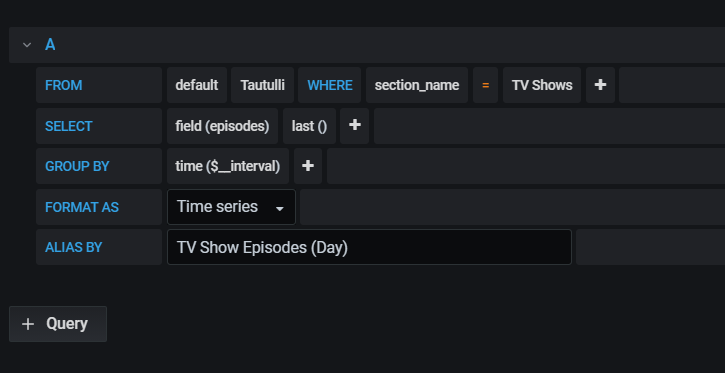
Q1: Page 2: You need to modify each of these Varken queries to account for your specific library name/path via the SECTION NAME tag. So for example, if you have "TVShows" instead of "TV Shows", you'll need to adjust that in each query as applicable: Q2: Ensure your actual unassigned device is selected in the top drop down menu variable. Check the units on the field/override (right side of the screen). Also check the math division in the query to ensure it is correct. Clearly something is off with that... All of the UUD panels like this use bytes and use division to get GB or TB.

-
Haven’t tried this yet, but You’ll most likely need to setup a second Varken datasource referencing Tautulli-2, and then you’ll need to create a Varken datasource variable so it can be dynamic, then assign that variable to the datasource section of each Varken panel, and then finally set the variable using the dropdown menu in the top of the dash. This concept is the exact same as the Telegraf and Hosts variables that are already setup in the UUD. Have a look at those variables as a reference under the dashboard settings page. You should be able to copy/reverse engineer that methodology and apply it to this use case. Let us know if you get it working snd share some screenshots of your datasources and variables once you do! I’ll see about adding this functionality natively to the dashboard in a future update.
-
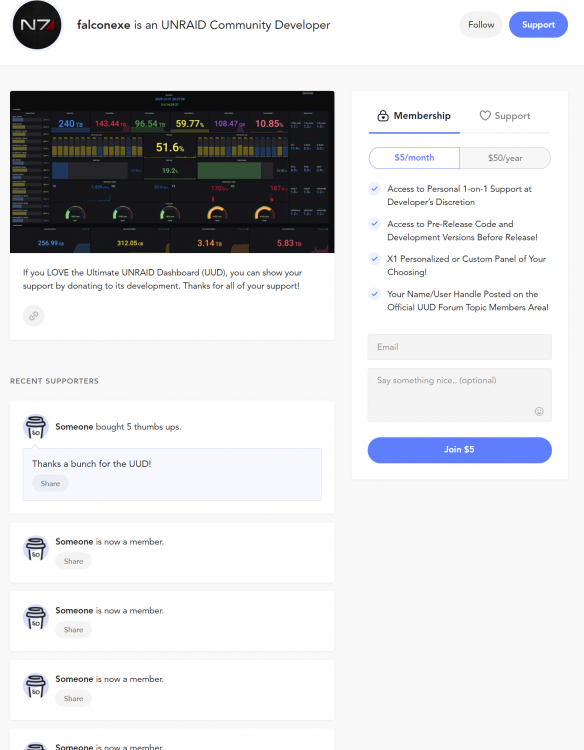
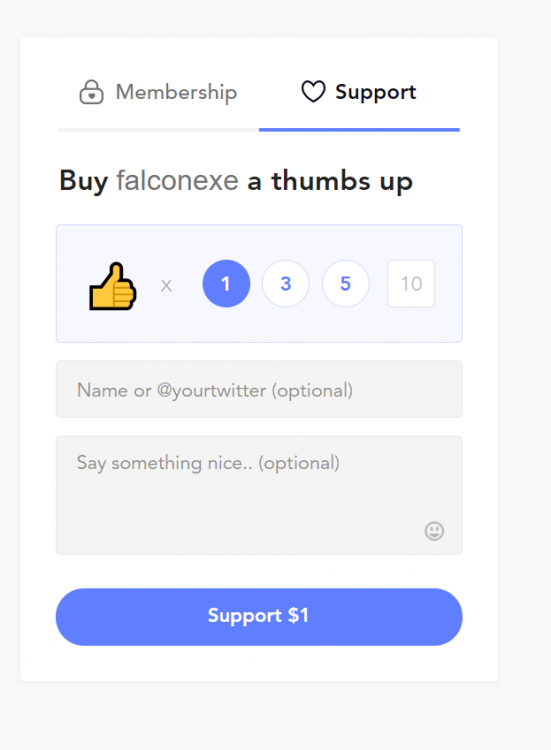
Hi everyone. This thing called the UUD has blown up considerably since the version 1.5 release (and the above post), and by being featured by UNRAID themselves. I've had very little free time since supporting the influx (no pun intended LOL) of new users, DMs, phone calls, virtual meetings, forum questions, and continued development on future versions. So for those that really need my personal help, I have setup something new for you with some perks to go along. Not sure if you guys are even interested in something like this, but my Wife is getting on my case about the time/value proposition of this project, so I am appeasing her with this ha ha. Otherwise, I'll have to back off and just stick to future version development and let the community take the reigns on general support (which I would and do appreciate). So here goes... If you want to support this project with a monthly or discounted annual membership, I am offering the below perks, with possibly some more to come in the future (let me know if you guys have any ideas). Ultimate UNRAID Dashboard Membership Perks: Access to Personal 1-on-1 Support at Developer’s Discretion Access to Pre-Release Code and Development Versions Before Release! X1 Personalized or Custom Panel of Your Choosing! Your Name/User Handle Posted on the Official UUD Forum Topic Members Area! As always, you can also support the continued development of the UUD with a one-time donation if a membership is not your thing. Here are some really cool stats for the UUD so far: Topic Views: 42,831 Topic Replies: 660 Topic Pages: 27 UUD Downloads to Date: 1,183 You can find my donation page by clicking below or the above pics. Thanks guys!



-
No that sounds odd. You set the Telegraf config and datasource (datasource is prob fine if you are getting network metrics)? You need to enable specific items in the Telegraf config. Please see post 1 for the plugins to enable. What kind of hardware? Please verify and report back.
-
Please see below:
-
YES. You will need to modify the queries for your hardware. Depending on your setup, some queries may work out of the box, but some will not. Please see page 1 for the below disclaimer. Please also read/search this topic for answers to MANY of what your next questions will be regarding certain panels and areas of the dash. If you have a net new problem, we are happy to assist where possible.

-
Create new panels in 1.5. Copy the JSON code from the NUT examples into it. Apply and Save the Dash. You can do this with 1 or more panels. Alternately, you can look at the queries in the NUT example, and then modify the 1.5 queries to match. You may need to add the NUT datasource into Grafana. I don't use NUT so can't vouch for it.






