





FreeMan
Members
-
Joined
-
Last visited
Everything posted by FreeMan
-
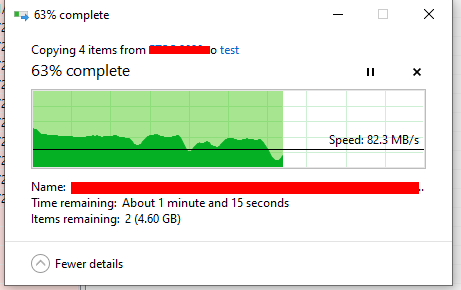
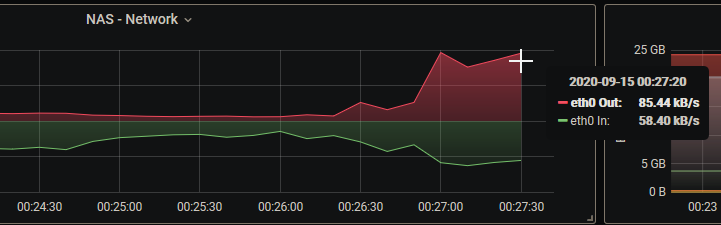
I just DL'd @GilbN's dashboard (7233) and it does seem to give me some numbers: However, the "Today" in blue hasn't changed, even though I've copied a couple of GB of data around for testing purposes. It does seem to have picked up all my drives and none extra. I just copied another ~13 GB of data from the array to a new temp directory (on the cache drive) using my Win10 machine to force some network traffic. This is the network throughput Win10 was reporting: And this is what Grafana (on a 5 second update) was reporting as soon as I could get a screen shot (after the one above). I'm not sure which one to believe, though I'd think Win was closer to accurate considering the amount of time it took to copy. After copying this data, the Blue "Data Growth Today" box still isn't indicating anything - it's still reading "0 B". It's actually giving me some CPU temps, though I'm not sure what each temp actually is (most are labeled "it8620-isa-0228"). I recall some issues with that a few years ago - this isn't a server MoBo. It isn't even a high-end MoBo, so it may not report a lot of things that others might. I'll have a poke into some of the queries and see if I can duplicate them in @falconexe's dash and post the results. I probably won't get to it tonight, though.

-
Well, I just copied all the raw JSON to Notepad++ and did a search/replace for "MassEffect" with "NAS". I found 4 occurences of "datasource" : "MassEffect" and replaced them. I went back to the main menu of Grafana, then reselected the UUD and it came up without any errors about not being able to find a "MassEffect" data source, so there that! Also, I think that may be a MUCH more efficient way of getting rid of the queries for the extra 15 or so drives - I've only got 8 data drives plus parity and the Grafana interface is really slow in deleting. I've edited a couple of the disk graphs to eliminate Parity02, since I'm only running one parity drive, but I haven't been able to get any disk usage stats yet. I haven't tried downloading GilbN's most recent dash to see if that works yet. Been busy grilling & eating dinner, so it's been in and out.
-
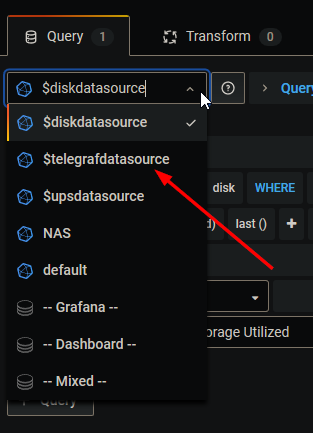
I think this is what @GilbN means
-
You're not the only one:

-
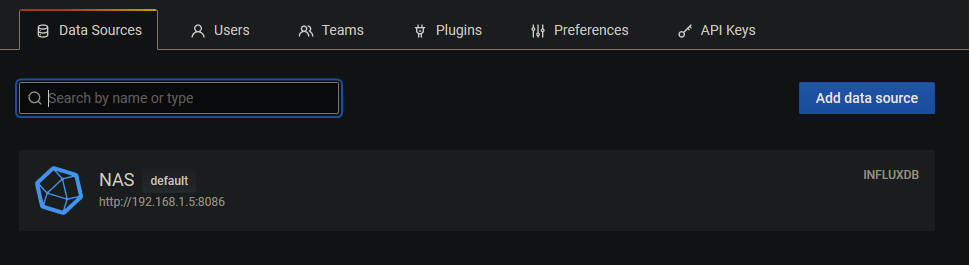
I seem to recall having changed that very early on. Or at least looked at it.
-
still no love
-
Also, odd that even though it's got my server name in the dash variables, I still get that big red error about not being able to find MassEffect (and for some odd reason, the forum wouldn't let me embed the image in the post...)

-
A recommended better way of doing it? I can see assigning parity a name and leaving the rest labeled by sdx - that won't change, but, what was sdd on last boot may be sdb on this boot and that would cause all sorts of bizarre reporting next time 'round.
-
Yeah... I started figuring that out. I, somewhat naively it seems, ass-u-med that it would figure out how many drives I've got and report on 'em. Maybe V2.0. I'm editing one of the panels and set Parity01 to sdd. Can't that assignment change with every boot? Doesn't that mean that the next time I reboot my machine, these may all need to be changed?
-
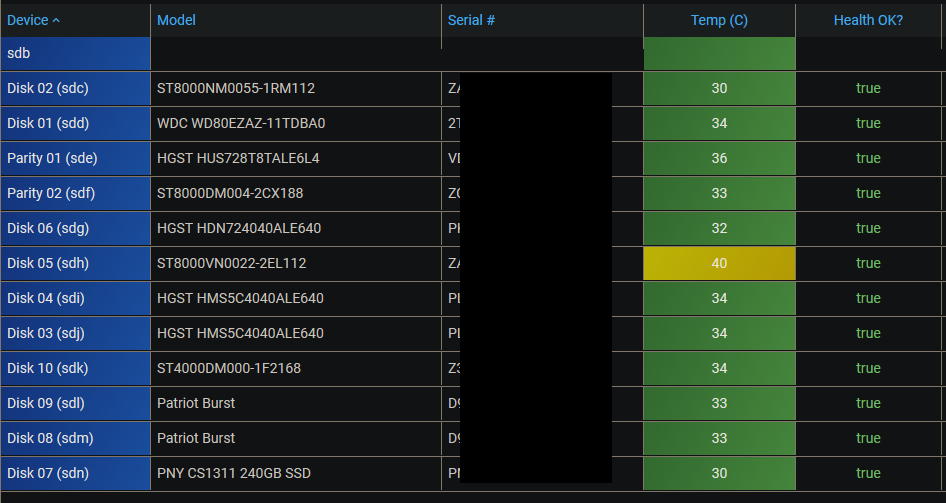
Gotcha! For some reason, I can't get the web-based console to work for me, so I did `docker exec -i -t telegraf bash` from an SSH session. From there: bash-5.0# which smartctl /usr/sbin/smartctl bash-5.0# ls -la /usr/sbin/sma* -rwxr-xr-x 1 root root 761448 Feb 22 2020 /usr/sbin/smartctl -rwxr-xr-x 1 root root 617416 Feb 22 2020 /usr/sbin/smartd bash-5.0# smartctl -i /dev/sdb smartctl 7.1 2019-12-30 r5022 [x86_64-linux-4.19.107-Unraid] (local build) Copyright (C) 2002-19, Bruce Allen, Christian Franke, www.smartmontools.org === START OF INFORMATION SECTION === Model Family: Seagate Barracuda Compute <snip> bash-5.0# /usr/sbin/smartctl -i /dev/sdb smartctl 7.1 2019-12-30 r5022 [x86_64-linux-4.19.107-Unraid] (local build) Copyright (C) 2002-19, Bruce Allen, Christian Franke, www.smartmontools.org === START OF INFORMATION SECTION === so, within the docker itself, it can find smartctl on the path, it sees it at /usr/sbin, it works when finding it on the path and it works when giving it an absolute path. However, I'm still getting my log spammed with: 2020-09-14T21:45:50Z E! [inputs.smart] Error in plugin: failed to run command '/usr/bin/smartctl --scan': fork/exec /usr/bin/smartctl: no such file or directory - Then... So I adjusted my telegraf.conf to almost match - I commented out the `path = "/usr/bin/smartctl"` portion and uncommented `attributes = false` and forgot to set it to `true`. No errors and some HDD data!!! I set `attributes = true` and still only some joy... but... So, I'm getting some HDD data now, but not everything. Interestingly, /dev/sdb is the drive I used for testing access to smartctl earlier and it responded just fine. It's a reasonably new 8TB drive. Odd that it's not responding here when all the others are responding without issue now.
-
Thanks for digging into this. Unfortunately, even after adding that to the Post Arguments, I'm still getting 2020-09-14T21:32:35Z I! Starting Telegraf 1.15.3 2020-09-14T21:32:35Z I! Using config file: /etc/telegraf/telegraf.conf 2020-09-14T21:32:35Z I! Loaded inputs: kernel mem docker netstat sensors disk cpu processes system smart diskio swap apcupsd net 2020-09-14T21:32:35Z I! Loaded aggregators: 2020-09-14T21:32:35Z I! Loaded processors: 2020-09-14T21:32:35Z I! Loaded outputs: influxdb 2020-09-14T21:32:35Z I! Tags enabled: host=NAS 2020-09-14T21:32:35Z I! [agent] Config: Interval:10s, Quiet:false, Hostname:"NAS", Flush Interval:10s 2020-09-14T21:32:40Z E! [inputs.smart] Error in plugin: failed to run command '/usr/bin/smartctl --scan': fork/exec /usr/bin/smartctl: no such file or directory - Just to be sure, I copy pasted what you quoted above for the Post Arguments. Here's a copy/paste back from the config page. Looks right to me, but just in case I can't read this afternoon... /bin/sh -c 'apk update && apk upgrade && apk add ipmitool && apk add smartmontools && telegraf' Also, I added the --restart=always to the Extra Parameters setting. Obviously, it sets it to always restart, but at what point is it restarting?
-
I'd thought about that... Uncommented (removed both #) and at least the error is different, and different is progress. Right! Right?? 2020-09-14T19:00:27Z I! Starting Telegraf 1.15.3 2020-09-14T19:00:27Z I! Using config file: /etc/telegraf/telegraf.conf 2020-09-14T19:00:27Z I! Loaded inputs: mem apcupsd disk net netstat diskio kernel processes system cpu docker sensors smart swap 2020-09-14T19:00:27Z I! Loaded aggregators: 2020-09-14T19:00:27Z I! Loaded processors: 2020-09-14T19:00:27Z I! Loaded outputs: influxdb 2020-09-14T19:00:27Z I! Tags enabled: host=NAS 2020-09-14T19:00:27Z I! [agent] Config: Interval:10s, Quiet:false, Hostname:"NAS", Flush Interval:10s 2020-09-14T19:00:27Z I! Starting Telegraf 1.15.3 2020-09-14T19:00:27Z I! Using config file: /etc/telegraf/telegraf.conf 2020-09-14T19:00:27Z I! Loaded inputs: mem apcupsd disk net netstat diskio kernel processes system cpu docker sensors smart swap 2020-09-14T19:00:27Z I! Loaded aggregators: 2020-09-14T19:00:27Z I! Loaded processors: 2020-09-14T19:00:27Z I! Loaded outputs: influxdb 2020-09-14T19:00:27Z I! Tags enabled: host=NAS 2020-09-14T19:00:27Z I! [agent] Config: Interval:10s, Quiet:false, Hostname:"NAS", Flush Interval:10s 2020-09-14T19:00:30Z E! [inputs.smart] Error in plugin: failed to run command '/usr/bin/smartctl --scan': fork/exec /usr/bin/smartctl: no such file or directory - Also, I did stop HHDTtemp and commented it from the config so it's not looking for it on startup. Interesting that the log says "Starting Telegraf 1.15.3" twice within the same second with no apparent "Stopping telegraf" message in between.
-
My thought is that this shouldn't be necessary as I'm getting SMART reports in the unRAID WebGUI by default as well. After uncommenting the [[inputs.smart]] section header, I noticed this in the log: 2020-09-14T18:40:25Z I! Starting Telegraf 1.15.3 2020-09-14T18:40:25Z I! Using config file: /etc/telegraf/telegraf.conf 2020-09-14T18:40:25Z I! Loaded inputs: processes hddtemp netstat disk diskio docker sensors kernel apcupsd net smart cpu swap mem system 2020-09-14T18:40:25Z I! Loaded aggregators: 2020-09-14T18:40:25Z I! Loaded processors: 2020-09-14T18:40:25Z I! Loaded outputs: influxdb 2020-09-14T18:40:25Z I! Tags enabled: host=NAS 2020-09-14T18:40:25Z I! [agent] Config: Interval:10s, Quiet:false, Hostname:"NAS", Flush Interval:10s 2020-09-14T18:40:25Z I! Starting Telegraf 1.15.3 2020-09-14T18:40:25Z I! Using config file: /etc/telegraf/telegraf.conf 2020-09-14T18:40:25Z I! Loaded inputs: processes hddtemp netstat disk diskio docker sensors kernel apcupsd net smart cpu swap mem system 2020-09-14T18:40:25Z I! Loaded aggregators: 2020-09-14T18:40:25Z I! Loaded processors: 2020-09-14T18:40:25Z I! Loaded outputs: influxdb 2020-09-14T18:40:25Z I! Tags enabled: host=NAS 2020-09-14T18:40:25Z I! [agent] Config: Interval:10s, Quiet:false, Hostname:"NAS", Flush Interval:10s 2020-09-14T18:40:30Z E! [inputs.smart] Error in plugin: smartctl not found: verify that smartctl is installed and that smartctl is in your PATH 2020-09-14T18:40:30Z E! [inputs.smart] Error in plugin: smartctl not found: verify that smartctl is installed and that smartctl is in your PATH So it seems that it's not able to find smartctl at all, which is really odd since: root@NAS:~# which smartctl /usr/sbin/smartctl indicates that it's there and on the path. Also: root@NAS:~# smartctl -a /dev/sdb smartctl 7.1 2019-12-30 r5022 [x86_64-linux-4.19.107-Unraid] (local build) Copyright (C) 2002-19, Bruce Allen, Christian Franke, www.smartmontools.org === START OF INFORMATION SECTION === <snip> so from a command line, at least, I can access smartctl I was not getting any UPS info, then I discovered the [[inputs.apcupsd]] section and uncommented the header there. Now UPS data is working fine.
-
Picking up our conversation from the previous thread: This is what the inputs.smart section says now: # # Read metrics from storage devices supporting S.M.A.R.T. [[inputs.smart]] # ## Optionally specify the path to the smartctl executable # # path = "/usr/bin/smartctl" # # ## On most platforms smartctl requires root access. # ## Setting 'use_sudo' to true will make use of sudo to run smartctl. # ## Sudo must be configured to to allow the telegraf user to run smartctl # ## without a password. # # use_sudo = false # # ## Skip checking disks in this power mode. Defaults to # ## "standby" to not wake up disks that have stoped rotating. # ## See --nocheck in the man pages for smartctl. # ## smartctl version 5.41 and 5.42 have faulty detection of # ## power mode and might require changing this value to # ## "never" depending on your disks. nocheck = "standby" # # ## Gather all returned S.M.A.R.T. attribute metrics and the detailed # ## information from each drive into the 'smart_attribute' measurement. # # attributes = false # # ## Optionally specify devices to exclude from reporting. # # excludes = [ "/dev/pass6" ] # # ## Optionally specify devices and device type, if unset # ## a scan (smartctl --scan) for S.M.A.R.T. devices will # ## done and all found will be included except for the # ## excluded in excludes. # # devices = [ "/dev/ada0 -d atacam" ] # # ## Timeout for the smartctl command to complete. # # timeout = "30s" I had not previously edited this section at all, since there was no indication of needing to do so in GilbN's tutorial. I restarted telegraf after making these changes, but now (5-10 minutes later), I'm not seeing any HD data at all. I've updated to your V1.2 dash (replaced v1.1 with the same ID number) and I'm not getting anything. I've noted that from an SSH directly into the server, that `ls` cannot find /usr/bin/smartctl, but `which` seems to be able to find it, so I'm cornfused... root@NAS:/usr/bin# which smartctl /usr/sbin/smartctl root@NAS:/usr/bin# ls -la sma* /bin/ls: cannot access 'sma*': No such file or directory Of course, I realized that my drives were all spun down, and, theoretically, it should have been skipping data gathering for them. However, I'm still getting nothing even 10 minutes after clicking "spin up all drives".
-
Well, not quite "everything", but a fair chunk! I'd hit that drop down and saw that the box was empty - never occurred to me to just type the server name in. I'd been doing construction - working on fixing the porch ceiling - earlier yesterday, so my brain wasn't fully in IT mode. That's my excuse and I'm sticking with it! 🤣 Oddly, I'm not getting any disk space usage, which was the whole point of this exercise. I'm getting disk temps and I/O, but not for the cache drives. I've got a bit of tweaking to do, but I love it so far.
-
OK, I got the dockers set up. @GilbN thanks for your guide! Easy as pie, thouh you may want to make a note in your blog about setting it up that when you install telegraf, since it doesn't find the telegraf.conf file, it creates a directory named that. The directory has to be removed & replaced with the telegraph.conf file which then needs to be edited. This kept me quite confused for a bit. @falconexe - There's probably something just as simple for fixing this... I downloaded the v1.1 JSON file you posted. I was able to upload it just fine and everything comes up, except it throws an error that says it can't find MassEffect. That makes perfect sense, since that's your server name, not mine. Where the heck do I go to tweak that? There's nothing listed in the "host" drop-down menu: and I haven't (yet) been able to figure that one out. It does, though, list my server (NAS) for all the other options:


-
Have the tab open already but haven't started reading quite yet. I'd better get working on the house update project first - if I don't it may be several more days and the wife will be a bit upset with me. 🤣
-
@falconexe & @GilbN If the two of you figure out how to package this as a docker with some "easy" to follow instructions on setup & config (understanding that everyone's setup is different), you'll be the coolest kids at the playground for at least a month!!
-
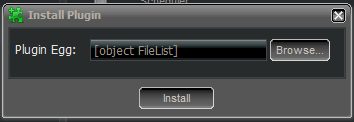
Winner, winner, chicken dinner! Thanks! There's a file of some sort called [object FileList] located in the plugins directory, which isn't surprising, that's exactly what was shown in the "install plugin" dialog box. Must be a bug somewhere in the install routine.
-
I'm very new to Deluge and this may be better on a Deluge support board, but I'll ask here first before I go create an account somewhere else. I've attempted to install the YaRSS2 plugin by changing the version number in the file name as was indicated could be done here. I click the "Install Plugin" button, click "Browse" then select the YaRSS2-2.1.4-py3.8.egg file and it shows me this: I click the Install button, the dialog box goes away, but I don't see any sign that the plugin has been installed. i.e., it's not in the list of plugin in the plugin page of Preferences. I even restarted the container and it's still not there. Am I doing this wrong, or is something not working correctly?
-
As another ProtonVPN user I was excited to find this! I followed your quoted version of @shaunsund post and integrated it with Spaceinvader One's video instructions, but I cannot get to the GUI. After typing up a long description of what I'd been through trying to get this to work, I decided to try one more thing. Just for the heck of it, I edited the docker settings to disable the VPN. I started the docker and was able to get to the GUI. I closed the tab, edited the docker settings to enable VPN and restarted the docker. Lo and behold, I can now get to the Deluge GUI! I have no idea why or how that worked. I will leave two little nuggets, though, for fellow ProtonVPN users: 1) Don't forget to grab your OpenVPN / IKEv2 username/pwd from your Proton account and set them up in the config. You cannot use your ProtonVPN/ProtonMail userID/pwd to access the VPN via 3rd party apps! 2) Make sure you download a specific country/server ovpn file, or you may not get connected to a server that supports P2P.
-
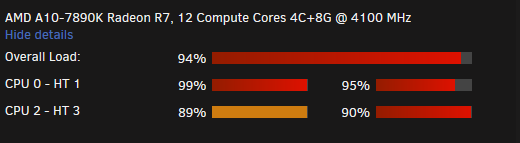
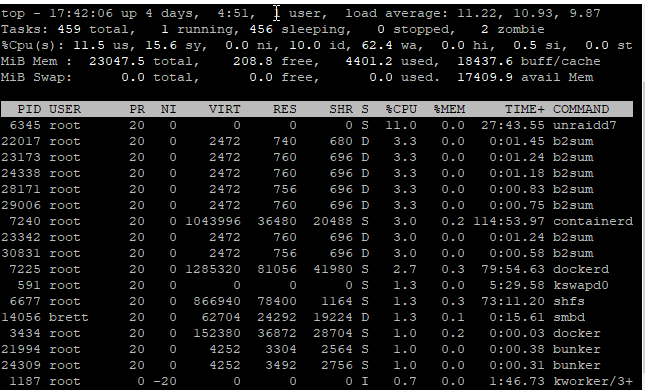
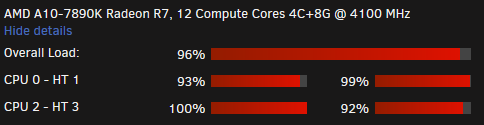
The CPU is generally at low usage, even with the plugin enabled. On occasion I see it nearly pinned, and I'd like to know what to do to try to track down what's causing it. I agree that it could be FIP causing the issue, and I think b2sum is part of the FIP, but I'm not certain. However, what the GUI was showing in those screen shots and what top was showing me don't seem to come close to adding up. It could well be my misunderstanding of how *nix works and I'm just not interpreting the results of top correctly. The server does generally seem to be sluggish when the GUI shows high utilization as that's usually what triggers me to go look at the dashboard to see what's going on, so the GUI's representation does seem to be accurate.
-
Yes I am. Sent from my moto g(7) using Tapatalk
-
I've noticed several times in the last few weeks that my server is showing very high CPU utilization: Obviously, the numbers bounce around, but it will stay at this level for a while. I fired up an SSH session and ran top and it shows me something along these lines: The CPU percentages here add up to around 45% (with some rounding). What are good ways to track CPU utilization over time so I can determine what is causing these spikes?
-
If you ever find a .trashes directory, that's from a Mac user wandering your network. MacOS will leave one of those behind in every directory it touches.




