


-
EDIT: I found that this issue only occurs when using Google Chrome, Brave, or Microsoft Edge. When I use Firefox, the error does not appear, and the API Service Status shows Running.
-
EDIT: I found that this issue only occurs when using Google Chrome, Brave, or Microsoft Edge. When I use Firefox, the error does not appear, and the API Service Status shows Running.
-
I have exactly the same problem here, and I'm pretty sure it started with version 7.3.x.
-
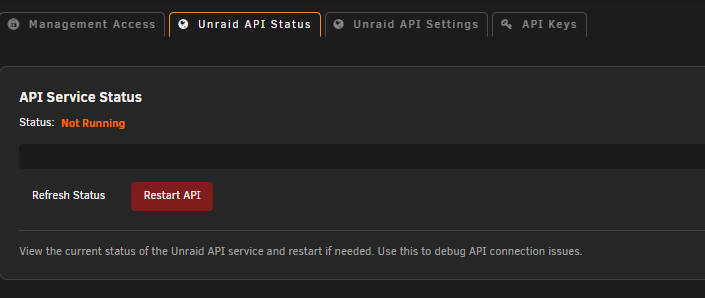
So, just to confirm, you don't see this error in the log when you go to Settings → Management Access? I also removed the Connect plugin and rebooted the server, but I still get the same error message: Jul 11 10:36:18 Tower webGUI: error: /plugins/dynamix.my.servers/include/unraid-api.php - wrong csrf_token Even with the Connect plugin removed, this error still appears whenever I open Settings → Management Access. My API service don't even running.
-
I still get this error when I go to Settings → Management Access. I don't have any problems signing in, and my server appears to be connected. I also removed the Connect plugin and restarted the server, but I still get the same error message when I open Settings → Management Access.
-
Hi, In your NVIDIA_VISIBLE_DEVICES you need to put your NVIDIA ID, found in the NVIDA setting, start with GPU-xxxxxx-xxxxx-xxx-xx-
-
Thank you very much @ich777 The 580.142 is back
-
In Beta 2, the v580.142 is gone, no more support for GTX 1080
-
Upgraded to version 7.3.0 Beta 1 and still the same warnings as it was on previous version. "[WARNING] [pool www] server reached max_children setting (50), consider raising it"
-
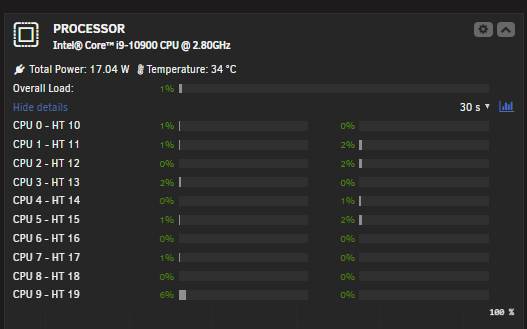
Hi, First of all, a huge thank you to everyone involved in this update, and for all the time and effort you put into making Unraid such an amazing system! The update went incredibly smoothly without any issues at all. I haven’t moved my boot drive from USB to a hard drive yet. I’ll give it a little more time, but so far everything is working perfectly. I really like the new feature that allows you to install the OS on a hard drive, so there’s no need for a USB anymore. 🙂 It’s also great that my motherboard is now supported for CPU temperature and power usage readings. This is something I’ve been missing for a long time, and it’s finally here! It might have something to do with the "System Temp" plugin, which for some reason has now started working with my motherboard. Thanks again for the fantastic work! 🙌
-
@ich777 Hi, Then please do not remove support for 580x drivers- I'm stuck with an GTX 1080Ti
-
I give up, I have turn off all my containers, the only one i'm running now is Plex. And still have this warning. I was gone for 1 hour now and just updated the DOCKER page. Nov 20 20:48:42 Galactica php-fpm[8509]: [WARNING] [pool www] server reached max_children setting (50), consider raising it
-
Hi, Been having this warning messages for a some time now. Not sure when and how. I can just stay on the MAIN page and wait few minutes and the is got the warning, wait again some minutes and again. Nov 20 07:14:38 Galactica php-fpm[8509]: [WARNING] [pool www] server reached max_children setting (50), consider raising it Nov 20 07:16:18 Galactica php-fpm[8509]: [WARNING] [pool www] server reached max_children setting (50), consider raising it Nov 20 07:23:54 Galactica php-fpm[8509]: [WARNING] [pool www] server reached max_children setting (50), consider raising it Nov 20 17:21:03 Galactica php-fpm[8509]: [WARNING] [pool www] server reached max_children setting (50), consider raising it Nov 20 17:25:32 Galactica php-fpm[8509]: [WARNING] [pool www] server reached max_children setting (50), consider raising it Nov 20 17:29:35 Galactica php-fpm[8509]: [WARNING] [pool www] server reached max_children setting (50), consider raising it Running this command to see how many php-fpm i'm running: root@Galactica:~# ps -eo size,pid,user,command --sort -size | awk '{ hr=$1/1024 ; printf("%13.2f Mb ",hr) } { for ( x=4 ; x<=NF ; x++ ) { printf("%s ",$x) } print "" }' | grep php-fpm 8.14 Mb php-fpm: pool www 7.67 Mb php-fpm: pool www 7.57 Mb php-fpm: pool www 7.47 Mb php-fpm: pool www 7.37 Mb php-fpm: pool www 7.26 Mb php-fpm: pool www 7.20 Mb php-fpm: pool www 6.27 Mb php-fpm: master process (/etc/php-fpm.conf) 0.69 Mb grep php-fpm Starting up only NGNIX, all good, then starting up Homepage. Still good, but when i enter Tautulli, see bellow. And same with UptimeKuma . Not sure why those two containers trigger so many php-fpm requests. But i'm not 100% . root@Galactica:~# ps -eo size,pid,user,command --sort -size | awk '{ hr=$1/1024 ; printf("%13.2f Mb ",hr) } { for ( x=4 ; x<=NF ; x++ ) { printf("%s ",$x) } print "" }' | grep php-fpm 7.83 Mb php-fpm: pool www 7.50 Mb php-fpm: pool www 7.49 Mb php-fpm: pool www 7.48 Mb php-fpm: pool www 7.43 Mb php-fpm: pool www 7.39 Mb php-fpm: pool www 7.27 Mb php-fpm: pool www 7.20 Mb php-fpm: pool www 7.19 Mb php-fpm: pool www 7.19 Mb php-fpm: pool www 6.46 Mb php-fpm: pool www 6.46 Mb php-fpm: pool www 6.46 Mb php-fpm: pool www 6.39 Mb php-fpm: pool www 6.39 Mb php-fpm: pool www 6.39 Mb php-fpm: pool www 6.39 Mb php-fpm: pool www 6.39 Mb php-fpm: pool www 6.39 Mb php-fpm: pool www 6.39 Mb php-fpm: pool www 6.39 Mb php-fpm: pool www 6.39 Mb php-fpm: pool www 6.39 Mb php-fpm: pool www 6.39 Mb php-fpm: pool www 6.39 Mb php-fpm: pool www 6.39 Mb php-fpm: pool www 6.39 Mb php-fpm: pool www 6.39 Mb php-fpm: pool www 6.39 Mb php-fpm: pool www 6.39 Mb php-fpm: pool www 6.39 Mb php-fpm: pool www 6.39 Mb php-fpm: pool www 6.39 Mb php-fpm: pool www 6.39 Mb php-fpm: pool www 6.39 Mb php-fpm: pool www 6.39 Mb php-fpm: pool www 6.39 Mb php-fpm: pool www 6.39 Mb php-fpm: pool www 6.39 Mb php-fpm: pool www 6.39 Mb php-fpm: pool www 6.39 Mb php-fpm: pool www 6.39 Mb php-fpm: pool www 6.39 Mb php-fpm: pool www 6.39 Mb php-fpm: pool www 6.39 Mb php-fpm: pool www 6.39 Mb php-fpm: pool www 6.39 Mb php-fpm: pool www 6.39 Mb php-fpm: pool www 6.39 Mb php-fpm: pool www 6.39 Mb php-fpm: pool www 6.27 Mb php-fpm: master process (/etc/php-fpm.conf) 0.69 Mb grep php-fpm Nov 20 17:52:05 Galactica php-fpm[8509]: [WARNING] [pool www] server reached max_children setting (50), consider raising it
-
Still same problem with the latest unraid v. 7.2.1. Script by @bmartino1 https://forums.unraid.net/topic/194245-pool-www-server-reached-max_children-setting-50-consider-raising-it/#comment-1585016 I haven't tested it.
-
I did try that, but after an reboot it fall back to default. You may need a script or something to make your changes after a reboot.
View in the app
A better way to browse. Learn more.


