


dopeytree
Members
-
Joined
-
Last visited
Everything posted by dopeytree
-
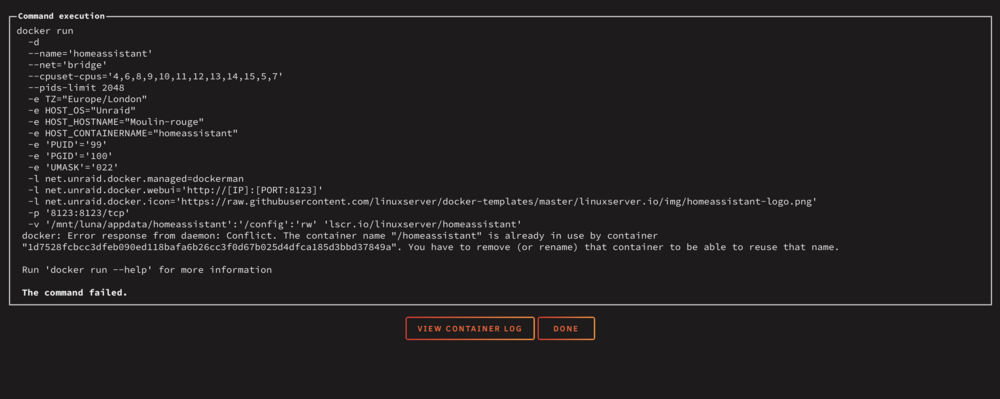
Updated fine but somethings happened to homeassistant container. It's still there but not able to run it & won't let me re-add it. How can I get it back working easily? Screenshot is what happens if I click add container & choose homeassistant template. Appdata folder is all still there...
-
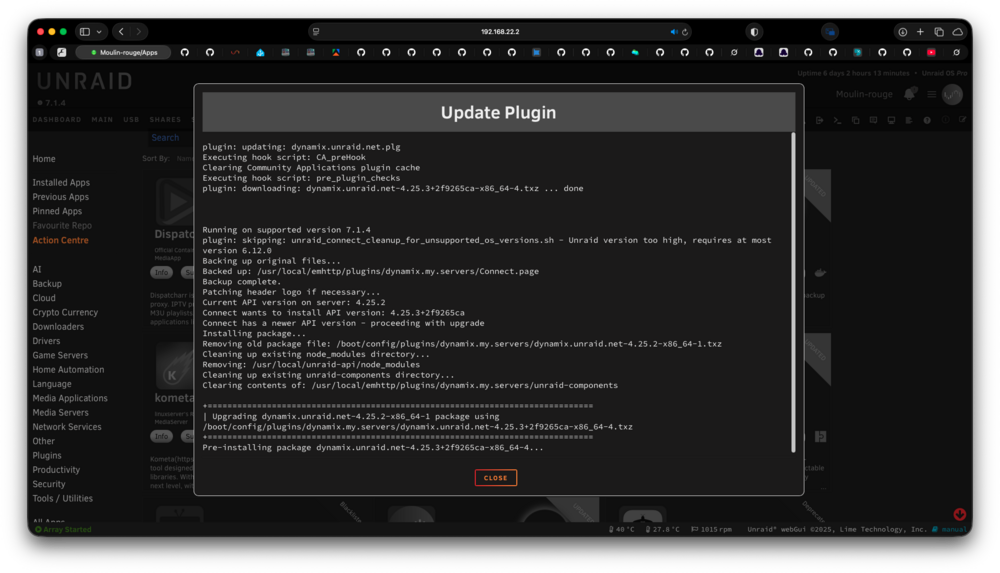
Had my interest die halfway through a plugin update. Leaving in a state of limbo. Should I just manually remove the plugin file on the usb stick & reinstall?

-
Thanks team - Upgraded my 2gb usb stick to a Swissbit 16GB stick easily & then updated to 7.2.3 Smooth like butter on pancakes. 🥞🍻
-
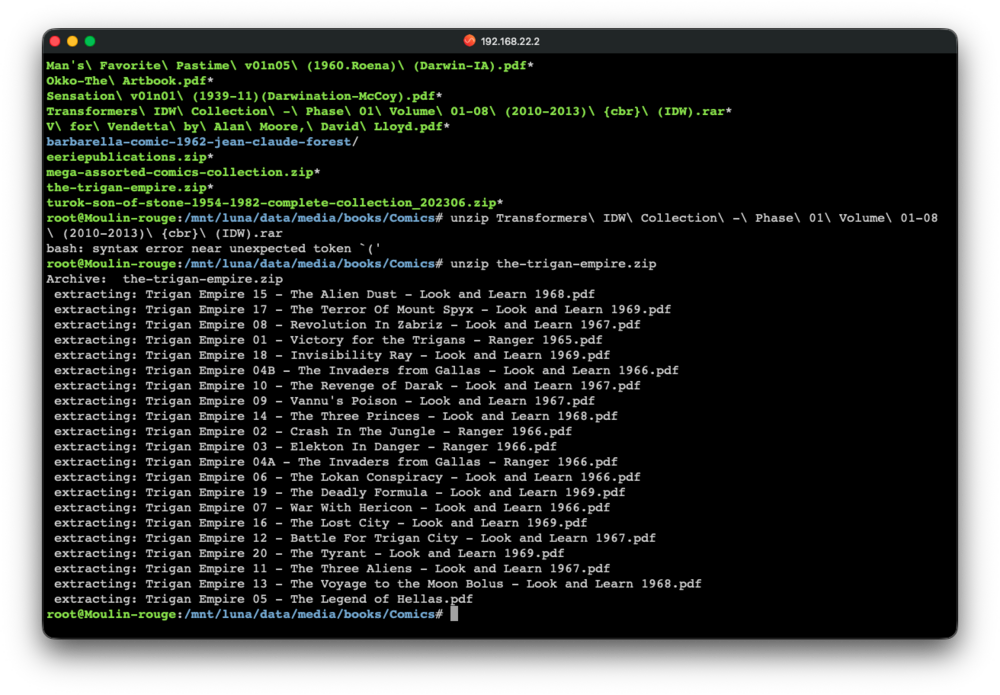
Thanks yeah the gui sucks butt (slow manual browsing etc) but maybe the undying 7zip package is good. Much easier to terminal to the folder and type extract. Got grok it help me write these. Insert into go file for persistency. ``` # extract ZIP/RAR to auto-named subfolder, move to .tmp_zip/, log to extract_log.txt grep -q "extract() {" /etc/profile || echo "extract() { local ext=\\\"\\\${1##*.}\\\"; local folder=\\\"\\\${1%.*}\\\"; local log_file=\\\"extract_log.txt\\\"; local timestamp=\\\$(date \\\'+%Y-%m-%d %H:%M:%S\\\'); local moved=0; echo \\\"\\\$timestamp: Starting extract: \\\$1\\\" >> \\\"\\\$log_file\\\"; if [[ \\\"\\\$ext\\\" == \\\"zip\\\" ]]; then if unzip -o \\\"\\\$1\\\" -d \\\"\\\$folder/\\\"; then moved=1; echo \\\"\\\$timestamp: SUCCESS - Extracted \\\$1 to \\\$folder/ and moved to .tmp_zip/\\\" >> \\\"\\\$log_file\\\"; else echo \\\"\\\$timestamp: ERROR - Failed to extract \\\$1 (ZIP)\\\" >> \\\"\\\$log_file\\\"; return 1; fi; elif [[ \\\"\\\$ext\\\" == \\\"rar\\\" ]]; then if unrar x -o+ \\\"\\\$1\\\" \\\"\\\$folder/\\\"; then moved=1; echo \\\"\\\$timestamp: SUCCESS - Extracted \\\$1 to \\\$folder/ and moved to .tmp_zip/\\\" >> \\\"\\\$log_file\\\"; else echo \\\"\\\$timestamp: ERROR - Failed to extract \\\$1 (RAR)\\\" >> \\\"\\\$log_file\\\"; return 1; fi; else echo \\\"\\\$timestamp: SKIP - Unsupported format for \\\$1 (\\\$ext)\\\" >> \\\"\\\$log_file\\\"; return 1; fi; if [[ \\\$moved -eq 1 ]]; then mkdir -p .tmp_zip; mv \\\"\\\$1\\\" .tmp_zip/; fi; }" >> /etc/profile ``` ``` # batch extract all ZIP/RAR recursively (newest first), exclude .tmp_zip/, log to extract_log.txt grep -q "batch_extract() {" /etc/profile || echo "batch_extract() { local log_file=\\\"extract_log.txt\\\"; local timestamp=\\\$(date \\\'+%Y-%m-%d %H:%M:%S\\\'); local count=0; echo \\\"\\\$timestamp: BATCH START - Recursive extract of all ZIP/RAR (excluding .tmp_zip/)\\\" >> \\\"\\\$log_file\\\"; while IFS= read -r -d \\\"\\\" f; do echo \\\"Processing: \\\$f\\\"; if extract \\\"\\\$f\\\"; then ((count++)); fi; done < <(find . -type f \\$$ -name \\\"*\\\\.zip\\\" -o -name \\\"*\\\\.rar\\\" \\ $$ ! -path \\\"*/.tmp_zip/*\\\" -printf \\\'%T@ %p\\\\n\\\' | sort -nr | cut -d\\\' \\\' -f2- | tr \\\'\\\\n\\\' \\\'\\\\0\\\'); echo \\\"\\\$timestamp: BATCH END - Processed \\\$count archives total\\\" >> \\\"\\\$log_file\\\"; echo \\\"Batch complete! Processed \\\$count archives across subfolders. Check .tmp_zip/ folders for originals and extract_log.txt for details.\\\"; }" >> /etc/profile ```
-
Is it possible to fix code quoting on the forums to use the same as normal markdown uses? e.g ``` Code ``` should create a code box etc I find when I manually press the code block button it automatically puts the entire last paragraph inside and then its a battle to fix it
-
Add a button / right click command in the File Manager to easily extract .zip etc in situ. Go alias shortcut # extract ZIP to auto-named subfolder echo "extract() { unzip \\\"\\\$1\\\" -d \\\"\\\${1%.*}/\\\"; }" >> /etc/profile command ``` extract() { unzip "$1" -d "${1%.*}/" } ``` command in folder ``` unzip "filename.zip" -d "${filename.zip%.*}/" ``` command not in folder ``` unzip "/mnt/user/downloads/movie.zip" -d "$(dirname /mnt/user/downloads/movie.zip)/${movie.zip##*/%.*}/" ```
-
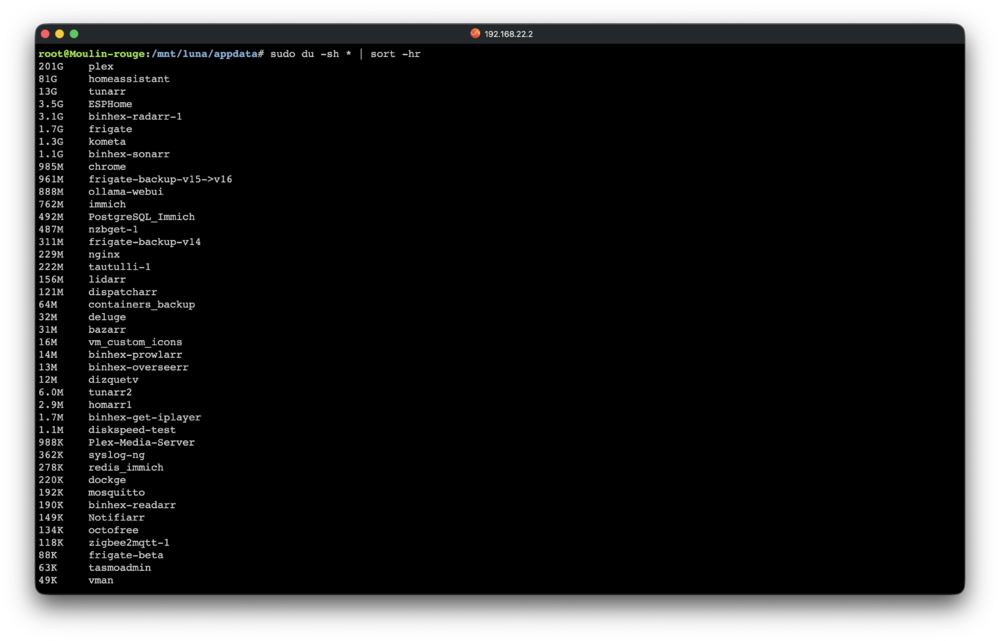
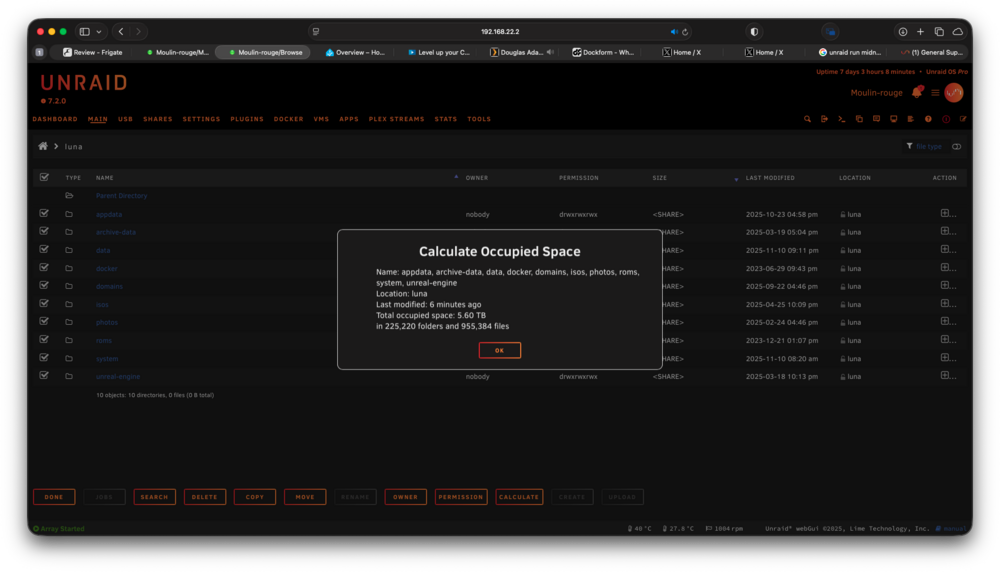
cd /mnt/luna/appdata/ sudo ls -laMust be some bug as not showing so large in terminal. I did notice MC (midnight commander) does report the same large 5.6TB size though so must be a big somewhere. s
-
What would a terminal command be to check folder sizes? It seems to be something in /appdata I tried below but it says no access to */ Also LS doesn't show anything du -sh */ | sort -hr
-
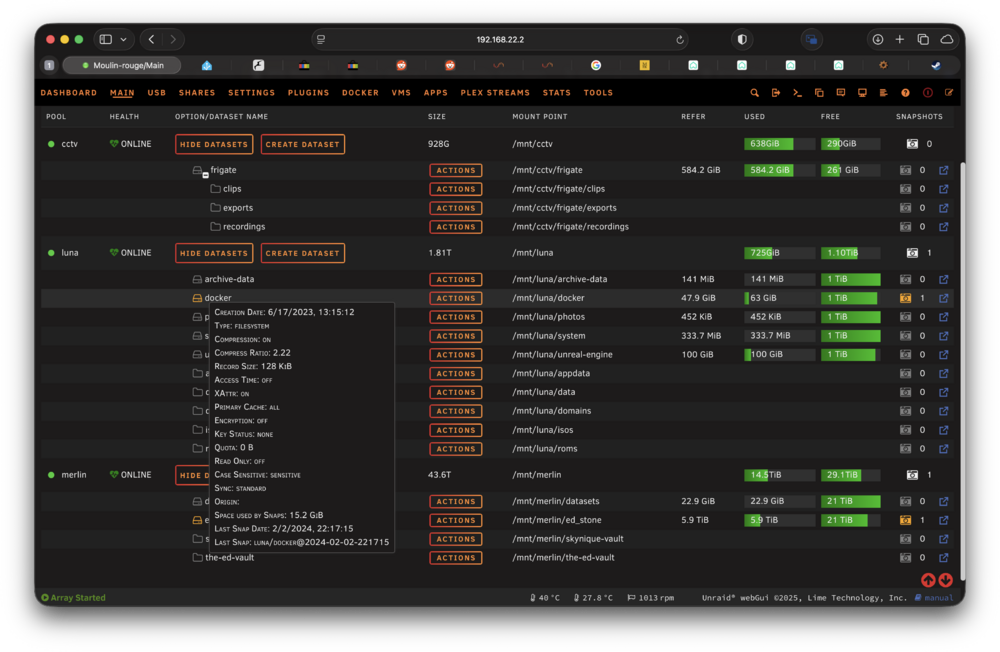
Its fairly minor was just surprised. Diags attached Don't think there's snapshots (beyond a test) as never quite got it setup but here's the screenshot: ' moulin-rouge-diagnostics-20251111-1504.zip
-
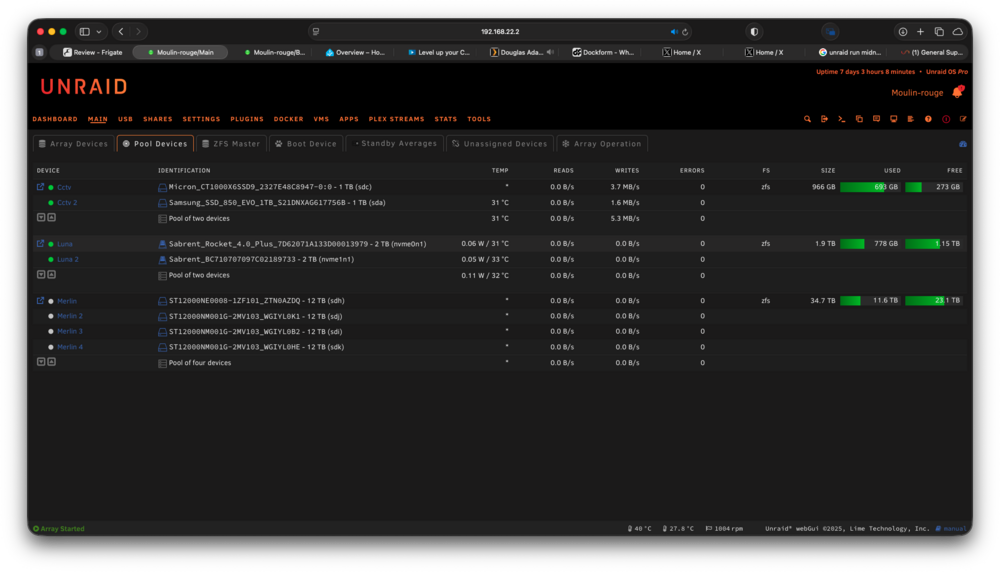
File Manager says 5.6TB used but drive is only 2TB? (Luna SSD 2TB mirrored) unraid 7.2
-
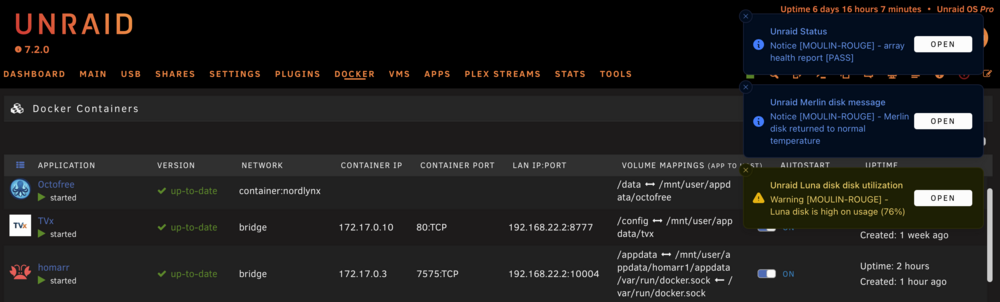
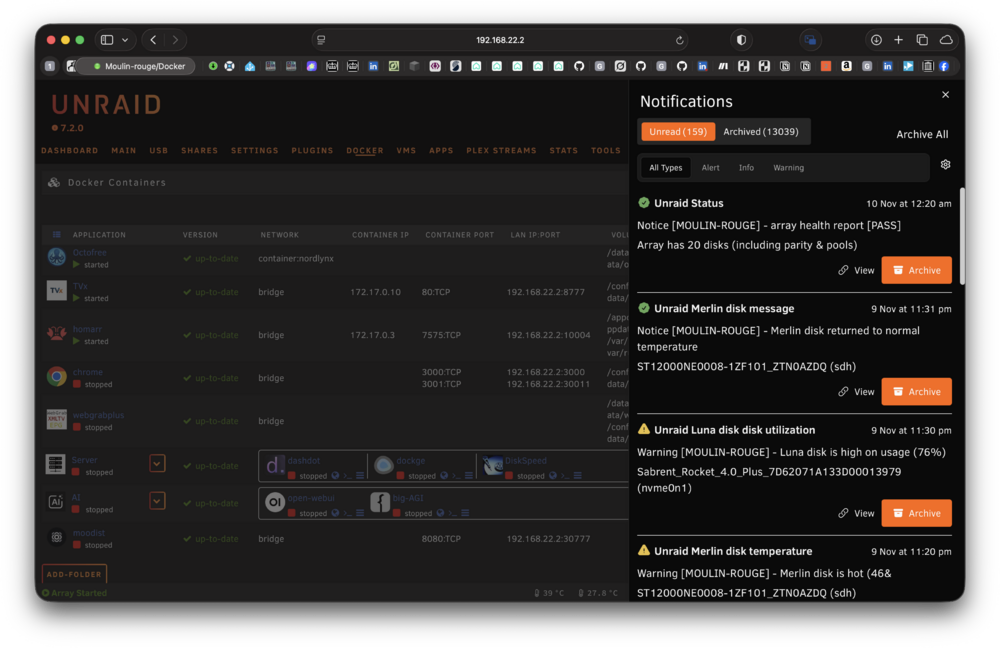
Is it possible to get more control over the connect plugins notifications so colours etc Have the same colours used for POP Ups as in the Long List? I personally would like the sizing to the same meaning if notifications in the Long List were displayed the same as the Pop Ups then more would be visible on screen at once. Perhaps in stead of a view / archive button we have a 'Open' vs 'X' button as this takes up less space etc. Icons should be the same across both POP Ups & Long List etc
-
In design less is more. At the moment the line not adjusting to the length of the characters is more disturbing. Could have the line be the same width and align to the left of the text. Also needs a 5px gap above the line or something its too close to the words. Other options include just changing the colour of the active nav point or fading etc. All will probably be possible with new theme engine? Perhaps swap to icons like homeassistant.

-
Minor but in future I'd probably be inclined to change the highlighted underline nav bar to a . as a dot looks better when the length of nav bar titles changes length?
-
🏝️🍻
-
Worked a treat Thanks team
-
Could you point me to the manual install process? 🍻
-
Anyone know how I can upgrade install it on my 2GB usb stick? (Its 2gb because its a industrial stick) The OS runs in RAM so surely it should be able to copy the current usb key data to a drive on the array or cache then create the new usb stick in ram and write back to the USB stick? Current OS seems to use about 700 MB then plugins use another 300-500 MB. it wants 900 MB free on USB stick but there's 25+GB free RAM to use.
-
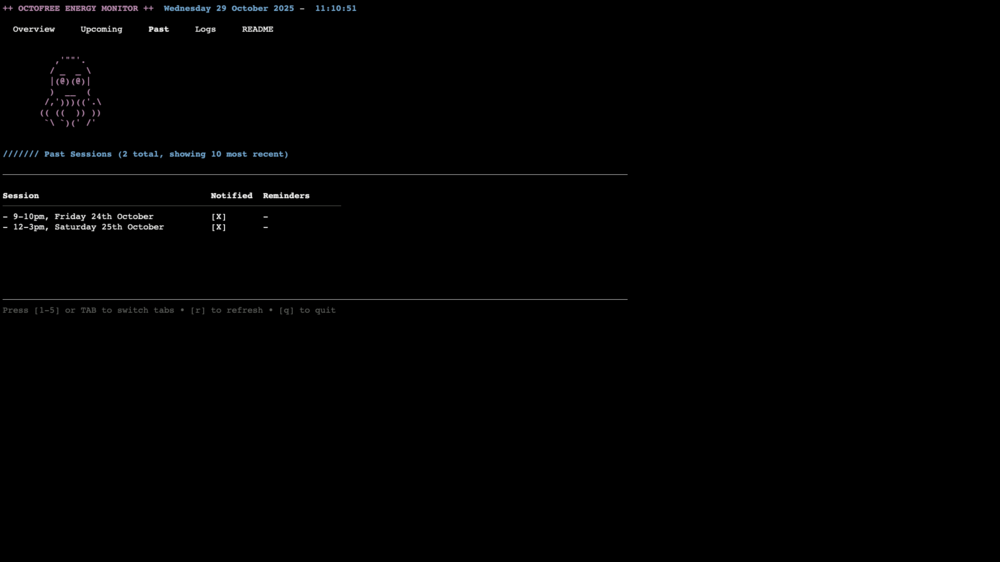
Is it possible to either takeover container console or show a text menu? Have created a TUI for my scripts which run in a container 'octofree' wondering best way to make it easy to launch or at least display 'type: octofree-monitor' Either need to stream the whole thing over a terminal emulator with a web server or find a way to have it open the TUI when pressing the console button in unraid gui. Anyideas appreciated.
-
there may an issue with using ghcr.io repos? I noticed even when you use them such as ghcr.io/chrisbenincasa/tunarr it still adds https://dockerhub infront sometimes but maybe thats a template authoring mode bug, but doesn't seem to affect function except it's saying this has been blacklisted because its not on docker hub when the url is GHCR.io (GitHub repos) perhaps this ties into a wider community app issue? not really sure If possible would like to see DATE & TIME of detection too.

-
does this show up when for example it shows code during container updates etc?
-
Version: 7.1.4 Docker [template authoring mode] is [active:yes/no] is not displayed when it is active and then docker is re-enabled.
-
Having issues with XML authoring i.e its not showing up when = set to true. Have cobbled this together customs. is it ok? <?xml version="1.0"?> <Container version="2" xmlns:xsi="http://www.w3.org/2001/XMLSchema-instance" xsi:schemaLocation="https://raw.githubusercontent.com/nwithan8/unraid_templates/main/template_schema.xsd template_schema.xsd"> <Name>TVx</Name> <Repository>ghcr.io/dopeytree/tvx:latestx</Repository> <Registry>ghcr.io/dopeytree/tvx</Registry> <Branch> <Tag>latest</Tag> <TagDescription>Latest stable release</TagDescription> </Branch> <Network>bridge</Network> <WebUI>http://[IP]:[PORT:8777]/</WebUI> <Privileged>false</Privileged> <Support>https://forums.unraid.net/topic/194221-support-dopeytree-docker-templates/</Support> <Project>https://github.com/dopeytree/TVx</Project> <Overview> TVx — the warmth of modern nostalgia
 
 This is the way - television you remember feeling: present, unhurried, analog. 
 
 A vintage experience IPTV + EPG viewer for Tunarr (Plex/Jellyfin) playlists & XMLTV guides. Built for channel surfing, not catalog anxiety. Anti‑algorithm. Pro‑moment. Vibing. 
 
 FEATURES: 
 Instant channel surfing with arrow keys 
 CRT warmth effects (curvature, scanlines, vignette) 
 Full TV guide with poster artwork 
 Multiple theater modes 
 Smart channel naming with icons 
 Full keyboard shortcuts 
 </Overview> <Beta>False</Beta> <Category>MediaApp:Video Productivity: Tools: Other: Status:Stable</Category> <ExtraSearchTerms>iptv television tunarr dizquetv crt vintage retro tv streaming epg m3u xmltv channels plex jellyfin nostalgic analog vhs vignette scanlines</ExtraSearchTerms> <Icon>https://raw.githubusercontent.com/dopeytree/TVx/main/public/logo.png</Icon> <TemplateURL>https://raw.githubusercontent.com/dopeytree/Unraid-templates/main/templates/tvx.xml</TemplateURL> <Screenshot>https://raw.githubusercontent.com/dopeytree/TVx/main/public/screenshot-1.png</Screenshot> <Screenshot>https://raw.githubusercontent.com/dopeytree/TVx/main/public/screenshot-2.png</Screenshot> <Screenshot>https://raw.githubusercontent.com/dopeytree/TVx/main/public/screenshot-3.png</Screenshot> <Screenshot>https://raw.githubusercontent.com/dopeytree/TVx/main/public/screenshot-4.png</Screenshot> <Screenshot>https://raw.githubusercontent.com/dopeytree/TVx/main/public/screenshot-5.png</Screenshot> <Maintainer> <WebPage>https://github.com/dopeytree</WebPage> </Maintainer> <Changes> ### 2025-10-21 - Funciontal & docs updates </Changes> <Requires> *** Requires Tunarr or Dizquetv + Plex or Jellyfin media server. *** </Requires> <Config Name="WebUI Port" Default="8777" Mode="tcp" Description="Host port for accessing the TVx web interface" Type="Port" Display="advanced" Required="true" Mask="false">8777</Config> <Config Name="M3U URL" Target="VITE_M3U_URL" Default="http://your-tunarr-ip-address:8000/api/channels.m3u" Description="Replace 'your-tunarr-ip-address' with your actual Tunarr server IP:Port or other IPTV provider' with your actual Tunarr server IP." Type="Variable" Display="always" Required="true" Mask="false">http://your-tunarr-ip-address:8000/api/channels.m3u</Config> <Config Name="XMLTV URL" Target="VITE_XMLTV_URL" Default="http://your-tunarr-ip-address:8000/api/xmltv.xml" Description="Replace 'your-tunarr-ip-address' with your actual Tunarr server IP:Port or other IPTV EPG provider" Type="Variable" Display="always" Required="true" Mask="false">http://your-tunarr-ip-address:8000/api/xmltv.xml</Config> <Config Name="Appdata" Target="/config" Default="/mnt/user/appdata/tvx" Mode="rw" Description="Path for persistent storage of settings, configuration files, and logs (tvx.log). Logs are automatically rotated and saved here." Type="Path" Display="advanced" Required="true" Mask="false">/mnt/user/appdata/tvx</Config> <Config Name="Timezone" Target="TZ" Default="Europe/London" Description="Container timezone for proper EPG time display. Examples: America/New_York, Europe/London, Asia/Tokyo, etc" Type="Variable" Display="advanced" Required="true" Mask="false">Europe/London</Config> </Container>
-
Just wondered what the future plans are for the API? Will it allow all commands to enable a new webgui frontend or is it just for managing/monitoring? Ta
-
feed seems updated but not my repo. does it matter what is in the readme? wonder if links were confusing it have now removed. https://github.com/dopeytree/Unraid-templates
-
I've pushed some updates to my unraid_templates repo but not seeing this reflected in the App Store? Am I doing something wrong? I added a ca_profile.xml etc & tidied up some of the app.xml


