





Everything posted by Gico
-
+1 here: Any instructions how to install storcli?
-
Well it's back, without any app running on that PC. The only cause I can think of is that I run Pihole docker on the server, and this PC connects to it, although the docker is running and all seems fine. I reset this PC TCPIP configuration not to use Pihole, in order to try to identify this issue.
-
Thanks. I restarted that PC and these errors are gone for now.
-
I have a lot of these messages in the syslog. No "old" (before upgrade) / other browser sessions exist to the Unraid server. Any ideas? Mar 10 12:32:06 Juno nginx: 2021/03/10 12:32:06 [error] 9704#9704: *225050 limiting requests, excess: 20.104 by zone "authlimit", client: 192.168.168.10, server: , request: "PROPFIND /login HTTP/1.1", host: "junol" Mar 10 12:32:06 Juno nginx: 2021/03/10 12:32:06 [error] 9704#9704: *225056 limiting requests, excess: 20.829 by zone "authlimit", client: 192.168.168.10, server: , request: "PROPFIND /login HTTP/1.1", host: "junol" Mar 10 12:32:07 Juno nginx: 2021/03/10 12:32:07 [error] 9704#9704: *225058 limiting requests, excess: 20.731 by zone "authlimit", client: 192.168.168.10, server: , request: "PROPFIND /login HTTP/1.1", host: "junol" Mar 10 12:32:07 Juno nginx: 2021/03/10 12:32:07 [error] 9704#9704: *225068 limiting requests, excess: 20.582 by zone "authlimit", client: 192.168.168.10, server: , request: "PROPFIND /login HTTP/1.1", host: "junol" Mar 10 12:32:07 Juno nginx: 2021/03/10 12:32:07 [error] 9704#9704: *225071 limiting requests, excess: 20.456 by zone "authlimit", client: 192.168.168.10, server: , request: "PROPFIND /login HTTP/1.1", host: "junol" Mar 10 12:32:07 Juno nginx: 2021/03/10 12:32:07 [error] 9704#9704: *225074 limiting requests, excess: 20.360 by zone "authlimit", client: 192.168.168.10, server: , request: "PROPFIND /login HTTP/1.1", host: "junol" Mar 10 12:32:08 Juno nginx: 2021/03/10 12:32:08 [error] 9704#9704: *225076 limiting requests, excess: 20.207 by zone "authlimit", client: 192.168.168.10, server: , request: "PROPFIND /login HTTP/1.1", host: "junol" Mar 10 12:32:08 Juno nginx: 2021/03/10 12:32:08 [error] 9704#9704: *225086 limiting requests, excess: 20.076 by zone "authlimit", client: 192.168.168.10, server: , request: "PROPFIND /login HTTP/1.1", host: "junol" Mar 10 12:32:08 Juno nginx: 2021/03/10 12:32:08 [error] 9704#9704: *225092 limiting requests, excess: 20.815 by zone "authlimit", client: 192.168.168.10, server: , request: "PROPFIND /login HTTP/1.1", host: "junol" Mar 10 12:32:09 Juno nginx: 2021/03/10 12:32:09 [error] 9704#9704: *225094 limiting requests, excess: 20.682 by zone "authlimit", client: 192.168.168.10, server: , request: "PROPFIND /login HTTP/1.1", host: "junol" Mar 10 12:32:09 Juno nginx: 2021/03/10 12:32:09 [error] 9704#9704: *225096 limiting requests, excess: 20.583 by zone "authlimit", client: 192.168.168.10, server: , request: "PROPFIND /login HTTP/1.1", host: "junol" Mar 10 12:32:09 Juno nginx: 2021/03/10 12:32:09 [error] 9704#9704: *225100 limiting requests, excess: 20.428 by zone "authlimit", client: 192.168.168.10, server: , request: "PROPFIND /login HTTP/1.1", host: "junol" Mar 10 12:32:09 Juno nginx: 2021/03/10 12:32:09 [error] 9704#9704: *225103 limiting requests, excess: 20.296 by zone "authlimit", client: 192.168.168.10, server: , request: "PROPFIND /login HTTP/1.1", host: "junol" Mar 10 12:32:10 Juno nginx: 2021/03/10 12:32:10 [error] 9704#9704: *225105 limiting requests, excess: 20.200 by zone "authlimit", client: 192.168.168.10, server: , request: "PROPFIND /login HTTP/1.1", host: "junol"
-
Thanks. I hoped that plugins would check if disk is mounted before addressing it.
-
Thanks. For Preclear I will ask in Preclear forum, but what about UD and unmounted disks? Following an example with sdp and sdq which are not mounted. Jan 12 10:56:33 Juno unassigned.devices: Error: shell_exec(/usr/sbin/hdparm -C /dev/sdp 2>/dev/null | /bin/grep -c standby) took longer than 10s! Jan 12 10:57:20 Juno unassigned.devices: Error: shell_exec(/usr/sbin/hdparm -C /dev/sdq 2>/dev/null | /bin/grep -c standby) took longer than 10s! Jan 12 10:57:20 Juno unassigned.devices: Error: shell_exec(/usr/sbin/hdparm -C /dev/sdq 2>/dev/null | /bin/grep -c standby) took longer than 10s! Jan 12 10:57:20 Juno unassigned.devices: Error: shell_exec(/usr/sbin/hdparm -C /dev/sdq 2>/dev/null | /bin/grep -c standby) took longer than 10s! Jan 12 10:57:20 Juno unassigned.devices: Error: shell_exec(/usr/sbin/hdparm -C /dev/sdq 2>/dev/null | /bin/grep -c standby) took longer than 10s!
-
How is it that all these disks has an issue around on the same time? Seems there is another root cause for these errors at that time. All these disks sdq, sdq, sdz, sdae etc. are backup drives that 95% of the time are not mounted, and most of them are quite new and have not been used other than being backup drives. Anyway please look at January 11th issues when all these drives were not mounted. Is there a reason for any plugin to access an unmounted drive? Yes disk 9 has read errors, but SMART report seems OK other than stable 13 UDMA CRC error count. I will continue to monitor this drive.
-
Yes I do. Attached. juno-diagnostics-20210111-1659.zip
-
I have a repeating error, multiple times a day: Jan 11 16:12:01 Juno unassigned.devices: Error: shell_exec(/usr/sbin/hdparm -C /dev/sdp 2>/dev/null | /bin/grep -c standby) took longer than 10s! It happens very frequently to this device (sdq) and to sdp, which are both unmounted, and less frequently to others.
-
What about Unassigned Devices? Any limit on their number?
-
Thanks. That narrows the issue to the docker daemon running in debug mode. I'll create a thread at the Bug Report after upgrading to v6.8 and checking that the problem continues. Hopefully this is not considered as crosspost.
-
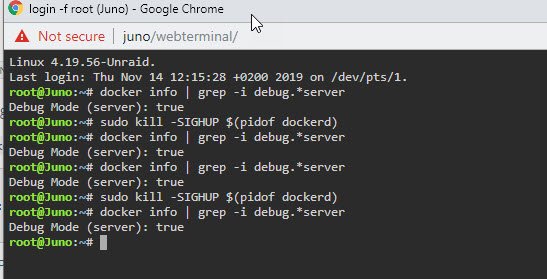
After deleting and recreating the docker image, the docker service would not start. I had to restart the server and that solved this issue. However even without any container, the docker is in debug mode: root@Juno:~# docker info | grep -i debug.*server Debug Mode (server): true Can anyone check his docker service whether he gets Debug Mode true or false?
-
OK, sorry for that.
-
I added some information and hoped that this issue will have more attention in the General Support forum after none was found in the Docker Engine forum. My server didn't have daemon.json. I didn't have any other solution so I tried to create this file with the debug parameter. Diagnostics attached. juno-diagnostics-20191211-1303.zip
-
This is an on going issue on my server for quite some time. Already posted it here and here in the Docker Engine forum, but there was only little response and it's not solved yet. My docker log keeps filling up with following debug messages every second or two. time="2019-12-11T07:54:28.125897846+02:00" level=debug msg="Client context cancelled, stop sending events" time="2019-12-11T07:54:28.163582755+02:00" level=debug msg="Calling GET /_ping" time="2019-12-11T07:54:28.164229066+02:00" level=debug msg="Calling GET /v1.39/version" time="2019-12-11T07:54:28.165000240+02:00" level=debug msg="Calling GET /v1.39/events?filters=%7B%22type%22%3A%7B%22container%22%3Atrue%7D%7D" time="2019-12-11T07:54:28.165421501+02:00" level=debug msg="Calling GET /v1.39/containers/json?limit=0" time="2019-12-11T07:54:28.175312376+02:00" level=debug msg="Calling GET /v1.39/containers/f15da2ef0722/stats?stream=0" time="2019-12-11T07:54:28.175719189+02:00" level=debug msg="Calling GET /v1.39/containers/afebf568de86/stats?stream=0" time="2019-12-11T07:54:28.177248098+02:00" level=debug msg="Calling GET /v1.39/containers/36b6cc31a520/stats?stream=0" time="2019-12-11T07:54:28.177301408+02:00" level=debug msg="Calling GET /v1.39/containers/d6b5b1f59817/stats?stream=0" time="2019-12-11T07:54:28.177403166+02:00" level=debug msg="Calling GET /v1.39/containers/d5f3d5caa135/stats?stream=0" time="2019-12-11T07:54:28.177499741+02:00" level=debug msg="Calling GET /v1.39/containers/5888248d4de5/stats?stream=0" time="2019-12-11T07:54:28.177694344+02:00" level=debug msg="Calling GET /v1.39/containers/50e7e412aba9/stats?stream=0" time="2019-12-11T07:54:30.166188765+02:00" level=debug msg="Client context cancelled, stop sending events" time="2019-12-11T07:54:30.199804739+02:00" level=debug msg="Calling GET /_ping" time="2019-12-11T07:54:30.200733367+02:00" level=debug msg="Calling GET /v1.39/version" time="2019-12-11T07:54:30.201967325+02:00" level=debug msg="Calling GET /v1.39/events?filters=%7B%22type%22%3A%7B%22container%22%3Atrue%7D%7D" time="2019-12-11T07:54:30.202688682+02:00" level=debug msg="Calling GET /v1.39/containers/json?limit=0" time="2019-12-11T07:54:30.213254645+02:00" level=debug msg="Calling GET /v1.39/containers/f15da2ef0722/stats?stream=0" time="2019-12-11T07:54:30.213381857+02:00" level=debug msg="Calling GET /v1.39/containers/afebf568de86/stats?stream=0" time="2019-12-11T07:54:30.214664222+02:00" level=debug msg="Calling GET /v1.39/containers/36b6cc31a520/stats?stream=0" time="2019-12-11T07:54:30.214754288+02:00" level=debug msg="Calling GET /v1.39/containers/50e7e412aba9/stats?stream=0" time="2019-12-11T07:54:30.214858638+02:00" level=debug msg="Calling GET /v1.39/containers/d6b5b1f59817/stats?stream=0" time="2019-12-11T07:54:30.214910970+02:00" level=debug msg="Calling GET /v1.39/containers/d5f3d5caa135/stats?stream=0" time="2019-12-11T07:54:30.214937826+02:00" level=debug msg="Calling GET /v1.39/containers/5888248d4de5/stats?stream=0" time="2019-12-11T07:54:32.202934933+02:00" level=debug msg="Client context cancelled, stop sending events" time="2019-12-11T07:54:32.248469161+02:00" level=debug msg="Calling GET /_ping" time="2019-12-11T07:54:32.249427812+02:00" level=debug msg="Calling GET /v1.39/version" time="2019-12-11T07:54:32.250282086+02:00" level=debug msg="Calling GET /v1.39/events?filters=%7B%22type%22%3A%7B%22container%22%3Atrue%7D%7D" time="2019-12-11T07:54:32.251172942+02:00" level=debug msg="Calling GET /v1.39/containers/json?limit=0" time="2019-12-11T07:54:32.259211926+02:00" level=debug msg="Calling GET /v1.39/containers/d6b5b1f59817/stats?stream=0" time="2019-12-11T07:54:32.261015242+02:00" level=debug msg="Calling GET /v1.39/containers/f15da2ef0722/stats?stream=0" time="2019-12-11T07:54:32.261227812+02:00" level=debug msg="Calling GET /v1.39/containers/36b6cc31a520/stats?stream=0" time="2019-12-11T07:54:32.261383225+02:00" level=debug msg="Calling GET /v1.39/containers/afebf568de86/stats?stream=0" time="2019-12-11T07:54:32.261488331+02:00" level=debug msg="Calling GET /v1.39/containers/d5f3d5caa135/stats?stream=0" time="2019-12-11T07:54:32.261707089+02:00" level=debug msg="Calling GET /v1.39/containers/5888248d4de5/stats?stream=0" time="2019-12-11T07:54:32.262745556+02:00" level=debug msg="Calling GET /v1.39/containers/50e7e412aba9/stats?stream=0" The docker engine is indeed in debug mode: root@Juno:~# docker info | grep -i debug.*server Debug Mode (server): true I guess it is caused by the "-debug" added to the end of the containerd-shim commands, but where is this come from? root@Juno:~# ps -ef | grep docker root 3581 1 0 10:36 ? 00:00:00 /bin/bash /usr/local/emhttp/plugins/dynamix.docker.manager/scripts/docker_load root 4865 23132 0 10:36 ? 00:00:00 /usr/bin/docker-proxy -proto tcp -host-ip 0.0.0.0 -host-port 3306 -container-ip 172.17.0.3 -container-port 3306 root 6053 23132 0 10:37 ? 00:00:00 /usr/bin/docker-proxy -proto tcp -host-ip 0.0.0.0 -host-port 7910 -container-ip 172.17.0.4 -container-port 5900 root 6068 23132 0 10:37 ? 00:00:00 /usr/bin/docker-proxy -proto tcp -host-ip 0.0.0.0 -host-port 7810 -container-ip 172.17.0.4 -container-port 5800 root 6626 23154 0 10:37 ? 00:00:00 containerd-shim -namespace moby -workdir /var/lib/docker/containerd/daemon/io.containerd.runtime.v1.linux/moby/d5f3d5caa1350d062f2517202deee495c2546c6ae90cb0a2be0e8b365d1eb9ec -address /var/run/docker/containerd/containerd.sock -containerd-binary /usr/bin/containerd -runtime-root /var/run/docker/runtime-runc -debug root 8640 23154 0 10:37 ? 00:00:00 containerd-shim -namespace moby -workdir /var/lib/docker/containerd/daemon/io.containerd.runtime.v1.linux/moby/36b6cc31a520a851372059264e45e568ff8bbe8676f1a33ec2f18032e2a82d90 -address /var/run/docker/containerd/containerd.sock -containerd-binary /usr/bin/containerd -runtime-root /var/run/docker/runtime-runc -debug root 9010 23132 0 10:37 ? 00:00:00 /usr/bin/docker-proxy -proto tcp -host-ip 0.0.0.0 -host-port 6080 -container-ip 172.17.0.5 -container-port 6080 root 10159 23154 0 10:37 ? 00:00:00 containerd-shim -namespace moby -workdir /var/lib/docker/containerd/daemon/io.containerd.runtime.v1.linux/moby/5888248d4de57eed593cdf2ed5b5f98fc9d14523a0e0435753d591cc47eae454 -address /var/run/docker/containerd/containerd.sock -containerd-binary /usr/bin/containerd -runtime-root /var/run/docker/runtime-runc -debug root 10485 23132 0 10:37 ? 00:00:00 /usr/bin/docker-proxy -proto tcp -host-ip 0.0.0.0 -host-port 8181 -container-ip 172.17.0.6 -container-port 8181 root 12035 23154 0 10:37 ? 00:00:00 containerd-shim -namespace moby -workdir /var/lib/docker/containerd/daemon/io.containerd.runtime.v1.linux/moby/f15da2ef0722efd5a742a2f2d0be94748e4543660ac83950383797eba2de5b92 -address /var/run/docker/containerd/containerd.sock -containerd-binary /usr/bin/containerd -runtime-root /var/run/docker/runtime-runc -debug root 13312 23154 0 10:37 ? 00:00:00 containerd-shim -namespace moby -workdir /var/lib/docker/containerd/daemon/io.containerd.runtime.v1.linux/moby/afebf568de86ad2b42114dac2f9d869e31e56108a960314c1af15938ce11a6ff -address /var/run/docker/containerd/containerd.sock -containerd-binary /usr/bin/containerd -runtime-root /var/run/docker/runtime-runc -debug root 23132 1 1 10:30 ? 00:00:15 /usr/bin/dockerd -p /var/run/dockerd.pid --mtu=900 --log-opt max-size=10m --log-opt max-file=2 --storage-driver=btrfs -D --storage-driver=btrfs root 23154 23132 2 10:30 ? 00:00:26 containerd --config /var/run/docker/containerd/containerd.toml --log-level debug root 29857 23154 0 10:31 ? 00:00:00 containerd-shim -namespace moby -workdir /var/lib/docker/containerd/daemon/io.containerd.runtime.v1.linux/moby/50e7e412aba948d9f02c8ab6a5ea58eaae3e66fd766fd21e9fca6095200b6c1c -address /var/run/docker/containerd/containerd.sock -containerd-binary /usr/bin/containerd -runtime-root /var/run/docker/runtime-runc -debug root 30385 3581 2 10:49 ? 00:00:00 docker stats --no-stream --format={{.ID}};{{.CPUPerc}};{{.MemUsage}} root 30528 8819 0 10:49 pts/0 00:00:00 grep docker root 30876 23132 0 10:31 ? 00:00:00 /usr/bin/docker-proxy -proto tcp -host-ip 0.0.0.0 -host-port 9443 -container-ip 172.17.0.2 -container-port 9443 root 30925 23132 0 10:31 ? 00:00:00 /usr/bin/docker-proxy -proto udp -host-ip 0.0.0.0 -host-port 1194 -container-ip 172.17.0.2 -container-port 1194 root 30963 23132 0 10:31 ? 00:00:00 /usr/bin/docker-proxy -proto tcp -host-ip 0.0.0.0 -host-port 943 -container-ip 172.17.0.2 -container-port 943 root 31813 23154 0 10:31 ? 00:00:00 containerd-shim -namespace moby -workdir /var/lib/docker/containerd/daemon/io.containerd.runtime.v1.linux/moby/d6b5b1f598175b787039994da22dea95cd0c367680efc4ba947c2de5198ef0c6 -address /var/run/docker/containerd/containerd.sock -containerd-binary /usr/bin/containerd -runtime-root /var/run/docker/runtime-runc -debug I followed these instructions and added a /etc/docker/daemon.json file with "debug": false but that didn't help either: root@Juno:/etc/docker# ls daemon.json key.json root@Juno:/etc/docker# less daemon.json { "debug": false } root@Juno:/etc/docker# sudo kill -SIGHUP $(pidof dockerd) root@Juno:/etc/docker# docker info | grep -i debug.*server Debug Mode (server): true
-
+1 for "Invalid unRAID`s MBR signature" on a (WD) shucked drive. Appreciate you effort gfjardim.
-
My docker log often get filled with these messages every few seconds time="2019-11-14T10:27:47.142030231+02:00" level=debug msg="Calling GET /v1.37/containers/f3c02ffa8cde0ef9623d4455236370f72084a2a166a10297b6124177fd80353c/json" time="2019-11-14T10:27:47.142796464+02:00" level=debug msg="Calling GET /v1.37/containers/a7cca2b1634e5c33b7568d673d036f183d65d6d58acb6a4ff76be8faa10ef231/json" time="2019-11-14T10:27:47.143377579+02:00" level=debug msg="Calling GET /v1.37/containers/716254a6834843da1450c22ecb5c7f46a3fdc131363e9fe6a41424ae3e748028/json" time="2019-11-14T10:27:47.144050634+02:00" level=debug msg="Calling GET /v1.37/containers/d5a9683ea707d2eae142bda82d83201fc8b5d4502ea3ed1c59de4258cccc021e/json" time="2019-11-14T10:27:47.144669639+02:00" level=debug msg="Calling GET /v1.37/containers/add57c9a2682fe3c199d6f3edf76df2f0e1628bfaa7f5d65b1919fb4ba657938/json" time="2019-11-14T10:27:47.145322148+02:00" level=debug msg="Calling GET /v1.37/containers/d504ae998b721566680d7a41cd86ea1a755d6424bced611344cd05bfe6ba570b/json" time="2019-11-14T10:27:47.146126158+02:00" level=debug msg="Calling GET /v1.37/containers/6458706016cc098ab5342f82446a1140cb7b97d4f191f60670d8b2a2dea1d91d/json" time="2019-11-14T10:27:47.146880602+02:00" level=debug msg="Calling GET /v1.37/containers/9371149b4a9c477f1a2832936df9c555764a73ade300a2886054c0df68c31469/json" time="2019-11-14T10:27:47.147601801+02:00" level=debug msg="Calling GET /v1.37/containers/f15da2ef0722efd5a742a2f2d0be94748e4543660ac83950383797eba2de5b92/json" I assumed I need to disable the debug mode and following these instructions I tried adding DOCKER_DEBUG="no" and DOCKER_DEBUG="false" in the docker.cfg file, but debug is still enabled.
-
September 8th update: "Don't check for docker apps having an update available for them unless running 6.8" So not checking for docker apps updates until 6.8 installed? I must be reading this wrong, lol.
-
Congratulations! Dreamed of a NAS server for years, and when financially able to build one, jumped into the Unraid Waggon about 3 years ago , and been happy about it ever since.
-
Following this thread which I saw this morning for the first time, and some problems I had lately (no VMs), I updated my bios for the first time (R1.0 --> R2.0), Supermicro X10SDV-4C-7TP4F board. It went smoothly only after I figured out that when it reboots, doesn't mean it's finished, and I shouldn't intervene 😆. Indeed stupid-proofed. Had to open manual and learn how to clear the CMOS.
-
-
My docker log keeps filling up. It is caused by the following messages every second or two. My issues/questions: 1. The docker doesn't comply with the docker log size limit: The settings are 10MB max, 2 log files. The log clogs my tmpfs: up to 128MB every day or so. 2. Why/how did the Docker log level changed to debug, and how do I change it back? 3. Is it normal to have the docker queried for info (?) so intensively? Should I search for the cause? Repeating messages in docker log: time="2018-09-26T10:39:51.711023129+03:00" level=debug msg="Calling GET /_ping" time="2018-09-26T10:39:51.711452020+03:00" level=debug msg="Calling GET /v1.38/version" time="2018-09-26T10:39:51.712261697+03:00" level=debug msg="Calling GET /v1.38/events?filters=%7B%22type%22%3A%7B%22container%22%3Atrue%7D%7D" time="2018-09-26T10:39:51.712697853+03:00" level=debug msg="Calling GET /v1.38/containers/json?limit=0" time="2018-09-26T10:39:51.720401485+03:00" level=debug msg="Calling GET /v1.38/containers/865dbb780dfb/stats?stream=0" time="2018-09-26T10:39:51.720474027+03:00" level=debug msg="Calling GET /v1.38/containers/3db916e81f42/stats?stream=0" time="2018-09-26T10:39:51.720529815+03:00" level=debug msg="Calling GET /v1.38/containers/a0cfb32dcac1/stats?stream=0" time="2018-09-26T10:39:51.720559173+03:00" level=debug msg="Calling GET /v1.38/containers/1ed2bb3c89db/stats?stream=0" time="2018-09-26T10:39:51.720589840+03:00" level=debug msg="Calling GET /v1.38/containers/5df94a2abd15/stats?stream=0" time="2018-09-26T10:39:51.720728577+03:00" level=debug msg="Calling GET /v1.38/containers/693476194b3d/stats?stream=0" time="2018-09-26T10:39:53.641488701+03:00" level=debug msg="Client context cancelled, stop sending events"
-
I mapped another path (in addition to /sync and /downloads) in the container. The path is mapped to an unassigned device, so mapped to /mnt/disks/,,,, I disconnected a synced folder, moved the folder to that path, and when I reconnect the folder and tries to change it's location to the new path I get the following error: Sync Home does not have permission to access this folder.
-
Apparently there was some kind of a problems with the destination folder of the backup. I couldn't update/write to that user share myself. i'm not sure if it was an FS problem (xfs_repair was clean), or a permission problem (why would it be out of the blue?). The destination share had a copy of Plex data (22GB, 570K folders, 470K files), so I suspect it caused this error and some others. newperms either halted or I didn't have enough patience to wait for it to end. so I recreated the share, moved away the Plex folder, and everything is ok now.
-
The plugin stopped to backup: It's running, but no backup data is created. The backup is scheduled for Sunday morning, and the last backup folder is of August 19th I had (and still having) severe problems with my array, but I don't understand how these two problems are linked. Attached a syslog of a backup that I initiated manually today while the array was up and running OK. CABackup.20180831.txt

