





The Transplant
Members
-
Joined
-
Last visited
Everything posted by The Transplant
-
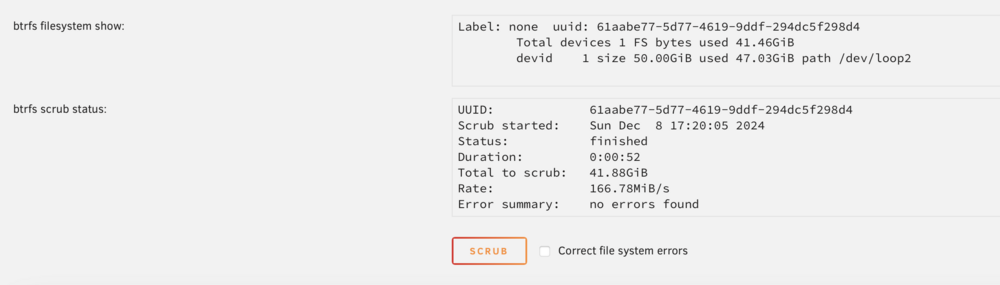
I don't see it on the docker settings page. I think you have to stop the docker service. I do see this at the bottom but nothing here matches with what I would expect: And this is what shows under the share:

-
So I should be seeing something in container size for one of my dockers? I am almost 100% positive it is set to 25GB. I don't know a way to figure out the size without shutting down and I want to leave it running a little longer in its blown up state to see what is going on. The growth has slowed down significantly which points down to the external streaming of my cameras. I shutdown all of the devices that were pulling camera feeds. But still concerned that I can't see a smoking gun in terms of a file system that has gotten big.
-
I also posted the NGINX Proxy Manager as I have suspicions that the issue is between Frigate and the reverse proxy. Let me know if those numbers look ok. Also, what line items specifically would I be looking at that are blowing up? With docker container size around 9GB and image set at 25GB one assumes I am looking for something in the 10+GB range to achieve 80+%. ThanksI see this in NGINX Proxy Manager. Frigate is running through that for external camera feeds: /tmp # du -h 0 ./run/user/app 0 ./run/user 0 ./run 0 . /tmp # df -h Filesystem Size Used Available Use% Mounted on /dev/loop2 50.0G 41.5G 6.3G 87% / tmpfs 64.0M 0 64.0M 0% /dev shm 64.0M 0 64.0M 0% /dev/shm shfs 931.5G 310.4G 618.4G 33% /config /dev/loop2 50.0G 41.5G 6.3G 87% /etc/resolv.conf /dev/loop2 50.0G 41.5G 6.3G 87% /etc/hostname /dev/loop2 50.0G 41.5G 6.3G 87% /etc/hosts tmpfs 31.4G 0 31.4G 0% /proc/acpi tmpfs 64.0M 0 64.0M 0% /proc/kcore tmpfs 64.0M 0 64.0M 0% /proc/keys tmpfs 64.0M 0 64.0M 0% /proc/timer_list tmpfs 31.4G 0 31.4G 0% /sys/firmware tmpfs 31.4G 0 31.4G 0% /sys/devices/virtual/powercap /tmp #Not sure what I am looking at here - but I see some large numbers at the bottom? Would appreciate help in interpreting. # du -h 92K ./frigate/api/__pycache__ 232K ./frigate/api 40K ./frigate/comms/__pycache__ 92K ./frigate/comms 52K ./frigate/detectors/plugins/__pycache__ 108K ./frigate/detectors/plugins 24K ./frigate/detectors/__pycache__ 156K ./frigate/detectors 44K ./frigate/events/__pycache__ 92K ./frigate/events 148K ./frigate/images 12K ./frigate/motion/__pycache__ 32K ./frigate/motion 40K ./frigate/output/__pycache__ 96K ./frigate/output 48K ./frigate/ptz/__pycache__ 136K ./frigate/ptz 44K ./frigate/record/__pycache__ 104K ./frigate/record 20K ./frigate/review/__pycache__ 48K ./frigate/review 16K ./frigate/stats/__pycache__ 32K ./frigate/stats 148K ./frigate/test 16K ./frigate/track/__pycache__ 48K ./frigate/track 64K ./frigate/util/__pycache__ 148K ./frigate/util 192K ./frigate/__pycache__ 2.0M ./frigate 100K ./migrations 9.7M ./web/assets 2.0M ./web/fonts 40K ./web/images 12M ./web 14M . # df -h Filesystem Size Used Avail Use% Mounted on /dev/loop2 50G 42G 6.4G 87% / tmpfs 64M 0 64M 0% /dev shm 512M 19M 494M 4% /dev/shm shfs 36T 24T 12T 67% /config overlay 32G 1.6G 30G 5% /usr/share/zoneinfo/Etc/UTC /dev/loop2 50G 42G 6.4G 87% /etc/hosts tmpfs 954M 124M 831M 13% /tmp/cache tmpfs 32G 12K 32G 1% /proc/driver/nvidia overlay 32G 1.6G 30G 5% /usr/bin/nvidia-smi overlay 32G 1.6G 30G 5% /lib/firmware/nvidia/565.57.01/gsp_ga10x.bin devtmpfs 8.0M 0 8.0M 0% /dev/nvidia0Just continuing to update on this. I did step back to the previous version to see if it is something that occurred in an update. No dice. I could go even further back - something to consider. It is a little frustrating because the only evidence I have of the docker image filling up is this: Nowhere else can I find evidence of what is going on and where. I have done the following: Check container size button - 8.54GB Run the docker log size script - ~20MB Run the Space Invader script - 10.29GB Checked the /tmp and /dev/shm both inside the console for the docker and in general and see very low counts Is there really no way to figure out where the files are that are causing that meter on the dashboard to report 85%. What does it represent? It just went to 86%.
 Thanks - I was able to step back but it doesn't seem to be the issue so far. I could go back pre- 0.14.0 but that would be a last resortI want to step back to the last stable version of Frigate. I am currently running 0.14.1-f4f3cfa. I have an issue with my docker image blowing out that has been introduced in a recent version. I believe that I need to edit the Repository: line in the docker config in unraid which currently reads this: ghcr.io/blakeblackshear/frigate:stable and change to: ghcr.io/blakeblackshear/frigate:v0.14.0 Assuming I want to go to 0.14.0. I understand that other changes could have been made to the app - database, config files, etc. so this may not be a foolproof process. I am checking on this but wanted to confirm that I am doing this correctly. Thanks.
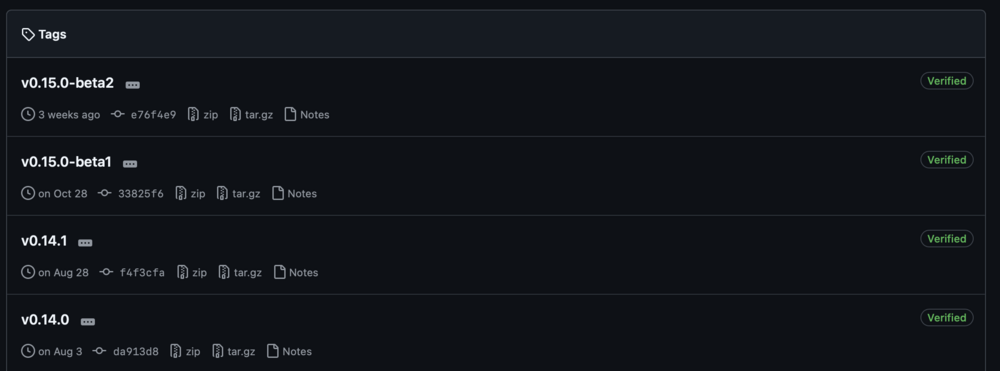 I am working my way through the options in Frigate, turning them off, and seeing if there is a problem. I have started with turning off 24 hour recording to see if that is the issue or if the motion events are what is causing it. One thing I did want to try is stepping back to an older version. It occurred to me that since I have not changed settings in a while then this could have started with a specific release. I am a little unclear how to do this although I am searching around looking for folks that have done this. The docker points to: ghcr.io/blakeblackshear/frigate:stable The ui says version 0.14.1-f4f3cfa Yet I can't figure out what the last stable version was. And if I had it can I specify this in the repository line?I recall looking at cache but will do that the next time it happens - which won't be long. It is definitely frigate. The image went into warning mode this morning and I shutdown Frigate and left SWAG running and things returned to normal. I have posted on the GitHub for Frigate about the transcoding and got the response that Frigate only uses small segments so this can't be the issue. This may be getting out of my depth but a LOT of small segments could lead to a problem?Hi, I recreated the vdisk and I am still having the same problem. Is there nothing I can look at when the image starts filling up to see what is causing it? Container size says ~8.3GB and I have the docker image set to 30GB now. odin-diagnostics-20241208-2003.zipThanks - have tried that. I also ran the remove orphaned images and unconnected docker volumes and both reported 0 bytes removed. But this doesn't make sense - My docker is set to 25GB and yet is showing this in the docker setup: Label: none uuid: 539c2bc6-d6d9-461b-ae29-22dc0f3538f0 Total devices 1 FS bytes used 95.81GiB devid 1 size 100.00GiB used 100.00GiB path /dev/loop2 At one point I did set the docker image to 100GB to allow myself some space to figure out what is going on. I moved it back to 25GB at some point but this seems to show that it is holding at 100GB? I did run the scrub - not sure whether that is relevant. Right now the docker image is reporting 100% full. I restart Frigate and I immediately get a returned to normal. So stuck. Space invader script output is shown below but shows nothing out of the ordinary: Script location: /tmp/user.scripts/tmpScripts/check_docker_image/script Note that closing this window will abort the execution of this script ################################################################################## Cleanup before starting (if requested in script) ################################################################################## Not removing orphaned images (this can be set in script if you want to) --------------------------------------------------------------------------------- Not removing unconnected docker volumes (this can be set in script if you want to) ################################################################################## List of Image, Container and docker volume size. ################################################################################## There are 21 Images taking up ......17.47GB There are 21 Containers taking up ......190.9MB There are 8 Local Volumes taking up ......50.04kB There are 0 Build Cache taking up ......0B ################################################################################## List of containers showing size and virtual size ################################################################################## First size is the writable layers of the container (Virtual size is writable and read only layers) 189kB (virtual 180MB) Is being taken up by ......... jlesage/nginx-proxy-manager 4.38MB (virtual 1.92GB) Is being taken up by ......... ghcr.io/blakeblackshear/frigate:stable 348kB (virtual 402MB) Is being taken up by ......... lscr.io/linuxserver/swag 22.4kB (virtual 202MB) Is being taken up by ......... lscr.io/linuxserver/radarr:latest 23.7MB (virtual 2.61GB) Is being taken up by ......... binhex/arch-krusader 25.5kB (virtual 614MB) Is being taken up by ......... lscr.io/linuxserver/code-server 116MB (virtual 316MB) Is being taken up by ......... lscr.io/linuxserver/sonarr:latest 24.2kB (virtual 182MB) Is being taken up by ......... lscr.io/linuxserver/sabnzbd 24.9MB (virtual 2.93GB) Is being taken up by ......... lscr.io/linuxserver/calibre 0B (virtual 1.38GB) Is being taken up by ......... fallenbagel/jellyseerr:latest 78kB (virtual 237MB) Is being taken up by ......... ghcr.io/hotio/readarr:latest 0B (virtual 302MB) Is being taken up by ......... portainer/portainer-ce:latest 17.8kB (virtual 177MB) Is being taken up by ......... ich777/openvpn-client 1.26MB (virtual 716MB) Is being taken up by ......... quantumentangledandy/neolink 7.53MB (virtual 680MB) Is being taken up by ......... emby/embyserver:latest 3.53kB (virtual 105MB) Is being taken up by ......... ich777/pushover-on-start 791kB (virtual 1.02GB) Is being taken up by ......... mmcc73/birdcage_frontend:latest 1.71MB (virtual 2.24GB) Is being taken up by ......... mmcc73/birdcage_backend:latest 9.84MB (virtual 2.61GB) Is being taken up by ......... mmcc73/birdnetserver:latest 0B (virtual 116MB) Is being taken up by ......... redis:latest 0B (virtual 25.7MB) Is being taken up by ......... spants/mqtt ################################################################################## List of containers in size order ################################################################################## 2910MB - lscr.io/linuxserver/calibre 2610MB - mmcc73/birdnetserver 2580MB - binhex/arch-krusader 2240MB - mmcc73/birdcage_backend 1920MB - ghcr.io/blakeblackshear/frigate 1380MB - fallenbagel/jellyseerr 1020MB - mmcc73/birdcage_frontend 714MB - quantumentangledandy/neolink 672MB - emby/embyserver 614MB - lscr.io/linuxserver/code-server 401MB - lscr.io/linuxserver/swag 302MB - portainer/portainer-ce 237MB - ghcr.io/hotio/readarr 202MB - lscr.io/linuxserver/radarr 199MB - lscr.io/linuxserver/sonarr 182MB - lscr.io/linuxserver/sabnzbd 180MB - jlesage/nginx-proxy-manager 177MB - ich777/openvpn-client 116MB - redis 105MB - ich777/pushover-on-start 25.7MB - spants/mqtt ################################################################################## List of docker volumes, the container which they are connected to their size ################################################################################## ID 4a80d720986c44fdf9709def6bd0da1c52f273075b9670fdb251b67c33785b7c This volume connected to has a size of 4.0K ID 4aef825c8565a9af136b33b29f6f771feb71ceee3707e9a3e421a573061d947a This volume connected to has a size of 4.0K ID 56ee3c188838eb81aa0d0f2e9319197df6a8c9c7371a25b8195c1d912745928a This volume connected to has a size of 4.0K ID 65eaef7402ad3ab0bdc7bd308c7d55c9f51d10e2021d51c7dbad6d5dc73b7430 This volume connected to birdcage-redis-1 has a size of 48K ID 73f23ee9023bac733edcc8ba5bdd97edcc07ed240651724e6818df6adc322f9b This volume connected to has a size of 0 ID 61088a7232ea99eb2d39121662684d7222c6371b451d6a034215bbcba9a70d02 This volume connected to has a size of 0 ID c9419b5fb422186ae1494253acedcb6d032f3aa26eb6e20e0df638f51d52670b This volume connected to has a size of 4.0K ID cc5c1f57dbc07f691176849bdb37f23ec8fd599f234b0912208abc95ea678915 This volume connected to has a size of 4.0K ################################################################################## Done. Scroll up to view results DONEThis apparently has been an issue for some time but I didn't notice as my notification agent was not set up correctly. I only picked this up after running Fix Common Problems. I have narrowed the issue down (I think) to my Frigate container. When the issue happens, I shut down Frigate and docker image returns to normal almost immediately. I have been working to diagnose it for two weeks now and have been posting on the Frigate GitHub to get help. But other than the evidence above I have not been able to find a smoking gun. Frigate is running through SWAG for external access. I have seen some issues with this and other containers, such as Plex. So I am wondering if this could be causing the issue? I switched to NGINX just to see but it did the same thing. Frigate is setup with these arguments: --shm-size=512mb --mount type=tmpfs,target=/tmp/cache,tmpfs-size=1000000000 --restart unless-stopped --runtime=nvidia Checking all of the container maps nothing should be an issue: I don't think I am using this so I probably need to remove it. I continue to monitor the /tmp to see if there are files there that can provide some clues but I guess this is a matter of timing as I don't seem to find anything large there. So what are some of my next options to try? Thanks. odin-diagnostics-20241205-0756.zip

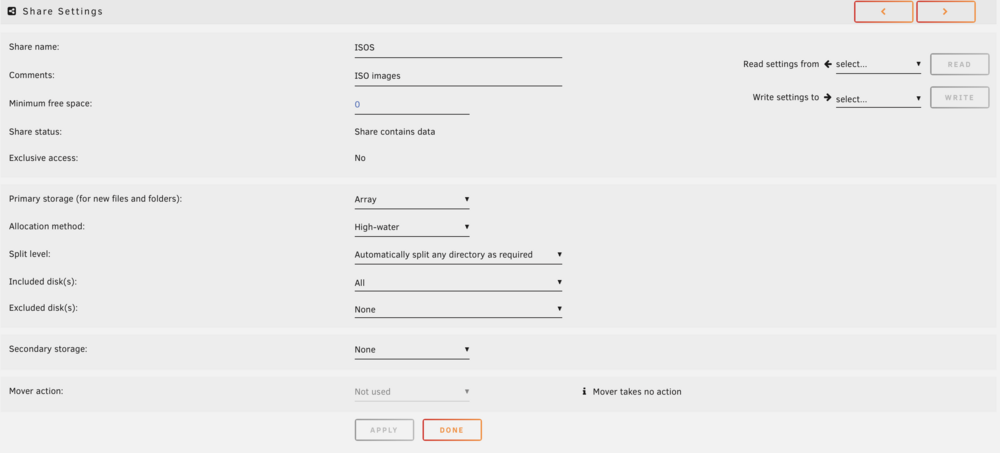
 I believe the two shares are actually a case issue and I am trying to figure out where there is a reference to an uppercase version. However these were both fine until I ran the latest update and now it is reporting this? This is what I see in share settings: As far as I can tell these shares are not set to go to cache? odin-diagnostics-20241201-0917.zip
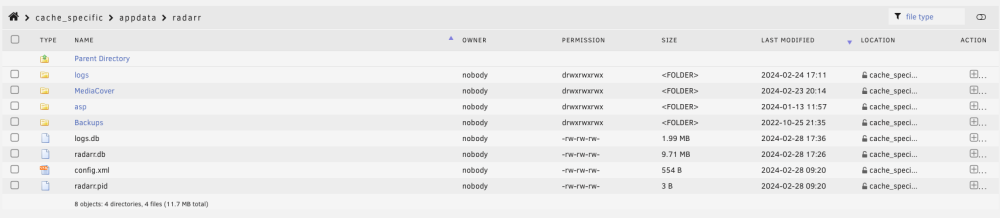
 Hi, thanks for the plugin. Saved me on many occasions. It seems like any issue I have with the server is sufficiently long enough for me to forget the steps necessary to restore. I just a corrupted db message in Sonarr so I need to restore that. I searched and I can't find any step by step guides to restoring as I want to store this information so I don't have to relearn each time. Can someone point me to this as I know it has to be out there but my searching has not found it so far. Thanks.Had a power failure this morning. Server is on UPS but for what ever reason experienced a bad shutdown. I will explore that once I get everything working again. Diagnostics attached. Presented with No Dockers and VMs installed. Being a good boy I searched through the forums and did the following: Went to apps and selected all previously installed and installed them. Dockers are now loading but lost all settings. So I figured I have to restore them from backups. I decided to start with my only VM. Ran the restore. Then went to stop and start the array. It was then that I noticed there was no cache. So I stopped the array and proceeded to add the unassigned disks back to my cache. I was running a mirrored cache. I have two SSDs. When I go to select the drive for the cache I see both SSDs - one labelled SDK and one SDJ. Now I am stumped and searched but could not find this. Which drive do I add first? Does it matter? I guess my question is how do I recreate a cache when you have mirrored cache drives that are no longer assigned? Thanks for any help. odin-diagnostics-20241102-1047.zipThanks - I have ordered two of them and will report back.Opening up an old topic discussed here a couple of years ago - I am looking to expose 2 serial ports to a VM. I am moving from a dedicated windows machine into a VM. The dedicated machine is using an EdgePort 416. I did try plugging that in and trying to access it through the USB Manager but with 16 serial ports and 4 USB ports it was too much to figure out. It looks like the USB Manager kept cycling and finding the ports and then losing the ports. But since my needs are quite simple - I thought I would just go and purchase two USB serial converters and plug them in. Are there any recommendations that have worked for others? Thanks.Well I held my nose and went for it. My concern was that some dockers were clearly writing to the old cache even after updating all settings. In some cases this was because their config had hard coded references to the cache location. In others it seems that when it has an option of old a new cache at the same time it continues writing to the old cache for existing files and new cache for newly created files? Anyway I was able to move them all successfully. Now on to adding a mirror for the cache so I don't find myself in this situation again. One more question. When a docker has a hard coded reference to the cache drive, for example: /mnt/cache/appdata/openvpn-client. Wouldn't it make sense to change this to; /mnt/user/appdata/openvpn-client and then it would go wherever the cache is located? Thanks.I would love to follow this advice - if I felt confident enough that I wouldn't hose the server in doing this. As an example I see a Radarr folder in both old and new cache. Different files and folders. And date/time stamps indicating that they are both being updated now. What do I do here? Im getting close to deleting all of the dockers at this point as it appears you need to have a very strong understanding of what is going on here in order to fix this. But willing to hang in to see if this can be done without me having to reconfigure everything. Thanks. new cache: old cache:
 I have had relatively limited experience with hypervisors but it seems like a simple backup and restore should not be this difficult. But I am learning that unraid has come a long way but still requires a fairly deep understanding of what is going on behind the scenes to recover from any issues.ok, fixed the mover action on appdata. I did shutdown vms and dockers when running mover before. But with this new setting change should I try shutting them down again and running Mover or am I still going to have an issue of file versions? Thanks.That makes sense. So how do I compare these files? Using Krusader I see the folders on cache_specific. But where is the file on the array that I should be comparing this too? I see disk1-5. One of them has an appdata folder. It contains virtually nothing and the others don't. So where am I supposed to compare against? Thanks.Thanks for responding. I have looked at the logs - all they seem to show is a lot of this. cache_specific is the drive that I am trying to empty. Is there something else in the logs I should be looking for or does this help diagnose? Thanks. Feb 28 08:25:20 Odin move: move_object: /mnt/cache_specific/appdata/binhex-krusader/home/.icons/BLACK-Ice-Numix-FLAT/24/status/audio-output-none-panel.svg File exists Feb 28 08:25:20 Odin move: file: /mnt/cache_specific/appdata/binhex-krusader/home/.icons/BLACK-Ice-Numix-FLAT/24/status/btsync-gui-disconnected.svg Feb 28 08:25:20 Odin move: move_object: /mnt/cache_specific/appdata/binhex-krusader/home/.icons/BLACK-Ice-Numix-FLAT/24/status/btsync-gui-disconnected.svg File exists Feb 28 08:25:20 Odin move: file: /mnt/cache_specific/appdata/binhex-krusader/home/.icons/BLACK-Ice-Numix-FLAT/24/status/audio-recorder-on.svg Feb 28 08:25:20 Odin move: move_object: /mnt/cache_specific/appdata/binhex-krusader/home/.icons/BLACK-Ice-Numix-FLAT/24/status/audio-recorder-on.svg File exists Feb 28 08:25:20 Odin move: file: /mnt/cache_specific/appdata/binhex-krusader/home/.icons/BLACK-Ice-Numix-FLAT/24/status/btsync-gui-paused.svg Feb 28 08:25:20 Odin move: move_object: /mnt/cache_specific/appdata/binhex-krusader/home/.icons/BLACK-Ice-Numix-FLAT/24/status/btsync-gui-paused.svg File exists Feb 28 08:25:20 Odin move: file: /mnt/cache_specific/appdata/binhex-krusader/home/.icons/BLACK-Ice-Numix-FLAT/24/status/audio-recorder-paused.svg Feb 28 08:25:20 Odin move: move_object: /mnt/cache_specific/appdata/binhex-krusader/home/.icons/BLACK-Ice-Numix-FLAT/24/status/audio-recorder-paused.svg File exists Feb 28 08:25:20 Odin move: file: /mnt/cache_specific/appdata/binhex-krusader/home/.icons/BLACK-Ice-Numix-FLAT/24/status/clementine-85-playing.svg Feb 28 08:25:20 Odin move: move_object: /mnt/cache_specific/appdata/binhex-krusader/home/.icons/BLACK-Ice-Numix-FLAT/24/status/clementine-85-playing.svg File exists Feb 28 08:25:20 Odin move: file: /mnt/cache_specific/appdata/binhex-krusader/home/.icons/BLACK-Ice-Numix-FLAT/24/status/audio-recorder.svg Feb 28 08:25:20 Odin move: move_object: /mnt/cache_specific/appdata/binhex-krusader/home/.icons/BLACK-Ice-Numix-FLAT/24/status/audio-recorder.svg File exists Feb 28 08:25:20 Odin move: file: /mnt/cache_specific/appdata/binhex-krusader/home/.icons/BLACK-Ice-Numix-FLAT/24/status/changes-allow.svg Feb 28 08:25:20 Odin move: move_object: /mnt/cache_specific/appdata/binhex-krusader/home/.icons/BLACK-Ice-Numix-FLAT/24/status/changes-allow.svg File exists Feb 28 08:25:20 Odin move: file: /mnt/cache_specific/appdata/binhex-krusader/home/.icons/BLACK-Ice-Numix-FLAT/24/status/audio-volume-high-panel.svg Feb 28 08:25:20 Odin move: move_object: /mnt/cache_specific/appdata/binhex-krusader/home/.icons/BLACK-Ice-Numix-FLAT/24/status/audio-volume-high-panel.svg File exists


