






Saldash
Members
-
Joined
-
Last visited
-
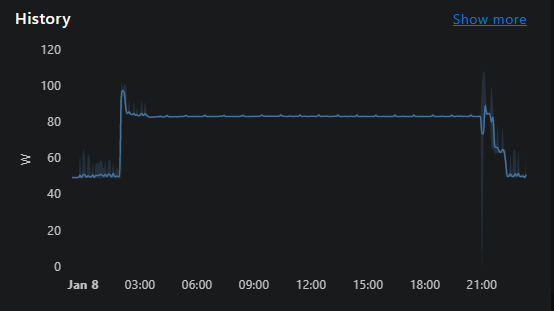
Hi All, I wrote some time ago that I was experiencing what appeared to be somewhat random system halts where the only way to resolve it was a full power off as the plug, wait and reboot. There would be no apparent cause for this but for a while it stopped happening, so I let the issue go. It has recently started flaring up again with a vengeance, so much so now I have a smart plug attached to the machine so I can remotely cut power and reboot. I still don't know for sure why this is happening and I'm not sure where to start. I've tried looking in the syslog but it only appear to start from the time the system came back online after it's last reboot, which is no good. I think there may be a correlation between the system halts and disk usage - A parity check is scheduled for 2AM every Sunday morning, and that is roughly when the machine stopped responding. Looking at the power monitoring data my smart plug provides, you can see the halt, shortly after 2AM when the parity check starts, then a long stretch of idling at ~80 watts before I cut power and rebooted earlier this evening. My machine typically idles about the 50 watt mark as I'm the only user, it serves very light NAS duties but does handle downloading and local plex media streaming. All my drives are reporting a healthy state and I've never seem the error count on them above zero. I've run self tests on all my drives but they all report completed without error. I'm not sure what to do next with this other than bite the bullet and move to a Synology or QNAP box 😟 EDIT: I Turned on the SysLog server and pointed Unraid back at itself to log events, then triggered a Parity check. I got about 0.8% before the server crashed. It does not appear to have logged the issue though as the crash occurred at 00:34 tabris-diagnostics-20230108-2347.zip
-
Hi all, I've started getting periodic systems halts that require a full hard reset to resolve. The system boots and appears to start normally until I get to entering my array password where after starting the array the UI appears to hang with the unraid logo pulse for a good minute at least before the UI becomes normally responsive again. I run weekly array health checks that have not reported any issues and after a fresh boot up, I cannot see anything in the system log that would indicate the source of the fault (not that I'd know what I was looking at to be honest). I've uploaded the diagnostic file in the hopes that someone might be able to point me in the right direction to getting this sorted. The box isn't highly critical but it is starting to get annoying having to hard reset the box and I've now gotten to the point where it's common enough that the server is on a smart plug that I can remotely turn off/on when this issue crops up. Thanks in advance for your help, tabris-diagnostics-20220821-2044.zip
-
Hmm.. I got updated today and now Sonarr won't start. I get a repeat of this block before it finally gives up and dies. 2021-03-09 21:08:59,097 DEBG fd 8 closed, stopped monitoring <POutputDispatcher at 22543642412560 for <Subprocess at 22543642413328 with name sonarr in state STARTING> (stdout)> 2021-03-09 21:08:59,097 DEBG fd 10 closed, stopped monitoring <POutputDispatcher at 22543642573312 for <Subprocess at 22543642413328 with name sonarr in state STARTING> (stderr)> 2021-03-09 21:08:59,097 INFO exited: sonarr (exit status 2; not expected) 2021-03-09 21:08:59,097 DEBG received SIGCHLD indicating a child quit 2021-03-09 21:09:02,101 INFO spawned: 'sonarr' with pid 68 2021-03-09 21:09:02,113 DEBG 'sonarr' stderr output: Cannot open assembly '/usr/lib/sonarr/NzbDrone.exe': No such file or directory. Forcing an update seems to have resolved this though. Might be useful for other people having the same issue.
-
I'm unable to access VM's through the Unraid UI - Picking any of my running VM's and clicking VNC Remote just results in the new window showing me this error; I'm accessing the UI through: Google Chrome 88.0.4324.192 (Official Build) (x86_64) Running on MacOS 11.2.2 VNC Remote does work on Safari on the same machine.
-
Has anyone been able to get the external (remote) client IP address to forward to the proxied server? I've skimmed a few pages and run a search over this topic but I can't find anything on getting the client's IP address to the server. For clarity I'm running a site using IIS on Windows Server 2016, with Nginx Proxy Manager fronting the public requests. My web server only ever sees the IP Address of the docker (my unraid server), which is problematic when my application has IP Address banning implemented for security - I've had to disable it incase someone cottoned on that they could effectively use my own security against me 😐
-
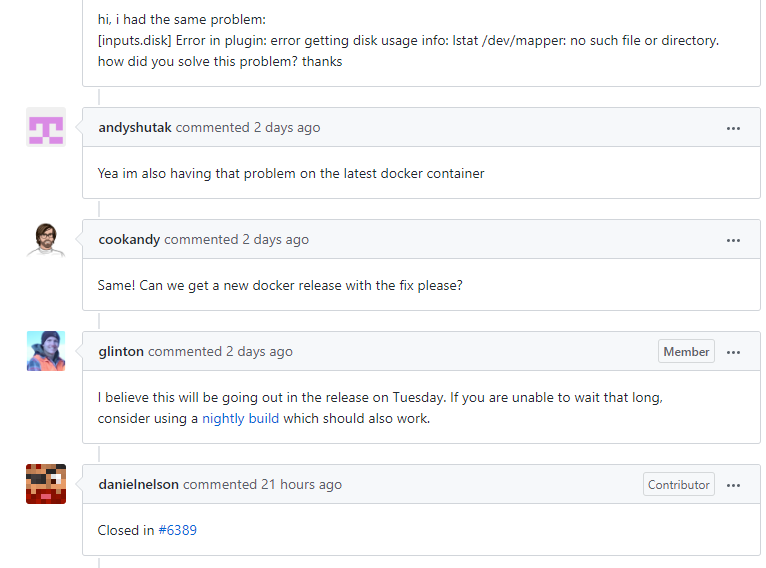
This is a known issue in the current build and I believe a fix is going to be released on Tuesday for the main project. When this particular docker will be updated is another story. https://github.com/influxdata/telegraf/issues/6388 Hope that helps EDIT: While I know it's got nothing to do with this docker, this is why I wish unRaid would support an official API endpoint for dashboard information. For right now scraping the dashboard in C# and parsing the DOM using HTMLAgilityPack is having to suffice.. barely
-
Sorry bud, I didn't even know you'd posted a response - I haven't had any notifications from the forum and only noticed when I popped on to ask a question about Grafana. I can't remember what is was that I had a problem with for this container, let me post this and I'll have a scroll back and edit this once I've remembered! -- EDIT Well I looked back and I haven't got a clue what i was on about! I do have everything setup and functioning so I would be happy to answer any specific questions you might have re the setup I use at this point.
-
I've literally just come back to it today, tried that and was about to post that it's worked for me before I saw your post. Had no idea if it was going to work or not but it was a shot in the dark that got the mark for me. Thank you anyway!
-
Hi, I have a need to access the nginx.conf file to try and fix a problem I'm having with larger header sizes with IdentityServer. Specifically in relation to: https://stackoverflow.com/a/48971393/4953847 How can I set the following values for this container? http{ ... proxy_buffer_size 128k; proxy_buffers 4 256k; proxy_busy_buffers_size 256k; large_client_header_buffers 4 16k; ... } Currently I'm able to authenticate my app but I immediately get redirected to a 502 Bad Gateway from nginx.
-
Stupid question numero uno.. how do you "log out" once you're in when password is used to secure? PS. This is a freaking awesome tool when I'm about with the ChromeBook.
-
I'd like to set up email alerts from Grafana but the settings page is read only. There's a banner that states that the settings are defined in grafana.ini or custom.ini or set as ENV variables. I've tried looking in the appdata folder for Grafana but I can't see either of the name files. I've also tried setting up a variable in the docker edit page and restarting the app but it doesn't work. How do I go about changing the settings for Grafana? Thanks,
-
Just a quick report to say that the displayed value for motherboard temp displayed on the updated dashboard is displaying Fan1 speed with rpm.
-
When configuring a proxy host, it does have an option to enable blocking common exploits, but I haven't found any documentation for what this entails.
-
This docker allows you to create user access lists and assign them to specific proxy hosts. From the main dashboard, click Access Lists in the menu. Create a new list and specify a username and password (up to five distinct users). Once created, go to the proxy host you want to secure, click edit to open the modal and at the bottom of the modal, select your access list from the dropdown and save. From the help text:
-
If you already have a web server hosting those files inside your network, then exactly where they are is fine, just point the reverse proxy at that server. If you don't have a web server running already, there are plenty of web server docker containers in Community Applications that will fit your needs. I'd suggest getting familiar with how your web server is configured and making sure it's secure before giving the outside world access to it.

