Magic815
Members
-
Joined
-
Last visited
Everything posted by Magic815
-
Hi all, I'm running Unraid 6.12.10 and am unable to get Static Remote Access working. Port 15444 never appears as a listening port despite the setting being enabled and the nginx config passing validation. Setup: Unraid 6.12.10 Unraid API version 4.32.1+5c297da1 Allow Remote Access: Always On Remote Access type: Static WAN Port: 15444 Port 15444 is forwarded on my router to <unraid server IP>:15444 Unraid Connect status: Connected Symptom: Port 15444 never shows up as a listening port: ss -tlnp | grep :15444 (no output)Nginx config validates clean: nginx -t nginx: the configuration file /etc/nginx/nginx.conf syntax is ok nginx: configuration file /etc/nginx/nginx.conf test is successfulThe API log at /var/log/graphql-api.log shows that the nginx reload sometimes succeeds and sometimes fails: [10:50:13 INFO NginxService]: Nginx reloaded [10:55:10 WARN NginxService]: Failed to reload Nginx with error: [11:00:11 WARN NginxService]: Failed to reload Nginx with error: [11:05:15 INFO NginxService]: Nginx reloadedDespite the occasional successful reload, port 15444 never appears in ss -tlnp output, even immediately after a successful reload is logged. What I have tried: Toggling remote access off and on multiple times Rebooting the server Manually restarting nginx via /etc/rc.d/rc.nginx restart Verifying no duplicate server blocks in /etc/nginx/conf.d/servers.conf The 15444 port never appears in ss output, regardless of what I try. Happy to provide any additional logs or info. Is this a known bug in 6.12.10? Thanks!
-
Ah, do these work? magicserver-diagnostics-20241113-0734.zip syslog-192.168.1.180.log
-
So I've had syslog enabled since before these past two crashes. See attached. (Sorry for not including it in my OP). If it helps pinpoint the timing, I started getting notifications of my services going down around 6:30am my local time this morning (Nov 13th). syslog-192.168.1.180.log
-
Hi there - So my unraid server has been running fine for a few months now, but in the last week or two has had two instances where it suddenly became unresponsive. I first notice it when services that I'm running on the server go down, and then the GUI becomes unreachable. When I look at the monitor plugged into the unraid server itself, I just see the following info: https://i.imgur.com/ah9dXn3.jpeg. I've also attached the diagnostics file. What is troubling is that single pressing the power button does not induce a safe shutdown. Instead, I'm forced to long-press, to get it to hard shutdown. The server seems to boot up fine aftwards, as far as I can tell. Is there anything in the logs that might be indicating what could be going wrong? If not, does that point to a likely hardware issue? magicserver-diagnostics-20241113-0734.zip
-
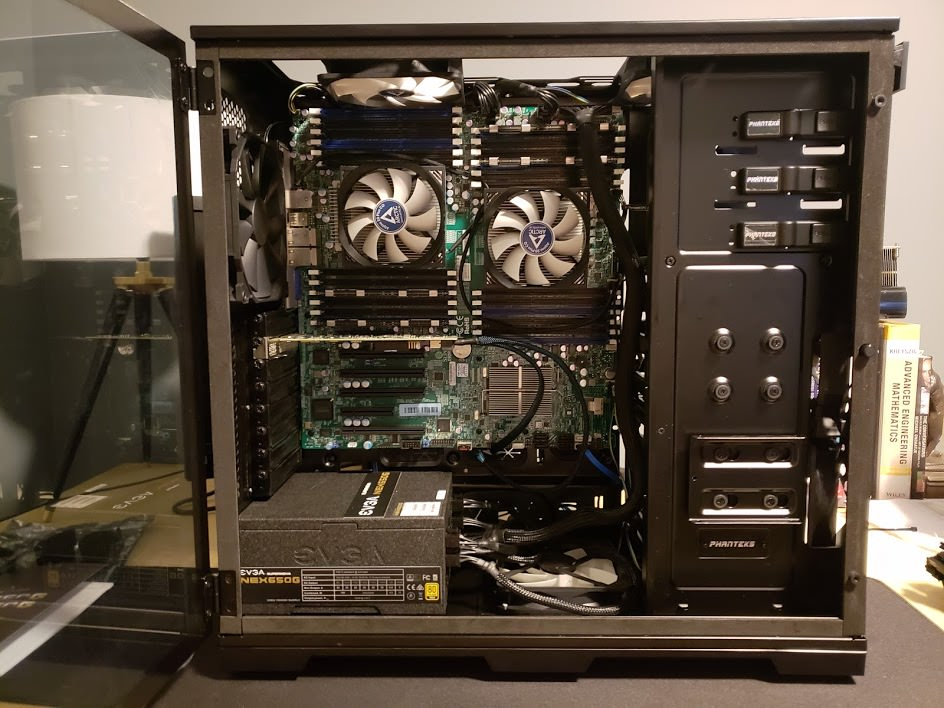
Edit: The server has been sold. ---------------------------------------------------------------------------------------------------------------------------------- Hi all - Looking to part ways with my Dual Xeon enterprise server build, as I've moved onto different hardware. The machine is used, but all parts are fully working and in great condition. This machine has been rock-solid as my UnRAID server. CPU: 2x Intel Xeon E5-2650V2 MoBo: Supermicro X9DRi-LN4F+ (This MoBo has IPMI, for remote accessing without the need for a monitor and keyboard) RAM: 64GB (4x 16GB DDR3 ECC 1600) (Micron MT36KSF2G72PZ-1G6E1HE) PSU: EVGA SuperNova G1 Case: Phanteks Enthoo Pro, Tempered Glass, Black Hard Drives: None (hard drives were removed/transferred to a different build) All spare parts/cables that came with the power supply and case have been saved and will also be provided with the server itself. My preference is local pickup (I'm in Maryland), as this thing is big and heavy. But I'm open to considering shipping within the US, if you cover shipping costs. Looking for $150, local pickup. (Or $150+shipping costs, if shipped).
-
None of my scripts or plugins have changed recently, none contain a shutdown command, and wouldn't some indication of said script/plugin initiating a shutdown show up in the syslogs/diagnostic data? Children were asleep hours before this shutdown event. We do have a cat, but the server is inside a metal rack/shelf that would make it tough for them to reach the power button - so I'd consider that very unlikely. Does anything in the syslog or diagnostics indicate that it was a physical press of the case's power button?
-
Hi all - So I'm running UnRAID v6.12.10, and last night (Sept 12th, at ~11:00pm local time to me) I got notifications on my phone that all of the services I run on my UnRAID machine went offline - indicating my server crashed and/or shut down. I was already asleep at the time, so I noticed this in the morning when I woke up. Heading to the machine, I confirmed that it was completely shut down. Clicking the power button this morning booted the UnRAID machine back up just fine. There is no ongoing parity check, which indicates to me that whatever shutdown event occurred last night was not considered to be an unclean shutdown. When inspecting the syslogs, I believe this to be the section of time where something went wrong to cause the shutdown: https://privatebin.net/?d5be42b542853bef#7zkqxzpbzGh2T3DQJw5GaHTE82bW3pXxwXfmCxBYtuQd Does anyone have any insight into what might have occurred? This is the first time I've seen this type of behavior on this server. Full diagnostics are attached. magicserver-diagnostics-20240913-0729.zip
-
Yea, I ended up moving forward with the build - without getting clear answers to my above questions. However, I realized that my use of a Home Assistant VM with Zigbee and Z-Wave USBs is causing my new machine to not reach the lower power c-states. I need to first separate out my Home Assistant VM and relevant USB devices to its own box, before I can really dive into the lower power c-states more. I'll post back here if/when I reach that point, but it will likely be awhile.
-
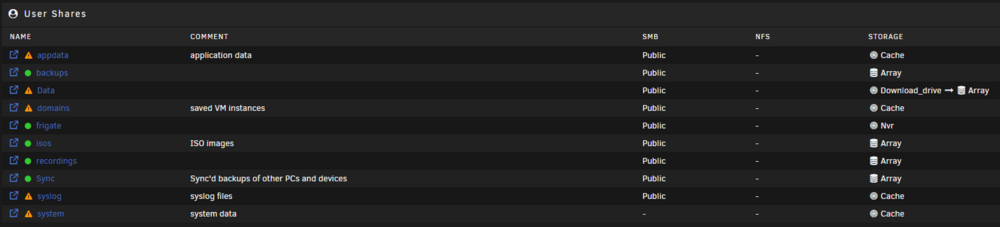
So I believe I've tried mover tuning before, but had to remove it due to bugs/issues at the time with my setup. As a note, I'm still on UnRAID version 6.12.10. I intend to stick to 6.12.xx until a couple minor releases into version 7. So these are my pool devices: And these are my share settings: Is the plugin (either the Squid version or this more recent fork) able to handle the use case of me setting a % threshold on the 'download_drive' hard drive for triggering the mover? My drive named 'cache' holds my appdata, domains, and systems files - which is pretty consistently 200GB / 1TB. It's the `Download_drive` that is constantly having new media added to it - and that is the one I'd want to have watched for when it gets close to being filled (i.e. when the 'Download_drive' gets over 70%, start moving files off of it to the array). But I'm not sure if the plugin can be set up for that use case?

-
So I don't have hardware in hand yet, but want to make sure my final parts list makes sense, and will allow me to hit the lower power c-states, before I buy everything. If anyone here has the ASRock Z690 Pro RS and is successfully hitting the lower power c-states, I'd love to hear from you on your specifics! I'm planning to build an i5-13500 with ASRock Z690 Pro RS, where I want to max out the 8 SATA ports with 8 HDDs. In reading the mobo manual, it has the following PCIE slots: • PCIE1 (PCIe 3.0 x1 slot) is used for PCIe x1 lane width cards. • PCIE2 (PCIe 5.0 x16 slot) is used for PCIe x16 lane width graphics cards. • PCIE3 (PCIe 4.0 x16 slot) is used for PCIe x4 lane width graphics cards. • PCIE4 (PCIe 3.0 x1 slot) is used for PCIe x1 lane width cards. • PCIE5 (PCIe 3.0 x16 slot) is used for PCIe x4 lane width graphics cards. And it has the following m.2 sockets: • 1 x Hyper M.2 Socket (M2_1, Key M), supports type 2260/2280 PCIe Gen4x4 (64 Gb/s) mode • 1 x Ultra M.2 Socket (M2_2, Key M), supports type 2260/2280 SATA3 6.0 Gb/s & PCIe Gen3x4 (32 Gb/s) modes • 1 x Hyper M.2 Socket (M2_3, Key M), supports type 2260/2280/22110 PCIe Gen4x4 (64 Gb/s) mode The manual also notes that: "If M2_2 is occupied by a SATA-type M.2 device, SATA3_7 will be disabled." I've read the first thing I'll need to do is use a Windows installation to enable the "Lower Power S0 Idle Capability" setting in the hidden BIOS menu, following these instructions: https://www.reddit.com/r/ASRock/s/7I8iPhwYA4 Then after that, it looks like it would be good for me to update my Realtek driver, and make sure I don't have an NVME attached to a cpu connected slot, per this comment: https://www.reddit.com/r/homelab/s/11uEPLX54B Some questions: 1. On the ASRock Z690 Pro RS, is that "CPU connected slot" comment referring to the M2_1 socket? Or is it referring to the PCIE2 (5.0 x16) slot? Or both? I want to make sure I know exactly which sockets and/or slots I need to keep unused. 2. I plan to connect M.2 NVME SSDs to the M2_2 and M2_3 sockets (which I assume are the chipset sockets). Doing that should allow me to still use all 8 SATA connections because they are NVME, right? 3. Any specific M.2 NVME brands/models you can recommend that 100% work with hitting the lower power c-states? 4. Typically I've used SSDs for my appdata drive and for a downloads/cache drive. If I stick with that setup here with my two planned NVMEs, which one should I put in the PCIe Gen 4 socket? 5. I'm also wanting to hook up an Intel P4510 NVME SSD to the PCIE5 (3.0 x16) slot, via a PCIE to u.2 adapter. The idea is this drive can be for 24/7 security camera recording and Plex transcoding, due to it's high endurance. Does anyone know if that specific drive will cause an issue with me reaching the lower power c-states? 6. If I decide in the future I need more HDDs, I would plan to add an ASM1166 to the PCIE3 (4.0 x16) slot. Is that the right slot for it? 7. I'm assuming that there is no such thing as a 10gbe network card that supports ASMP? And none of the newer LSI cards support ASMP, correct? Appreciate any insight you can give!
-
It looks like the above 'extra params' fixed the issue. And I realized that there is a general setting under the docker service in unraid where one can enable log rotation. I'm considering this issue solved via one of those two methods.
-
Just to confirm my suspicion, my docker log check today shows that it is indeed growing by 28.3MB every time my container runs (which is daily). Any thoughts from anyone? Is there a better spot I should be asking this sort of question? *Edit: I'm going to give this suggestion a try, and then will report back:

-
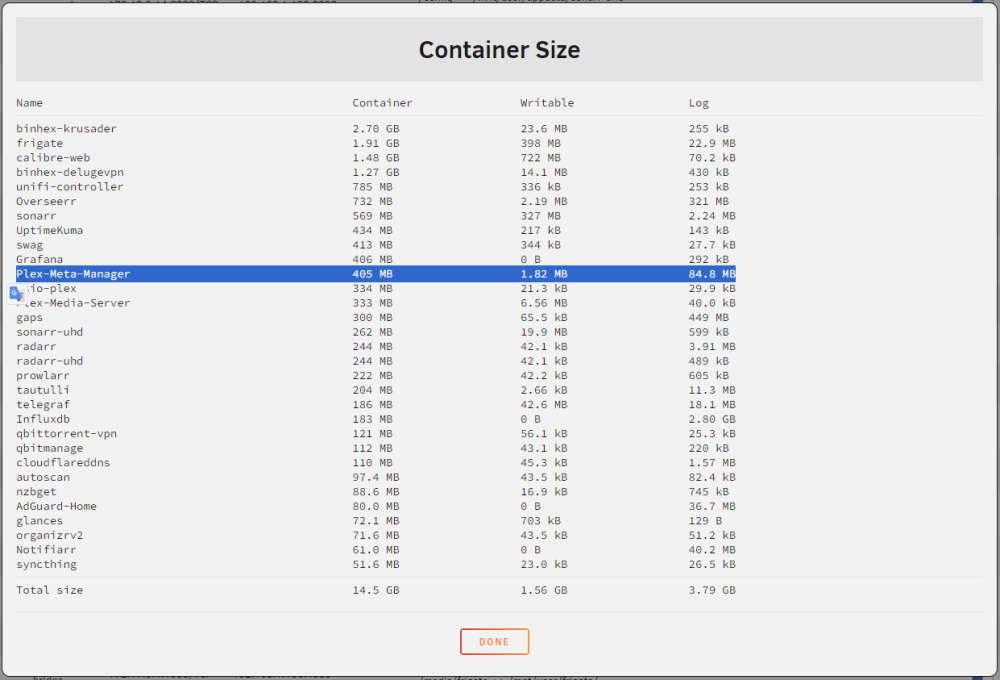
Hi all - So I'm running UnRAID v6.11.5, and am noticing an odd issue with one of my docker containers. I noticed over the past half a year that my docker memory utilization had been slowly but steadily creeping up from ~50% to 87% with no new docker containers being added to my server. When I hit "Container Size" in the GUI on the Docker tab at the point it reached 87%, I realized that Plex-Meta-Manager was showing ~16GB used in the 'Log' column. After some quick Google searching (and searching this forum) it sounded like it could be something misconfigured with that container, or some corruption that was causing the docker.img to get slowly flooded with logs from that container. So a few days ago, I ended up completely removing that container/image and started with a fresh one. With the new container up and running, the log size initially went back to 0 KB. However, the way I use this container is at 6:00am every day, it runs to update the collections and overlays of my Plex libraries. I'm already recognizing a pattern where each day (i.e. each 6:00am run) the log size grows by ~28.3MB. I'm on day 3, and so the log size is currently back to 82.8MB (see screenshot below). But I suspect it is just going to keep growing steadily until it eventually caps my docker utilization if I don't find a proper fix. I've attached my diagnostics file. Is there anything that looks off in my configuration of that docker container that may explain why the space consumed by logs just slowly gets more and more consumed after each daily run? (I've checked with other UnRAID users in the Plex-Meta-Manager discord server, and none of them report seeing slowly inflating log sizes). (As an aside, InfluxDB seems high too at 2.80GB, but I don't think I've noticed a pattern yet on that one growing steadily every day. Would be curious to hear if something looks off with that one as well.) magicserver-diagnostics-20240129-2043.zip
-
Not sure if my issue is tied into the (hopefully soon) forthcoming fix, but I realized my mover was not running in v6.11.5 recently. My leading theory was that there might be an issue with me having two cache drives (one for appdata, which I call 'cache' and one for downloads which I call 'download_drive'). In the case of the following setting: Only move at this threshold of used cache space If I have that set to 50%, is it waiting until both drives reach 50%? Is there a way to trigger it based on just the 'download_drive' specifically, in my case.

-
So twice now in 7 days, I've had my unraid server suddenly lock up (where the GUI takes 1-2 minutes to load a page, and I can see the CPU and RAM usage are at 100%). Both times it has happened around ~6am or ~7am in the morning, and when I started turning off docker containers one at a time - it was the Plex Media Server docker (repo: plexinc/pms-docker) that allowed my CPU to drop back to ~20% when I stopped the docker container. That makes me think that the Plex container is the culprit of my lockups. Does anything stand out to anyone in my attached diagnostics file? I do have my Plex transcodes sent to /dev/smh - not sure if that is related? Another theory is that some recurring task in Plex (maybe end credit detection?) is consuming all of my CPU or something in that 6am or 7am window? Regardless, I'm curious to see if those better than I at log-reading might see anything of note. Appreciate any help and insight you can give! magicserver-diagnostics-20230805-0838.zip
-
Hi all - So twice now in 7 days, I've had my unraid server suddenly lock up. By lock up, I mean that it takes ~1-2 minutes to load the GUI dashboard, and I can see that CPU is at 100% and RAM is at 100%. Both times it has happened around ~6am or ~7am in the morning, which may be a sign of a pattern. And both times, turning off my Plex Media Server docker (repo: plexinc/pms-docker) allows my CPU to drop back to ~20%. But then a full server restart still seems required to release my RAM usage back to normal. That makes me think that the PMS docker might be related and/or causing the issue, but in case there might be some other issue, I figured it prudent to post my diagnostics file here. Does anything stand out to anyone? I do have my Plex transcodes sent to /dev/smh - not sure if that is related? Another theory is that some recurring task in Plex (maybe end credit detection?) is consuming all of my CPU or something? Regardless, I'm curious to see if those better than I at log-reading might see anything of note. Appreciate any help and insight you can give! magicserver-diagnostics-20230805-0838.zip
-
I'm curious - do you both still have this issue? I'm on UnRAID 6.10.3, and would like to upgrade to 6.11.x at some point soon, but I'm worried it's going to mess up my Syncthing docker container. Also, question for everyone: What 'network type' did you select for your Syncthing docker container?
-
So I changed it to "3.0 (qemu XCHI)" - hopefully that is the recommended one out of the two 3.0 options that were listed? After changing, I restarted the VM, and it seems like Z-Wave JS and Zigbee2MQTT connections are holding strong in Home Assistant, and I can still see all the end devices. Hopefully that means the switch didn't cause any issues with the existing ports? One interesting thing is my list only shows 3 line items now when I ran the command you gave me again: Is there any command I can run to verify I have 11 open USB ports now? Or I guess just something I'll find out for sure on when I plug in the Coral TPU via USB next week?

-
Ah, I see. This is the result I get: I do indeed have USB Controller set to 2.0 (EHCI). I think for now I'll keep the two USBs linked as devices. However, if I run into issues in the future (like those with Conbee II are), and want to switch to serial-only for both USBs - what port numbers do you recommend I assign to each of those USBs (based on my above screenshot)? As an aside (and a dumb question): I am expecting to finally get a Coral TPU next week to use with Frigate in my Home Assistant VM. It will be USB connected, and I was planning to run it in 'device' mode via USB manager. Am I "out of" USB ports that I can pass through to my HA VM? Is that an issue whether I run it via device mode or serial-only?

-
Can you expand on "needs to be available on the guest"? On one of my attempts, I thought I tried changing the 04 to 05 on one of the USBs, but it still didn't seem to work. Maybe there was an additional step I needed to take for the guest availability aspect? Knowing that I'm not using Conbee II, are there other benefits of switching to serial-only? I'm starting to wonder if device-mode seems to work with my USBs in unRAID 6.10.3, should I just let it lie as-is?
-
Hmm, so I tried a couple detach/attach, and it didn't seem to help. However, I toggled off 'Connect as Serial Only' for both USBs - to put them back into device mode - and it seems to be working ok now? unRAID shows "Connected(Device)" again for both USBs - see below. And as far as I can tell, Z-Wave JS and Zigbee2MQTT inside HA don't show any errors - and my Z-Wave and Zigbee devices seem to be all in working order and connected. What behavior/error should I be on the lookout for to determine if switching to 'Serial Only' is even required for me? Was that only needed for Conbee II, and doesn't apply to the types of USB devices I have? In case it matters: In my specific case, my two USBs have the exact same controller/ID: "Silicon Labs CP210x UART Bridge". Does that preclude me from being able to run both as serial or something? Or does it mean I don't even need to bother with serial-only in the first place?

-
So I think I'm still having an issue with one of my USBs, after following the instructions of switching them to serial mode. This is what I see in USB manager after doing an upgrade to unRAID 6.10.3: Any thoughts on what else I could try?

-
Are you potentially having the same issue I did here? Where 100MB wiredtiger log files just continue to accumulate and fill it all up? I'd recommend you dig through the appdata folder and see if you see them. https://forums.unraid.net/topic/78060-support-linuxserverio-unifi-controller/?do=findComment&comment=1154741 I had to blow away my entire container, deleted the appdata folder, reinstall it, and then restore from an old backup to get it working again. If you are indeed having the same issue, I'd be really curious to hear from others on why this seems to suddenly happen to people. It's literally a drive and server killer.
-
Does just the torrent container need to be stopped, or do I need to stop the entire docker service and VM service? What's interesting through is that my 'Data' has always been filled with seeded torrents, and my cache drive utilization used to always drop in the morning after the mover run. One change I did make a few weeks back was switching from the 'delugevpn' docker to the 'qbittorrent-vpn'. (I had been previously running the deluge one for years.) Do people set up some of sort of script to stop the torrent container when the mover is running - and maybe that was something I set up with deluge years ago and forgot about? For completeness, I've attached my latest diagnostics file with the mover logging enabled. magic-diagnostics-20220811-0930.zip
-
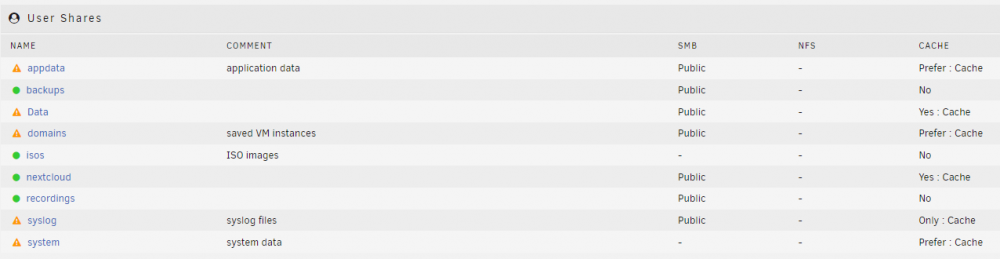
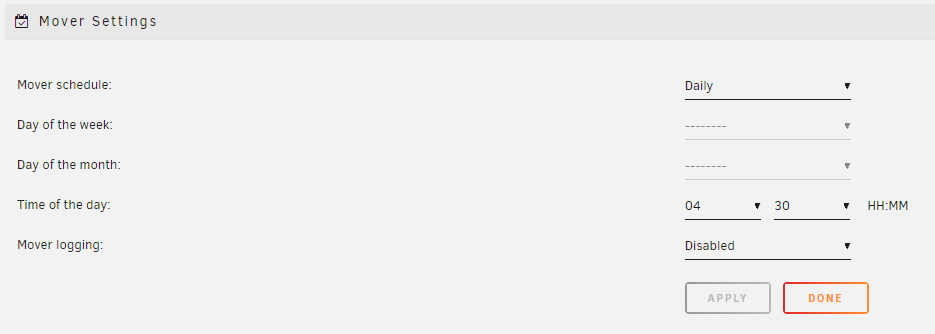
So I could be wrong, but am trying to pinpoint the exact root cause here. I've been using Unraid for a couple years with no cache drive issues previously (and am currently on version 6.9.2), but I've noticed in the last week or so that my cache drive (a 500GB SSD) is staying "fuller" than usual. My theory is that the Data folder is not consistently being moved from the cache to array? In looking at the shares I have set up, the cache ends up holding appdata (65GB), domains (11GB), system (44GB). And then Data will temporarily store itself on cache (in theory), before moving to the data drives once a day via the scheduler. However, I currently see 384GB of it filled: By doing some digging, I found that the Data folder on the cache drive is currently holding ~246GB of files (it's all >Downloads>completed from my various 'arr applications). That Data, plus all of my shares marked "Prefer:Cache" seems to add up to roughly the 384GB on drive space used. However, when I total up all of the new files that have downloaded in the last day (i.e. what should be at most temporarily sitting in the cache drive's Data folder), it only adds up to ~5GB. And when I look at the cache drive's Data folder, I'm seeing torrent files that were downloaded ~9 days ago still in there. I have the mover scheduled to run at 4:30am daily: I've attached my diagnostics file. Would it be helpful for me to enable mover logging, and then post another diagnostics file in the morning after the 4:30am trigger occurs? Any help is appreciated! magic-diagnostics-20220810-1639.zip