


jbartlett
Community Developer
-
Joined
-
Last visited
Everything posted by jbartlett
-
I'm working on adding proper ZFS support. It's turning out to be a lot more than just adding the ZFS utilities to the Docker, ZFS itself is fighting my benchmarks because it's such a damn good one for trying to make things run or look like it's running faster.
-
That was weird. I pushed .8 but even after force updating the docker, it still reflected .7. Rebuilding didn't fix, I had to edit one of the files and add a line feed for it to push .8 out. Please try now.
-
I had that happen on the version I'm working on trying to add ZFS benchmarking but not on the version you are using. I backported that fix, please update your Docker and try again. The version should reflect version 2.10.9.8.
-
Ah, I see what you mean now. I don't have a system with more than 9 drives so I've never ran into this situation. I can probably resolve this by zero padding the drive number ("Disk 01" instead of "Disk 1") and then replacing " 0" with a space after the sort.
-
1. It sorts by assigned drive label putting the Parity first, then data drives, then cache drives. It probably puts pools after that, haven't tested the scenario yet. Then it's by drive letter. The main page showing the drives assigned to a controller is in controller port number sequence, as is the controller info page. 2. Interesting idea. As of now, you can toggle the visibility of a graph item by clicking on the drive in the legend.
-
I added partial support for CD-ROM's in displaying them on the controller page but it required a lot of checks to be added throughout the app. This particular issue doesn't happen for me on my dev & prod system so not sure why it's happening for you but I added the CD-ROM check there. Please update and try again. It will reflect version 2.10.9.7
-
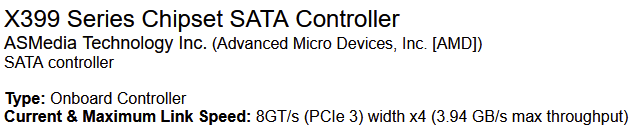
Yup, that looks to be a bug! The x4 should be displaying 3.94 GB/s. The values are pulled from the controller card, so it would always report PCIe 3 even in a higher slot. Though now I wonder if I can get the slot values....
-
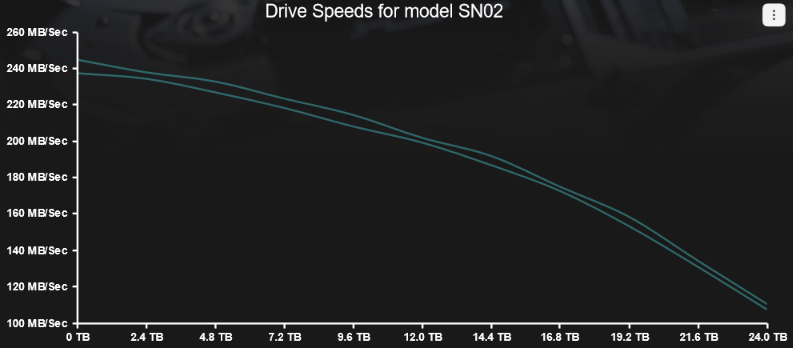
@johnsanc - Actually, I just added the PCIe version to the display. If you refresh the app, it should reflect version 2.10.9.6 and viewing the controller page will display the PCIe version if the controller reveals the data. And WOW on those speeds on the ST24000NM000C at the high end. Goes to show you that capacity isn't all that's cracked up to be.
-
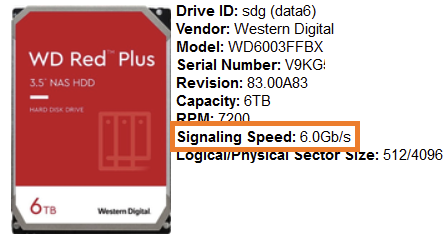
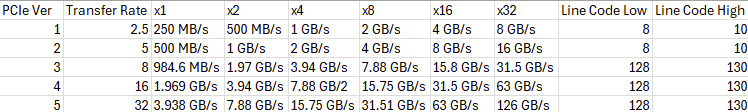
1. I can look into doing both, benchmarking all drive controllers at the same time along with benchmarking certain drives across the entire system at the same time. 2. You can view the signal speed of a drive here That data is as current as the last controller scan so if you suspect a drive has dropped to a lower signaling speed, rescan the controllers and then view the drive in question again. 3. They can both have 7.88 GB/s if one is on PCIe 3 and the other on PCIe 4. Here's the chart I have coded in, the value displayed is a cross reference between PCIe version & connection. The values were pulled off of some website ages ago, and looks like I need to add an entry for PCIe 6. I guess adding the PCIe version would help but you can reverence the GT/s value with the transfer rate column to see which one it is.
-
Please try again. I believe it is resolved now. If you still get an error, please let me know what drive vendors you have (Seagate, Samsung, etc.)
-
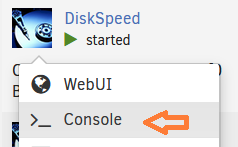
Click on the DiskSpeed icon in your Docker apps and select "Console". Then enter the following command with replacing xxx with the drive ID and see if you get the expected speeds or the slower ones. Press CTRL-C to stop. dd if=/dev/xxx of=/dev/null bs=1310720 skip=0 iflag=direct status=progress conv=noerror
-
Are you still getting an error trying to upload the drive information? The container log is unrelated.
-
Can you open a shell prompt inside the Docker container and then enter: df -B 1KB | grep cache Reply with a screen shot of the result
-
There's a FAQ link on the Benchmark page that explains how to set it up.
-
I'd keep an eye out on that green one with the dip at the end, especially if it's the same model as the others. If another benchmark on that drive shows the same speeds, you will be limited by that drive like you were by sdi. Parity will follow the speeds of the lowest/slowest drive. Keep in mind that you'll also want to do a controller benchmark (click the i icon to the right of the controller label). It doesn't matter how fast your drives are, if they can serve up data faster than your controller can handle, it won't be able to keep up with all drives active. The screenshot by JorgeB is an example of this. Note that this is really only a hindrance during parity or other highly data intensive operations, you'll likely never run into this issue otherwise.
-
Please update the app, it should reflect 2.10.9.2. This issue should be fixed. If you encounter any further errors, I just need the line number block, don't need the stack trace.
-
Version 2.10.9 push to all Update Lucee to the version 6 branch Update Vendor identification Add opt-in/out data collection of SMART data Add detection for invalid hardware configuration file, rescan hardware to recreate if true Add timeout to fetching Vendor & HDDB info during hardware scan process
-
Version 2.10.9 beta is available, you can try it by editing your docker to specify repository "jbartlett777/diskspeed:2.10.9". You will see the following information after updating and launching the application. I'm confident that it'll be fine but I only have two servers to test with. New Feature: Drive S.M.A.R.T. Data Collection Soon, the drive health history data from BackBlaze will be displayed on this applications companion site, the Hard Drive Database. This data reveals reliability trends of hard drives used by BackBlaze such as how often a particular model fails each year. I would like to contribute to this data analysis effort by tracking the SMART data by users of the DiskSpeed application. If you chose to Opt In to this, the SMART data will be collected every time your hardware is scanned by DiskSpeed and anonymously uploaded to the HDDB server. Any subsequent upload of a drives SMART data will overwrite the previous so only the most recent is stored. Each drive is identified by a SHA1 hash of it's vendor, model, revision, & serial number. You may change your choice to either Opt In or Out on the Hardware Scan screen. Upon Opting Out, you also have the choice to remove your SMART records from the HDDB server. Preview of SMART submission Drive ID: d76ade9264e2b7ca0f90c1a28e29eae30b1feb29c { "nvme":0, "ssd":0, "model":"WDC WD6002FFWX-68TZ4N0", "rev":"83.H0A83", "bytes":6001175126016, "smart":[ { "id":1, "name":"Raw_Read_Error_Rate", "normalized":100, "value":0, "string":"0" }, { "id":2, "name":"Throughput_Performance", "normalized":137, "value":104, "string":"104" }, { "id":3, "name":"Spin_Up_Time", "normalized":152, "value":21506818423, "string":"375 (Average 488)" }, { "id":4, "name":"Start_Stop_Count", "normalized":100, "value":731, "string":"731" }, {"sniped for brevity in this post"}, { "id":199, "name":"UDMA_CRC_Error_Count", "normalized":200, "value":0, "string":"0" } ] }
-
While optimized to run under Unraid, it does try to support other OS's.
-
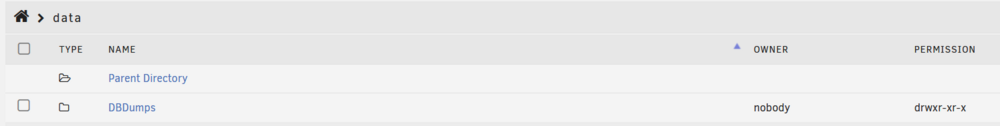
Running ZFS Master on 6.13.0-beta.2 When creating a new Dataset, the directory does not have write permission granted on it. Requires manually adding the permission to be usable in a SMB share.
-
Somehow, your config files were corrupted and the quickest way to force a rescan of your hardware when you can't even view the page is to update the docker. I have logic that detects that and forces a hardware scan. I'll see about adding logic to catch this in the future. Thank you for reporting it.
-
This shouldn't happen, the CONFIG structure should exist for every drive. Can you try doing a "force update" on the Docker tab for DiskSpeed and relaunch, you should see it say "Scanning hardware" before displaying the normal page. If it still fails, please use this URL and update it to reflect your UNRAID's IP to create a debug file and PM it to me. http://[IP]:18888/isolated/CreateDebugInfo.cfm
-
FYI I've been running into this ever switching to the built in Aquantia 10GB nic. /etc/rc.d/rc.inet1 stop /etc/rc.d/rc.inet1 start /etc/rc.d/rc.inet1 restart Found the answer here:
-
Please update your DiskSpeed docker container. I added logic to catch this rare issue.
-
Can you email/dm me a new debug file? I've enhanced the logging since the previous one to include more detail for me to look at.


