





sota
Members
-
Joined
Everything posted by sota
-
Think I'll take some "time off" from plotting, to let the harvester drive clear out (my final plots drive is on a USB 2.0 connection for the moment. yea, that sucks BIG time.) The cable to connect the MD1000 should arrive today, so i'd need to take the farm down anyways to install that, after I test it in the other box. I can also swap out the 6x 146GB drives for 300GB drives, AND since I've figured out how to use the SATA port in the DL380G6 to run a HDD instead of a CD-ROM drive (hint: small adapter) I'm going to try and backup/restore/clone the farm's OS drive from the 2x72GB array on to a small SATA drive, thereby freeing up 2 more slots in the server. that'll give me 16x 300GB SAS DP 15k to play with.
-
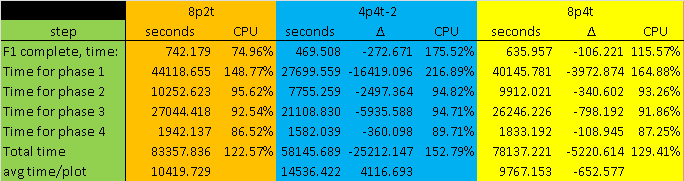
Here's what I mean by the inconsistency. In every case, the group of plots was started within a second of each other, via script. I highlighted the "flyers" in each group. 8p2t (lost a log file someplace) Starting phase 1/4: Forward Propagation into tmp files... Sat May 22 13:45:06 2021 Total time = 85716.351 seconds. CPU (122.120%) Sun May 23 13:33:43 2021 Total time = 85863.223 seconds. CPU (122.130%) Sun May 23 13:36:23 2021 Total time = 78384.231 seconds. CPU (123.310%) Sun May 23 11:31:52 2021 Total time = 84997.331 seconds. CPU (122.100%) Sun May 23 13:22:21 2021 Total time = 77962.652 seconds. CPU (124.000%) Sun May 23 11:25:14 2021 Total time = 85872.535 seconds. CPU (122.010%) Sun May 23 13:38:11 2021 missing Total time = 84708.527 seconds. CPU (122.320%) Sun May 23 13:18:57 2021 4p4t Starting phase 1/4: Forward Propagation into tmp files... Sun May 23 16:07:06 2021 Total time = 59364.822 seconds. CPU (153.660%) Mon May 24 08:36:30 2021 Total time = 58580.536 seconds. CPU (154.300%) Mon May 24 08:25:34 2021 Total time = 54933.449 seconds. CPU (149.910%) Mon May 24 07:24:47 2021 Total time = 59703.949 seconds. CPU (153.280%) Mon May 24 08:44:17 2021 8p4t Starting phase 1/4: Forward Propagation into tmp files... Mon May 24 09:07:54 2021 Total time = 80690.536 seconds. CPU (127.290%) Tue May 25 07:32:44 2021 Total time = 79739.562 seconds. CPU (128.200%) Tue May 25 07:16:53 2021 Total time = 76036.094 seconds. CPU (131.050%) Tue May 25 06:15:10 2021 Total time = 76768.785 seconds. CPU (130.680%) Tue May 25 06:27:23 2021 Total time = 75913.641 seconds. CPU (131.380%) Tue May 25 06:13:08 2021 Total time = 79979.292 seconds. CPU (128.010%) Tue May 25 07:20:53 2021 Total time = 76380.811 seconds. CPU (130.990%) Tue May 25 06:20:55 2021 Total time = 79589.050 seconds. CPU (127.680%) Tue May 25 07:14:23 2021 Actually, now that I look at this on-screen like this, the 3rd and 5th in each group was a flyer. 6th appears to be one of the slowest. I wonder why the discrepancy. switching 8p2t to 8p4t shaved 1.45 hours off the total time for 8 plots. 4p4t is the fastest through P1 and P2. -2 definitely helps P3 and P4 to charge through. Working through some mental math: If I had an ideal setup, 4 plots 4 threads each, started every 10 hours (to get past P2), 16 hours for the 1st 4 plots to arrive, 4 plots ever 6 hours after that. that's 16 plots every 24 hours. I'd need 8 P1/P2 disks, and probably 4 P3/P4 disks. I could maybe make the P1/P2 start time every 8 hours, the assumption being that I can steal "time" during P2 for the new P1, but the big problem is NOT affecting the P3/P4 time window. That's the one that'll determine how fast my plotting can go. Really I need more cores/threads, but unless someone wants to send me a pair of X5680 chips for free, that ain't happening.
-
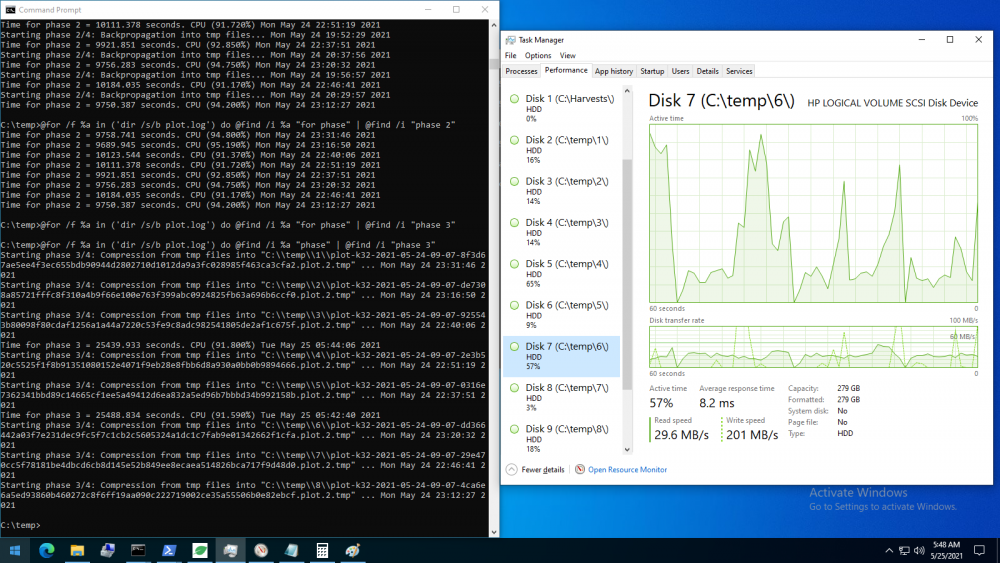
nearing the end of phase 3 right now. that's one of the lower write speed peaks I've seen. 350MB/s isn't rare. what I still find interesting is the inconsistency of phase completion across processes. it doesn't seem to trend with any specific disk/excuted thread. only thing I can think of is, the system's background housekeeping/foreground interface processes are asymmetrically latching on to specific cores/hyperthreads and causing contention. Phase 3 should end within 30 minutes from now, and I should have the completed data from this run in by 7am, according to my estimates.
-
Yea if you could get it to leave the file in whatever you place as -2 (since that's where it builds the final file anyways. it's just the same as -t if you don't specify it) then I could dynamically change the rolling script to move to the next storage drive. Or, and this is where unRAID could play a role, load up a bunch of disks into a no-parity array, point -2 to the share/mount for all the disks, let them fill up over however long, pull 'em out, make a new array with new disks, rinse and repeat. Or just keep buying/building 30 disk unRAID boxes The ability to not move the .plot file multiple times would be sweet.
-
Related to what we're both discussing casually.
-
final is "slow" storage comparatively, and the goal would be to return the drives/process back to making more plots. put the final move in the background basically. I wish chia had a flag option to leave the final plot in the temp folder, and let people move them manually. plus the final drive will change as it fills up.
-
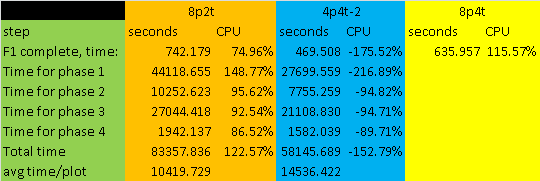
no in this case, it's set up to just monitor my "harvester" directory, and move any completed plots to their final destination. going to try and stuff some data into excel, so I can past it cleanly now.
-
robocopy "source" "destination" /mov *.plot /mon:1 using that little nugget now. I also, for giggles, spun up some REALLY decrepit computers.... hp dc7900 and 8000 elite USDT's. one of them just posted a plot that I started almost 4 days ago.
-
given how much abuse an SSD will take from this (3TB total r/w each plot) it seems a bit silly. I kinda wish I had a machine here with a LOT more ram available... I'd try and set up a 300GB RAM drive. From watching the processor loading though, I get the feeling the program has some serious speed humps in place, that prevent it from really cooking along.
-
tons.
-
initial notes on the new 8-plot 4-thread run: CPU % times for all 8 processes are bouncing from 8-12%, which seems appropriate. Disk speeds for all 8 disk are peaking over 350MB/s and are able to hold that write rate (SAS 15k DP FTGDMFW ) F1 compute times have no discernable pattern; 8p/2t was 520s, 4p/4t was 781s, and this 8p/4t was 621s. theory: if it's actually viable to stagger start processes on this hardware, since all 8 don't seem to process at the same rate, for in-deterministic reasons, I could just kick off 8 looping processes, and let them naturally drift apart, sort of like SpaceX's StarLink satellites after deployment.
-
4 threads per plot, but also only 4 plots instead of 8 simultaneously. I noticed that too about the CPU usage. I have a theory on that, but I won't have evidence until I run my next test. One thing I observed is that only 2 of the 4 'chia' processes would ever show 20% CPU at a time. the other 2 would show 6-10%, and then they would flip. IIRC, when I ran my first 8-plot test I was seeing 11-12% on 4 at a time, and 5-6% on the other 4, then they would flip. It'll be interesting to see what happens next. 2nd temp gets used on phase 3, when the final plot tmp file is created, and phase 4 when the checkpoints are added. My guess is drive thrashing is minimized. I was just watching the reported drive throughput on the 'harvester' drive, and it looked like at least a 250MB/s average write rate. I saw it holding north of 350 for a while there, with 100% duty cycle, but I think that's because 2 plots were getting their final move on to that disk. I also checked memory and there was a couple GB chunk that was tagged basically as disk cache. I've got 144GB ram, it can use as much as it wants for that. My next run will be 8 plots, no -2 drive, 4 threads each. that's technically over subscribing the processors, but I want to see what happens. So far though, 8 in 24 is faster than 4 in 15.
-
So an interesting result. 1st of the quartet ended a little while ago. Starting phase 1/4: Forward Propagation into tmp files... Sun May 23 16:09:13 2021 Total time = 54933.449 seconds. CPU (149.910%) Mon May 24 07:24:47 2021 elapsed: 15:15:34 added 2 trimmed log files so you can see the time differentals. 0.txt 1.txt
-
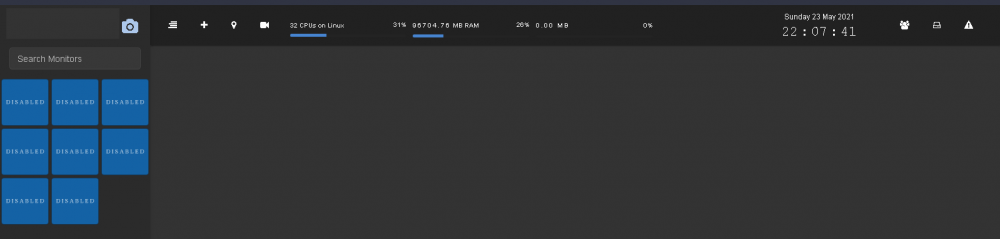
3am this morning Shinobi stopped recording all of my cameras, and the web UI shows all the monitors as 'disabled.' if I go into the properties of each, they're all marked correctly; either 'watch' or 'record', but none are doing their tasks. Thinking maybe my storage drive took a dump, I changed it out, and it recorded for about 5 minutes. All of that footage is totally worthless as it's corrupted. Anyone else suddenly having problems? ETA: I just realized while I was poking for the backups, I run a backup once a week, at 3am, and it ran this morning. only shinobi appears to be affected. going to attempt to just restore shinobi from last week. ETA2: ok, didn't complete the restore. noticed the database folder was 906MB in size. -rw-rw---- 1 100 console 801112064 May 23 18:40 Timelapse\@0020Frames.ibd is the biggest offender. stopped the container, renamed that file (for now), started it, and now it's recording again. none of my monitor groups are working though. I can live with that for now, as I really only use shinobi to do 24/7 recording of the cameras, and take stills every 6 seconds or so. ETA3: monitor groups started working again, after I manually added a couple cameras to the view.
-
Once I get things a little more nailed down I might.
-
funny you should ask... ---------- PLOT1.LOG F1 complete, time: 757.709 seconds. CPU (72.7%) Sat May 22 13:57:44 2021 Forward propagation table time: 6293.351 seconds. CPU (152.920%) Sat May 22 15:42:38 2021 Forward propagation table time: 7105.469 seconds. CPU (148.590%) Sat May 22 17:41:03 2021 Forward propagation table time: 8284.036 seconds. CPU (148.720%) Sat May 22 19:59:07 2021 ---------- PLOT.LOG F1 complete, time: 464.498 seconds. CPU (180.27%) Sun May 23 16:14:50 2021 Forward propagation table time: 3739.719 seconds. CPU (244.620%) Sun May 23 17:17:10 2021 Forward propagation table time: 4467.289 seconds. CPU (215.370%) Sun May 23 18:31:37 2021 Forward propagation table time: 5242.561 seconds. CPU (213.940%) Sun May 23 19:59:00 2021 some log snippets. PLOT1 was part of the 8-plot parallel group, 2 thread each PLOT is part of the 4-plot parallel group running now, 4 thread each not *quite* apples to apples, but it presents some interesting questions. I'm going to let this 4-plot complete, to gather all the data about this run, then consider doing an 8-plot with 4 threads instead of 2. One of my considerations on stuff is, I don't have much automation/scripting done yet, to handle kicking off new plots and moving the resultant files automatically. I can obviously develop that, but it's a question of if I want to.
-
Some more data, from my 8 parallel: these were all done with: plots create -k 32 -b 4096 -u 128 -r 2 -t C:\temp\$num -d C:\Harvests -n 1 ---------- C:\TEMP\1\PLOT1.LOG Time for phase 1 = 44720.749 seconds. CPU (148.630%) Sun May 23 02:10:27 2021 Time for phase 2 = 10853.645 seconds. CPU (95.530%) Sun May 23 05:11:21 2021 Time for phase 3 = 28166.616 seconds. CPU (92.740%) Sun May 23 13:00:47 2021 Time for phase 4 = 1975.339 seconds. CPU (86.720%) Sun May 23 13:33:43 2021 ---------- C:\TEMP\2\PLOT1.LOG Time for phase 1 = 45075.196 seconds. CPU (148.010%) Sun May 23 02:16:35 2021 Time for phase 2 = 10780.690 seconds. CPU (95.900%) Sun May 23 05:16:15 2021 Time for phase 3 = 27969.140 seconds. CPU (93.110%) Sun May 23 13:02:25 2021 Time for phase 4 = 2038.196 seconds. CPU (86.780%) Sun May 23 13:36:23 2021 ---------- C:\TEMP\3\PLOT1.LOG Time for phase 1 = 42908.333 seconds. CPU (149.070%) Sun May 23 01:40:37 2021 Time for phase 2 = 9027.629 seconds. CPU (95.950%) Sun May 23 04:11:04 2021 Time for phase 3 = 24550.606 seconds. CPU (91.330%) Sun May 23 11:00:15 2021 Time for phase 4 = 1897.660 seconds. CPU (84.620%) Sun May 23 11:31:52 2021 ---------- C:\TEMP\5\PLOT1.LOG Time for phase 1 = 44045.933 seconds. CPU (149.110%) Sun May 23 01:59:50 2021 Time for phase 2 = 10892.142 seconds. CPU (95.000%) Sun May 23 05:01:22 2021 Time for phase 3 = 28165.784 seconds. CPU (92.690%) Sun May 23 12:50:48 2021 Time for phase 4 = 1893.469 seconds. CPU (87.270%) Sun May 23 13:22:21 2021 ---------- C:\TEMP\6\PLOT1.LOG Time for phase 1 = 42901.266 seconds. CPU (149.300%) Sun May 23 01:40:53 2021 Time for phase 2 = 8992.552 seconds. CPU (96.250%) Sun May 23 04:10:45 2021 Time for phase 3 = 24199.397 seconds. CPU (92.320%) Sun May 23 10:54:05 2021 Time for phase 4 = 1869.429 seconds. CPU (87.010%) Sun May 23 11:25:14 2021 ---------- C:\TEMP\7\PLOT1.LOG Time for phase 1 = 44961.929 seconds. CPU (148.270%) Sun May 23 02:16:20 2021 Time for phase 2 = 10770.574 seconds. CPU (95.660%) Sun May 23 05:15:51 2021 Time for phase 3 = 28123.101 seconds. CPU (92.700%) Sun May 23 13:04:34 2021 Time for phase 4 = 2016.929 seconds. CPU (85.950%) Sun May 23 13:38:11 2021 ---------- C:\TEMP\8\PLOT1.LOG Time for phase 1 = 44217.178 seconds. CPU (149.020%) Sun May 23 02:04:06 2021 Time for phase 2 = 10451.128 seconds. CPU (95.020%) Sun May 23 04:58:17 2021 Time for phase 3 = 28136.283 seconds. CPU (92.860%) Sun May 23 12:47:13 2021 Time for phase 4 = 1903.936 seconds. CPU (87.310%) Sun May 23 13:18:57 2021 given this is an 8/16 core system, not sure there's much more I can do for phase 1. i'm running a 4 plot parallel run, no stagger, right now: plots create -k 32 -b 4096 -u 128 -r 4 -t C:\temp\$num -2 C:\temp\$num4 -d C:\Harvests -n 1 yea I know, I changed 2 things (-r and -2), so let's see.
-
There is one thing I just read some info about: the -2 second/alternate temp folder, that might be an idea to implement, as it's used during Phase 3/compress to file. ex: Time for phase 3 = 28166.616 seconds. CPU (92.740%) Sun May 23 13:00:47 2021 wonder what that would look like if -2 was another disk. guess I'll run a quartet of plots with different/specified -2 targets and see what happens. some data might shed light on, if staggering plot start times, with a common -2 target, would net an overall speed increase worth the complexity involved. some other data from the same log: Total time = 85716.351 seconds. CPU (122.120%) Sun May 23 13:33:43 2021 Copy time = 917.057 seconds. CPU (18.120%) Sun May 23 13:49:00 2021 So if I could make a substantial dent in Phase 3 time, that might be worth it, since it accounted for 32% of the total processing time.
-
I thought about RAID0'ing a pair of the 300s, but that still wouldn't help much. I doubt 2 plots in parallel on a single "drive" would be any faster really than 2 plots in parallel on individual drives. I'm not seeing this thing as being I/O bound that much really, as the disks are never being shown as worked that hard. That is unless someone has actual data showing that insane burst traffic is what the plotter wants to see. As it stands now, and as I said, I'll probably get this thing setup to do 16 parallel plots on 16 individual drives (i'm guessing in a 24 hour period, as I don't see doubling the work load on this server will even make it care, given the metrics I'm seeing), possibly get a 2nd box configured the same, and I might even try the whole linux plotter idea on the 2nd box, just to learn something new. At the very least I can then give an apples-to-apples comparison with regards to that, since there's notes that windows costs 5-10% for speed. I'm actually kind of hoping that, in a couple weeks/months there will be a glut of relatively new but used 10/12/14/18/20TB disks on the market, that I can snatch up for under $10/TB cost. Yea, I'm one of those people.
-
Since the disks are only 300GB each, I'm limited to 1 plot/drive. Agreed, there's a lot of idle time, and the disks could probably support more than 1 plot at a time in that respect (SAS DP 15k, damn well should be able to! ) but the space problem prevents that. Results are in of the 8 plots: Longest plot time: 24 hrs Shortest plot time: 22 hrs Total data moved: 3TB That was with all 8 plots started at the same time. no idea if stagger starting them will make a difference, since the temp folder for each plot has a dedicated drive. If I could find some tuning suggestions for high CPU count/high ram count machines, I'll play with them on the next pass. I was playing around with my other DL380G6 box, and discovered I can connect and use a SATA HDD connected to the cable/port that usually goes to the CD-ROM drive. If I do that, I can then dedicate 16 disks to plotting. I already have the extra 300GB disks here. If I had 600GB disks I'd try to 2 plots/drive, but I don't, and i'm not spending any $ at this point. (more on that later) I'm thinking if I stuff a 2TB SATA in there as a dump target for the plots, before they're moved to final storage, I should be able to get away with getting 16 plots in a pass. Now, regarding any improvements involving $... I'm personally getting to the opinion of, us small time farmers are screwed. The network is growing too fast, and the Time-to-Win is getting worse by the second... exponentially worse. While I'm not abandoning all hope yet, there's no way I'm going to put the finances behind trying to make a heavy go of this. I'm going to use this as platform to experiment, learn some things, get some ideas flushed out on some things I've thought about in the past (namely, using the Dell MD1000 box as a possible expansion for unRAID in the future, and the needed hardware to make that happen). but I'm not dumping 4 or 5 figures of cash into the hope I'll make any of it back. Right now, i'm "out" $50 for a controller and a cable, and those again would make the MD1000 useful in the future anyways, so not really a "loss" in that respect. I *might* pick up some 300GB or 600GB disks, just since I can use them for these servers original roles... backup hardware for my hosting server. But the writing i'm seeing on the wall for Chia isn't good, for the little guy. Maybe Pools will change my opinion, but i'm not banking on it.
-
I went the other way, and tore down my 8x300GB RAID0 array. I started an octet of plots around 1:45pm, each having a different drive for the tmp files, but a final target of the 6x146GB RAID0 array still. I like how CPU time listed for each chia process, is almost 15 hours now, yet the actual time it's been running is closer to 10 hours. Must be getting some parallel processing in there some where.
-
I need to reboot my farming machine in a little while, and tear apart the arrays. Anyone know what happens if a plotter machine can't connect to the farm's network share when the time comes for it to move the completed plot? I'm hoping it'll just leave the 100GB plot file on the plotter(s).
-
same boat here. all the gear i'm using right now, is either old/busted/retired stuff, or a spare/backup server for my primary hosting box. I did order a controller and cable ($50) to be able to attach this old Dell MD1000 chassis (15 LFF slots) to a box, and i'll be filling it with 4TB drives, since I have a large stash of them. if this pans out as something potentially viable, then great. if not, i'm out $50
-
That might be my long term plan, but i'm not a *nix guy... I muddle along as best I can with unRAID and my VyOS router... so i'm going to stick with windows farmers and harvesters for now.
-
happy to report: 1.1.6 install and started. now have multiple connections to nodes with heights > 0.

