JaseNZ
Members
-
Joined
-
Last visited
Everything posted by JaseNZ
-
Incase any body finds this helpful I always found telegraf config file full of so much that is not used. This is mine where it just has the inputs that I need, makes it easier to work on. Just note I don't have a ups so I don't use that setting. # Global Agent Configuration [agent] hostname = "box" flush_interval = "15s" interval = "15s" # Input Plugins [[inputs.cpu]] percpu = true totalcpu = true collect_cpu_time = false report_active = false [[inputs.disk]] ignore_fs = ["tmpfs", "devtmpfs", "devfs"] [[inputs.io]] [[inputs.mem]] [[inputs.net]] [[inputs.system]] [[inputs.swap]] [[inputs.netstat]] [[inputs.processes]] [[inputs.kernel]] [[inputs.diskio]] device_tags = ["ID_SERIAL"] skip_serial_number = false [[inputs.docker]] [[inputs.net]] [[inputs.sensors]] remove_numbers = true [[inputs.smart]] attributes = true # Output Plugin InfluxDB [[outputs.influxdb]] database = "telegraf" urls = [ "http://192.168.1.58:8086" ] username = "*******" password = "*******"
-
Nice glad you got it going, I am trying to sort out the [[inputs.diskio]] to report based on serial as well but no joy so far as all it reports is unknown.
-
The only thing I can think of is the old adage of rebooting the main unraid server. I am pretty sure I did not need to do anything special to get it to work with smart.
-
The only thing I can think of is where your repositry is. Check its pulling from the the Repository telegraf:latest I know when I was trying to sort nvidia-smi permissions out I found I was pulling from telegraf:alpine instead of latest.
-
Sorry did not realise your were using hdd temp, I use smartctl you get a lot more info. These are my two lines in the telegraf.conf file. [[inputs.smart]] attributes = true
-
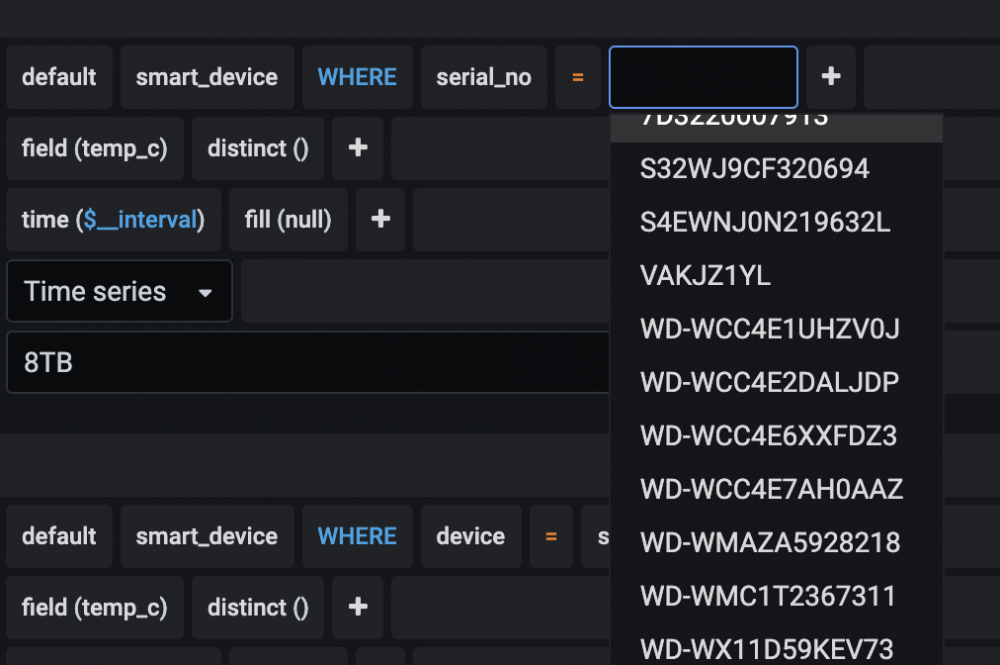
You can do it via serial number if you wanted to instead of device id.
-
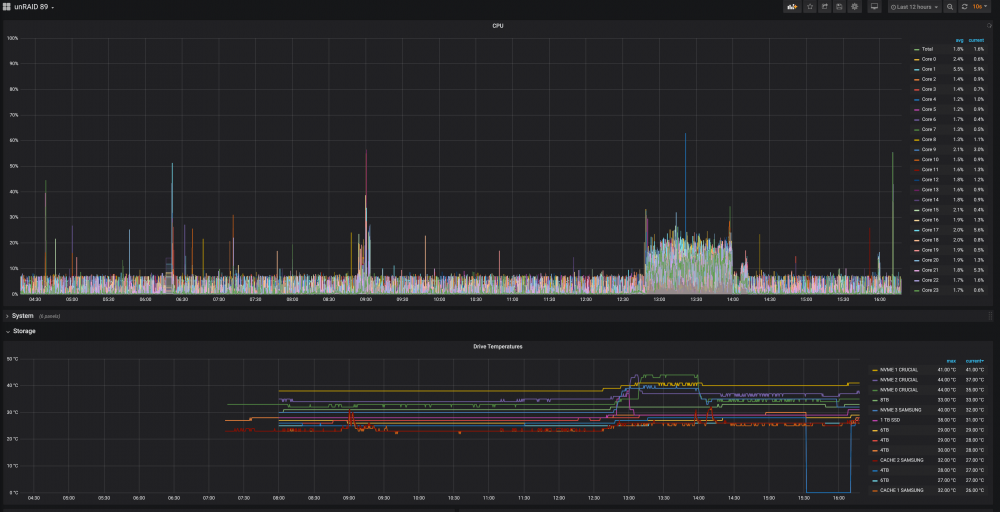
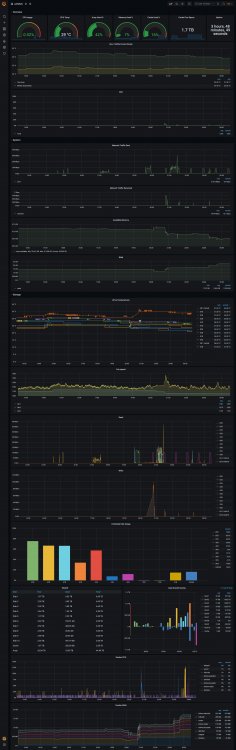
This is where I ended up with mine.
-
I should have tried that to begin with, yup all good again thanks.
-
I get the same with a fresh copy of chrome on macbook.
-
Ahhh cool cheers 😀
-
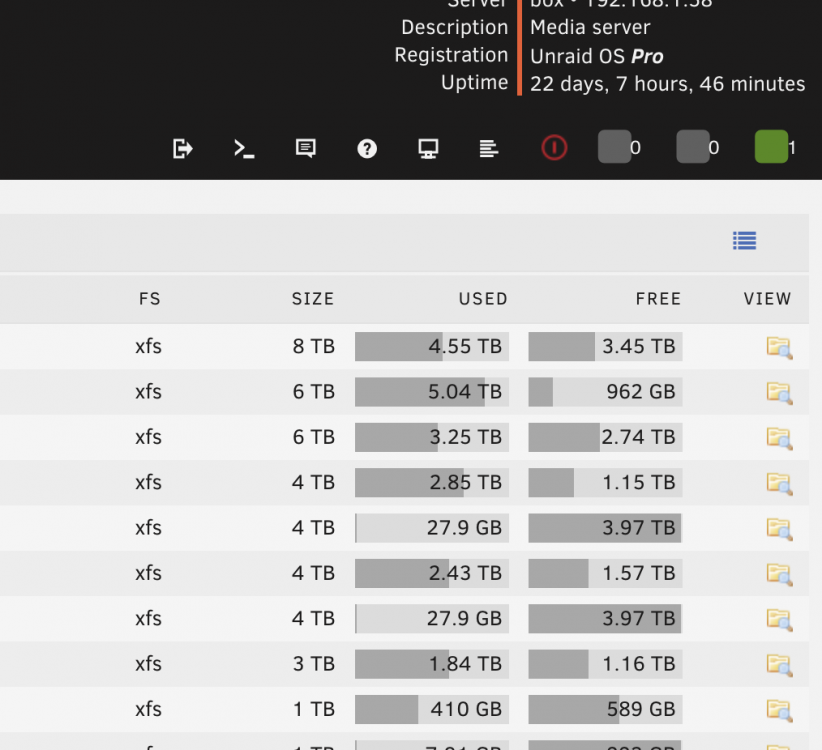
Is it just me or under main tab the icons at top are out of whack (numbers our of their boxes). Shows the same on Chrome and Safari. Seems normal on all other tabs.
-
After passing my video card through to Telegraf and selecting the option for the gpu as below I get this error. Anybody able to assist in this. --runtime=nvidia is in the container settings so this has not seemed to have helped.
-
Thanks guys will just hold off until there servers catch up 😀
-
So I wanted to contribute some of my cpu/gpu time but all I seem to get it is this error, Am i missing something ??.
-
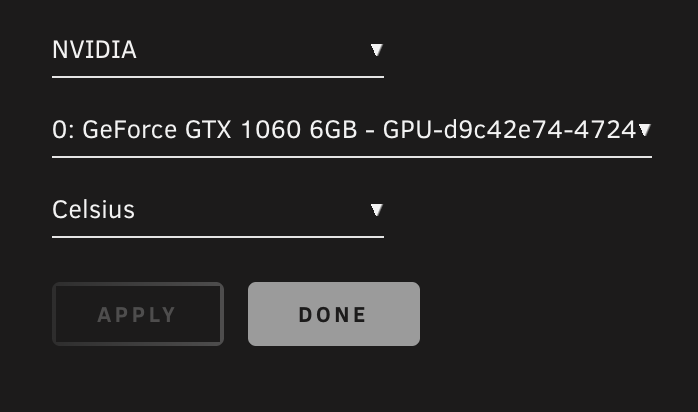
Yup same, change temp to F then back to C and apply and bingo 🙂
-
Yup mine is empty after upgrade as well, Seems to be seeing everything though.
-
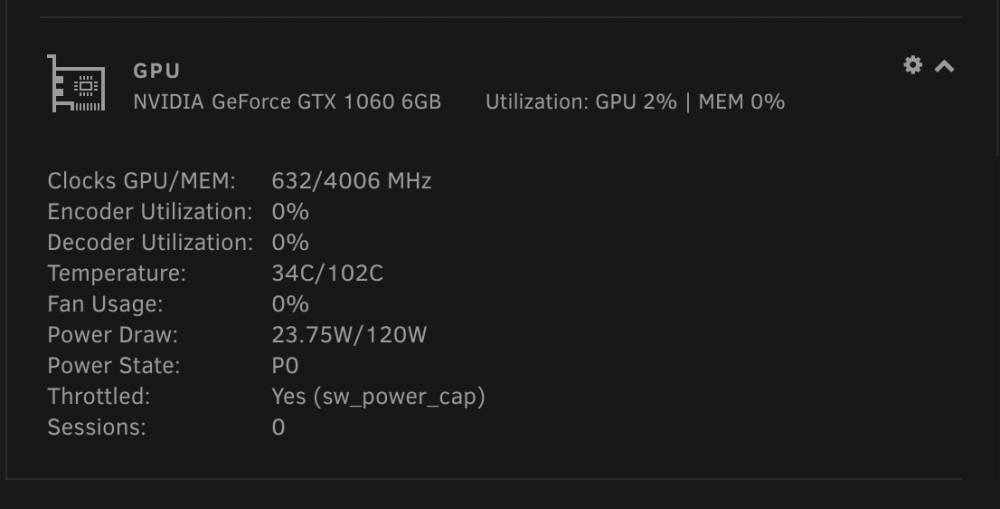
Is there anyway I can stress test the gpu to see if this is working. I tried installing handbrake with gpu encoding but see no response in activity. I don't use plex or emby so cannot use that. From the looks of it it's working just wanted something to throw some stress at it to see.
-
Have you made sure [[inputs.net]] is uncommented. If you go to your grafana config file and look for the following and remove the two ## in front of [[inputs.net]] # # Read metrics about network interface usage # #[[inputs.net]]
-
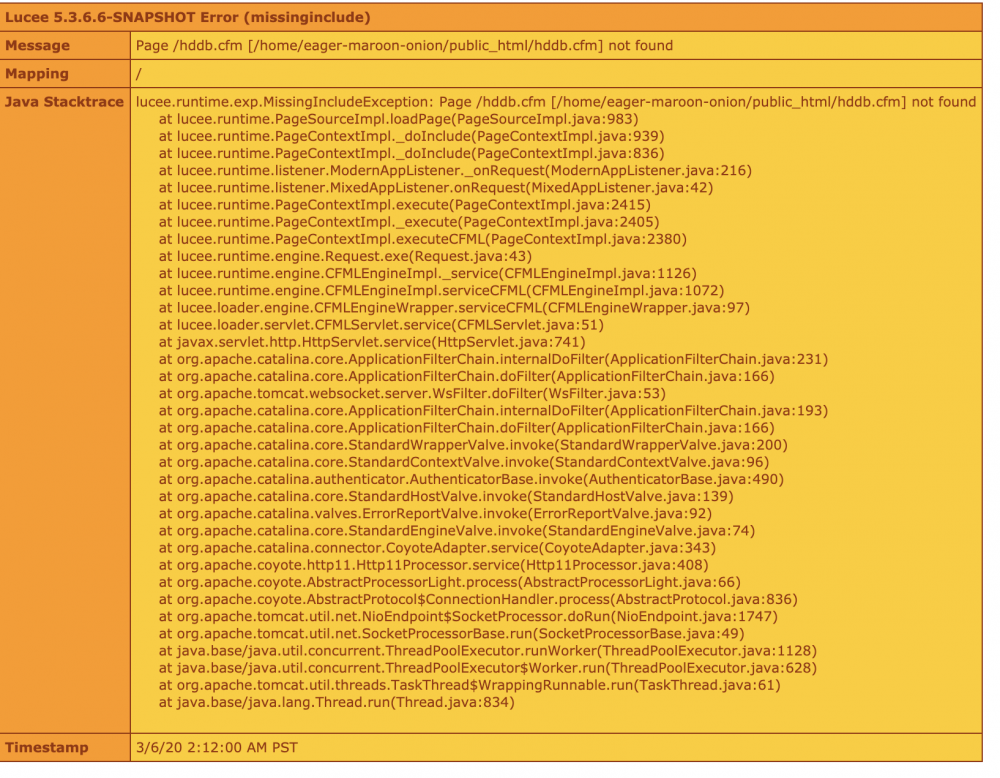
Your website does not work when looking for drive images.
-
Anybody know about getting cpu temps from Telegraf into the database. Edit : Never mind got it sorted.
-
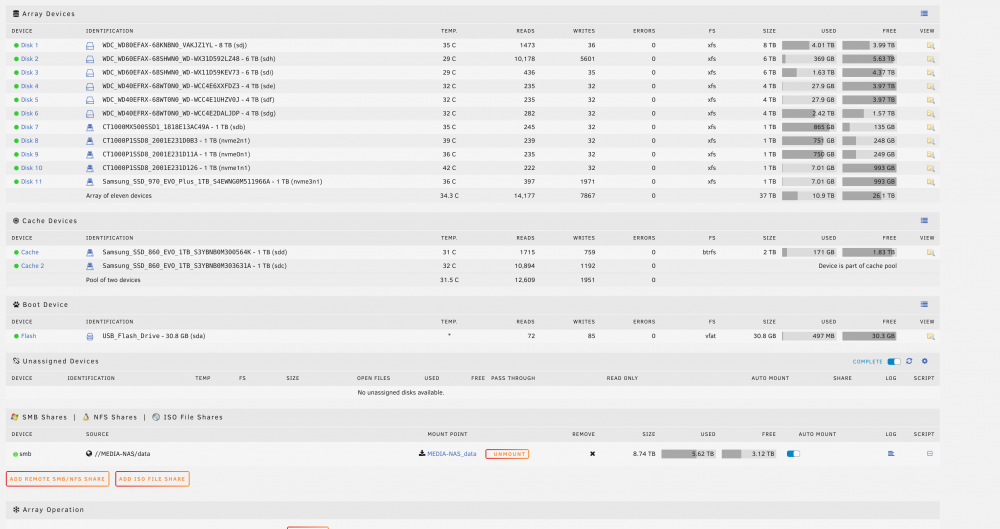
Sorry I am using 2 x 1 TB SSD's for my cache with zero issues.
-
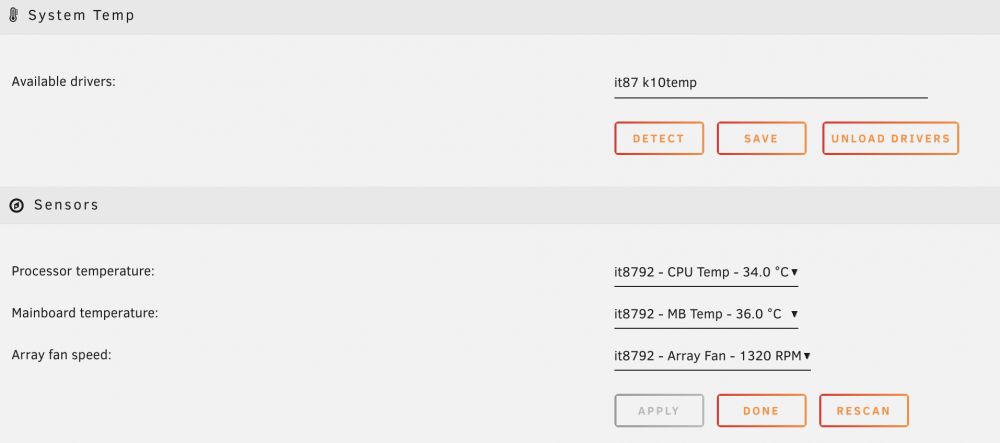
I seem to be getting my temps and fan speeds ok. I know its for a server but would have been nice to be able to change the board rgb in the bios. Version 6.8.2
-
Yeah sorry was my fault and had missed something my end. Normal operations have resumed lol
-
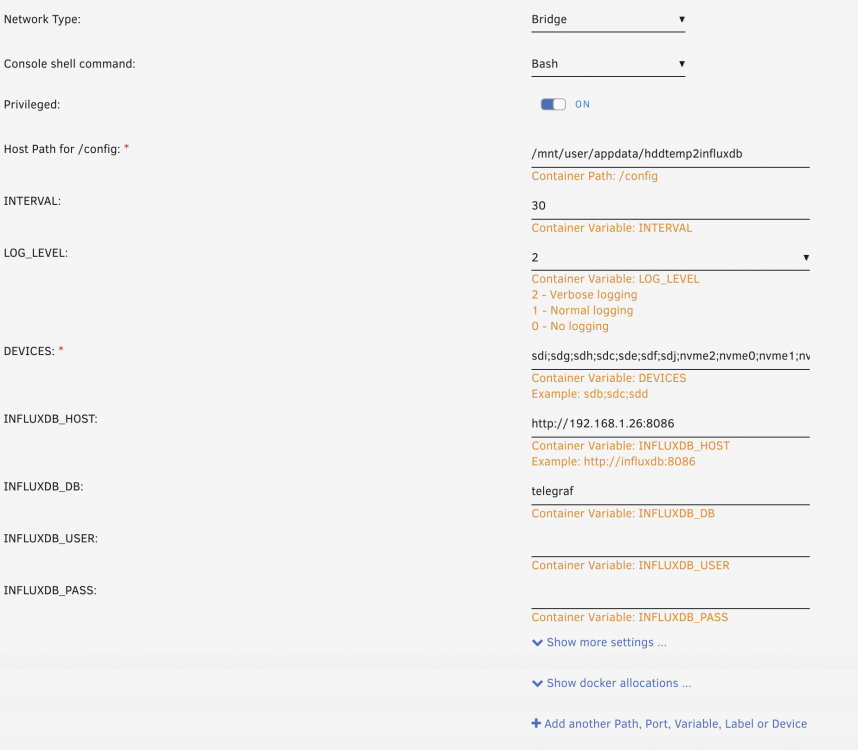
Running hddtemp2influxdb which seems to work fine and populates influx database with required info. I have noticed in the logs though the following error and not to sure why it would be throwing it out. curl: (22) The requested URL returned error: 400 Bad Request Settings appear to be ok and as mentioned is populating data for Grafana.
-
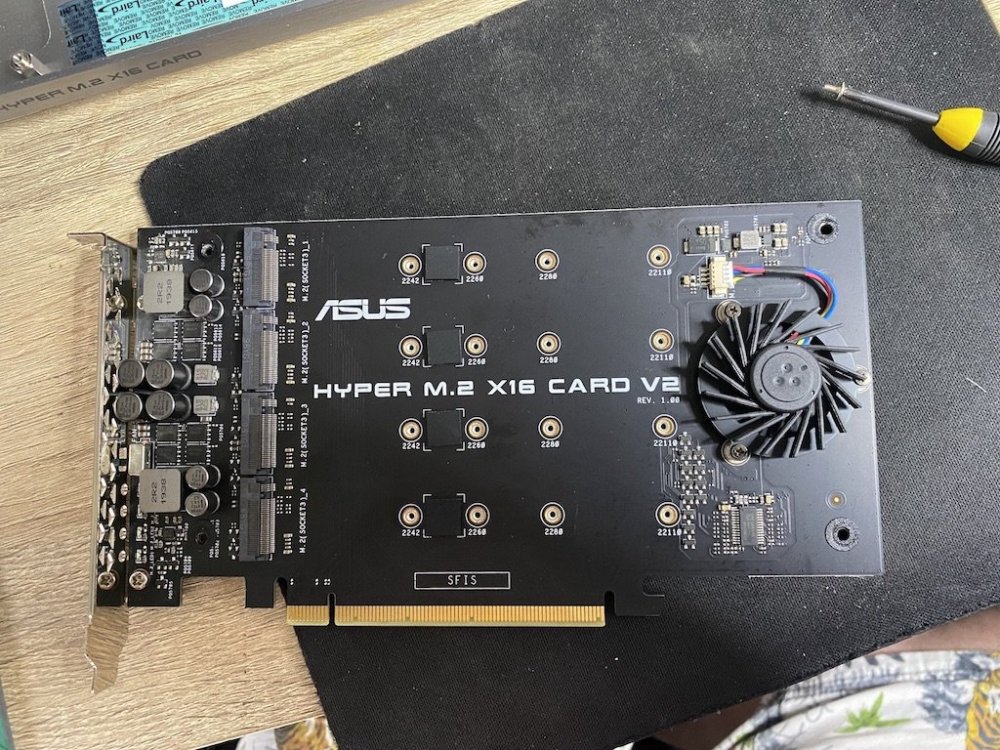
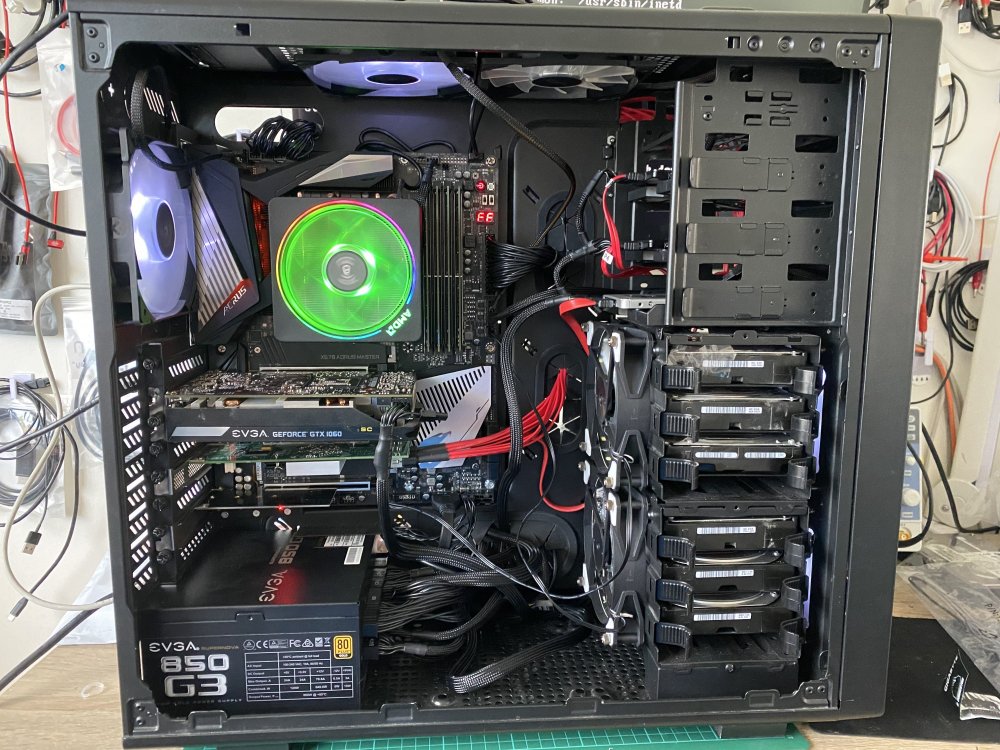
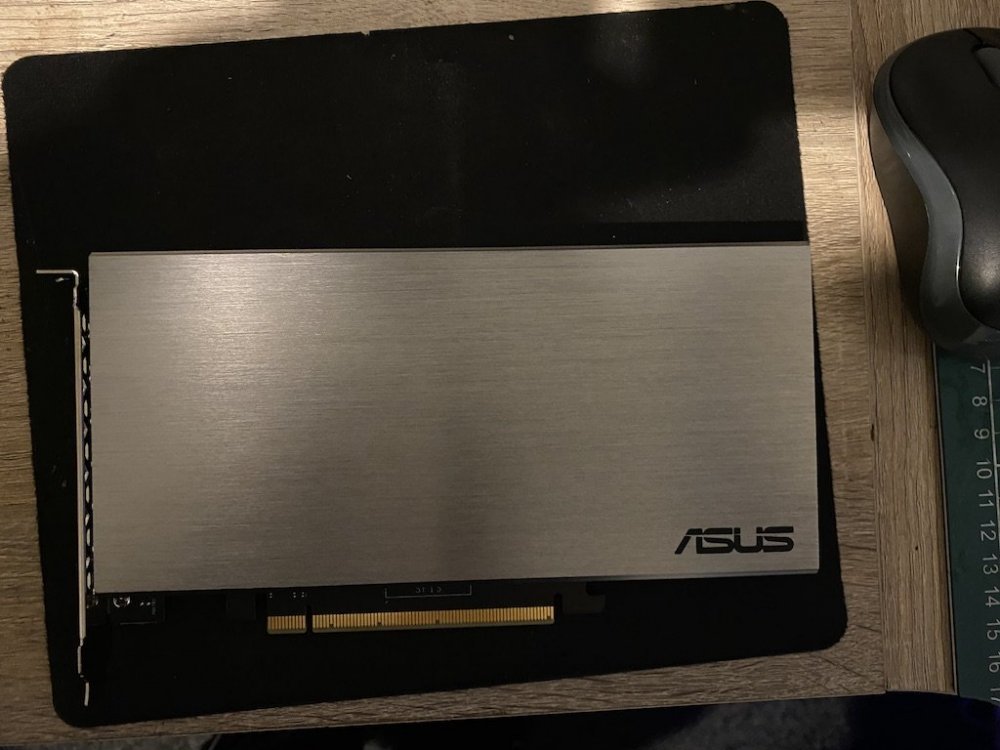
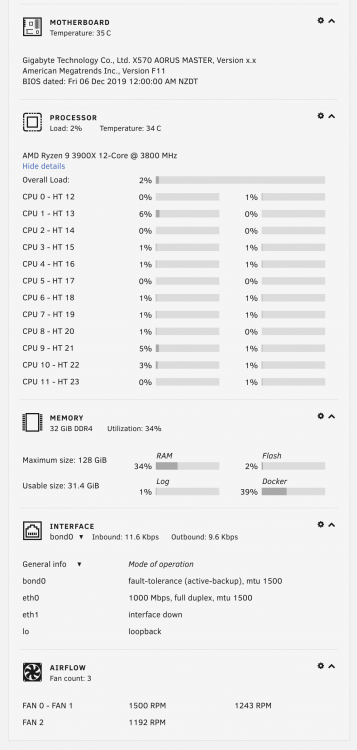
Upgraded my old 6700k system to the X570 Aorus Master. Everything working pretty good even added a 4 x nvme card I had sitting here and working well. Only thing I would like to do is pass temps through to Telegrah for Grafana any ideas ??