


ezra
Members
-
Joined
-
Last visited
Everything posted by ezra
-
@Steini84 Can't we get you to do a webinar on your ZFS setup on your unraid server? So to be clear, 1. Update plugin 2. Upgrade unraid to rc1 That will keep everything as is, in theory? Thanks for your work on this plugin, much appreciated.
-
It should be as easy as removing the ZFS plugin and upgrading to beta35 and do the side load right? Does anyone know if they are also working on GUI/array support with ZFS? Would love to contribute to the development but not a clue where. Unraid with zfs array support would solve all my needs! This is the first frontend i've seen next to FreeNAS for ZFS: https://github.com/optimans/cockpit-zfs-manager I use it for my proxmox servers, though up until this point i only managed ZFS via cli which is still fine. But i love the snapshot/pool creation from the UI!
-
Use -m during import to specify mount point not -d. Afterwards use "zfs set mountpoint=/path pool". Usefull command: zfs --help and zpool --help.
-
I'm trying to figure this out as well. The current unraid plugin docker fails to download. I'll report back if i find out anything.
-
Oh my god, sorry for wasting your time... Totally overlooked that.
-
Hello stein, well problem is i've setup those snapshot rules 3 days ago, nothing is added to: zfs list -r -t snapshot I'll see if run once will trigger the automated backups to start. Thank you.
-
Hello! I've installed the plugin for someone else, now on his unraid 6.3 we dont see any snapshots that are created by znapzend. Reinstalling did not help. *** backup plan: HDD *** enabled = on mbuffer = off mbuffer_size = 1G post_znap_cmd = off pre_znap_cmd = off recursive = on src = HDD src_plan = 24hours=>2hours,7days=>1day,30days=>7days,90days=>30days tsformat = %Y-%m-%d-%H%M%S zend_delay = 0 *** backup plan: NVME *** dst_0 = HDD/Backup/NVME dst_0_plan = 1day=>6hours enabled = on mbuffer = off mbuffer_size = 1G post_znap_cmd = off pre_znap_cmd = off recursive = on src = NVME src_plan = 24hours=>2hours,7days=>1day,30days=>7days,90days=>30days tsformat = %Y-%m-%d-%H%M%S zend_delay = 0 I've executed after creating: pkill -HUP znapzend Please advise.
-
it only imports the pool. just delete the folder and reboot to see if its still there. Should just be leftover or unknown typo.
-
first try: umount /mnt/ssd500gb If this output is something like: directory is not mounted, then: rm -r /mnt/ssd500gb (will delete the entire folder, so make sure there's nothing in there) then or before check with: df -h If /mnt/ssd500gb is listed somewhere, and /mnt/disks/ssd500gb also
-
For me destroying the pool does the job, you can try to reinstall the zfs plugin and issue: zpool status or zpool import -a and see if there is still something left. For all the others i have found out how to use zvol's for VM storage (so you can make use of snapshots, with raw .img you cant, i only had succes with qcow2 on ubuntu/debian servers, desktop failed to do snapshots on qcow2) zfs create -V 50G pool/zvolname then set the VM config for disk to manual: /dev/zvol/pool/zvolname And the type to virtio or sata (whatever works for you, virtio still the best performance wise) I've also figured out how to snapshot the right way with znapzendzetup also provided as unraid plugin by stein84, also to different datasets to ensure uptime of servers. If anyone needs a hand, let me know.
-
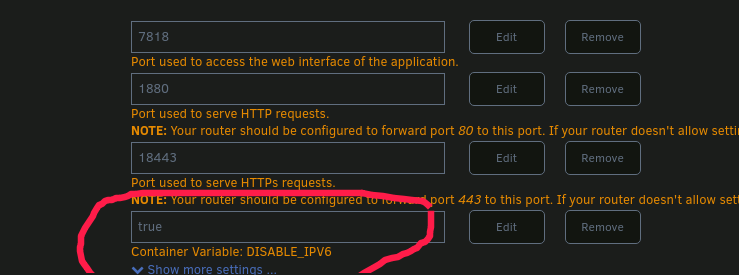
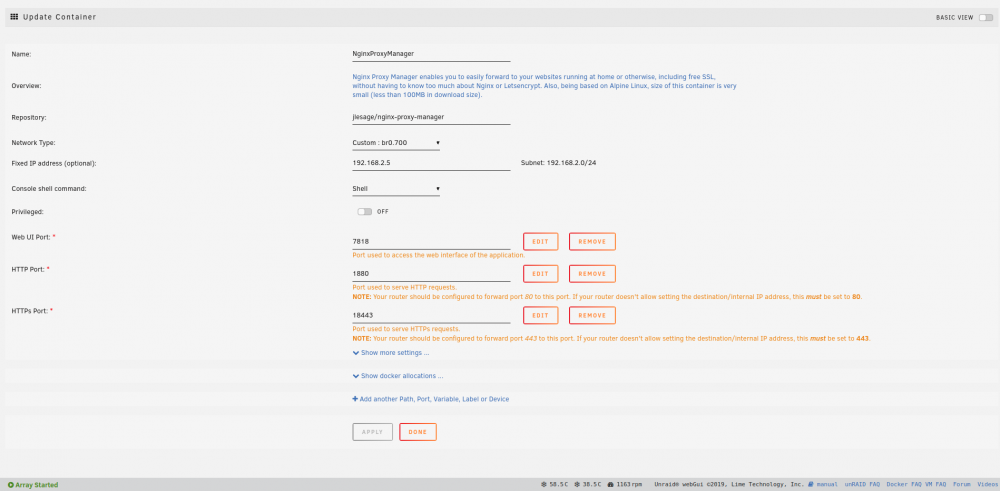
To work around this add a variable like below. Just use the latest image. edit: https://nginxproxymanager.com/advanced-config/
-
Hello all, anyone any expierence with zfs disk images? to use for VM's https://docs.oracle.com/cd/E69554_01/html/E69557/storingdiskimageswithzfs.html Would be great if we can snapshots the vm's, now im snapshotting the qemu .img but im not sure that works as i think.
-
Hello! I'm trying to get the sub containers of homeassistant_supervisor to be setup with a bridged VLAN, i can't seem to edit settings within the docker tab on unraid. The hassio_dns has network = default, homeassistant has network = host. I'd like to set that to br:3, does anyone know how? Also, do i need to change the underlying config? @MikelillOi check this thread
-
Hit me up on discord to troubleshoot.
-
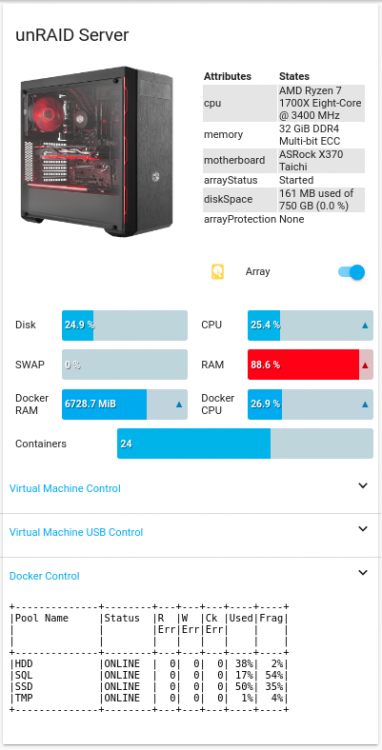
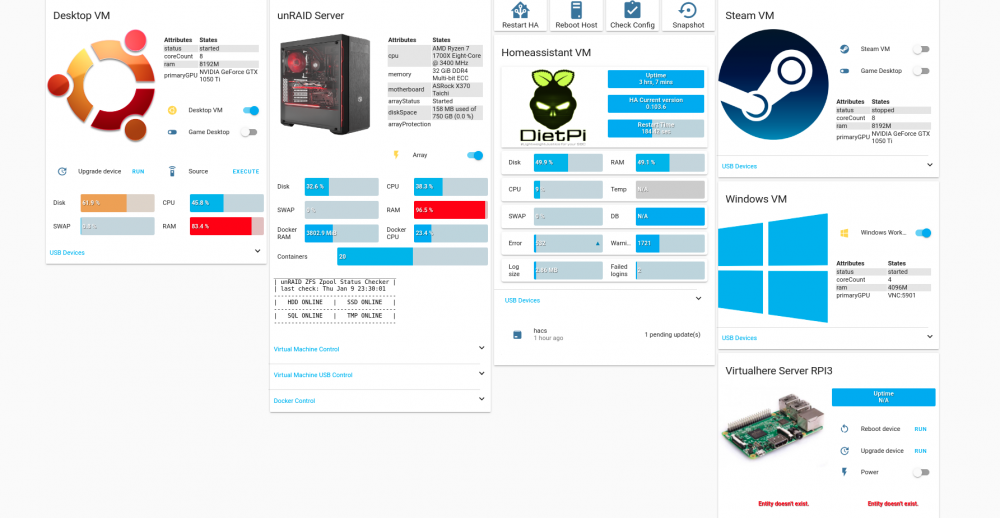
I'm using the unraidapi plugin https://github.com/ElectricBrainUK/UnraidAPI with glances docker. config: - type: custom:vertical-stack-in-card title: unRAID Server cards: - type: horizontal-stack cards: - type: custom:card-modder card: type: picture image: /local/images/freenas.png style: border-radius: 5px - type: vertical-stack cards: - type: custom:entity-attributes-card filter: include: - key: binary_sensor.unraid_server.cpu - key: binary_sensor.unraid_server.memory - key: binary_sensor.unraid_server.motherboard - key: binary_sensor.unraid_server.arrayStatus - key: binary_sensor.unraid_server.diskSpace - key: binary_sensor.unraid_server.arrayProtection - type: entities show_header_toggle: false entities: - switch.unraid_array - type: conditional conditions: - entity: sensor.glances_unraid_disk_used_percent state_not: "unavailable" - entity: sensor.glances_unraid_disk_used_percent state_not: "unknown" card: type: custom:bar-card align: split show_icon: true padding: 4px columns: 2 card_style: border-radius: 5px severity: - value: 50 color: '#3bb3ee' - value: 80 color: '#e7a24a' - value: 100 color: '#ff0000' entities: - entity: sensor.glances_unraid_disk_used_percent title: Disk max: 100 - entity: sensor.glances_unraid_cpu_used title: CPU max: 100 - type: conditional conditions: - entity: sensor.glances_unraid_disk_used_percent state_not: "unavailable" - entity: sensor.glances_unraid_disk_used_percent state_not: "unknown" card: type: custom:bar-card align: split show_icon: true padding: 4px columns: 2 card_style: border-radius: 5px severity: - value: 50 color: '#3bb3ee' - value: 80 color: '#e7a24a' - value: 100 color: '#ff0000' entities: - entity: sensor.glances_unraid_swap_used_percent title: SWAP max: 100 - entity: sensor.glances_unraid_ram_used_percent title: RAM max: 100 - type: conditional conditions: - entity: sensor.glances_unraid_containers_active state_not: '0' - entity: sensor.glances_unraid_disk_used_percent state_not: "unavailable" - entity: sensor.glances_unraid_disk_used_percent state_not: "unknown" card: type: custom:bar-card align: split show_icon: true padding: 4px columns: 2 card_style: border-radius: 5px entities: - entity: sensor.glances_unraid_containers_ram_used title: Docker RAM max: 10000 - entity: sensor.glances_unraid_containers_cpu_used title: Docker CPU - type: conditional conditions: - entity: sensor.glances_unraid_disk_used_percent state_not: "unavailable" - entity: sensor.glances_unraid_disk_used_percent state_not: "unknown" card: type: custom:bar-card align: left title_position: left show_icon: true padding: 4px columns: 1 card_style: border-radius: 5px severity: - value: 50 color: '#3bb3ee' - value: 80 color: '#e7a24a' - value: 100 color: '#ff0000' entities: - entity: sensor.glances_unraid_containers_active title: Containers max: 40 - type: custom:auto-entities filter: include: - entity_id: switch.unraid_vm_* exclude: - entity_id: switch.unraid_vm_*_usb* card: type: custom:fold-entity-row head: type: section label: Virtual Machine Control - type: custom:auto-entities filter: include: - entity_id: switch.unraid_vm_*_usb* card: type: custom:fold-entity-row head: type: section label: Virtual Machine USB Control - type: custom:auto-entities filter: include: - entity_id: switch.unraid_docker_* card: type: custom:fold-entity-row head: type: section label: Docker Control - type: iframe url: https://zfs.domain.nl:443/zpool.txt aspect_ratio: 40%
-
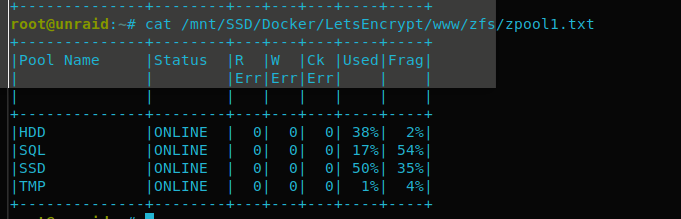
Here is an update for an overview of your pools. I use this with user scripts cron and paste the output to an nginx webserver, home assistant grabs that data and displays it: logfile="/tmp/zpool_report.tmp" ZPOOL="/mnt/SSD/Docker/LetsEncrypt/www/zfs/zpool.txt" pools=$(zpool list -H -o name) usedWarn=75 usedCrit=90 warnSymbol="?" critSymbol="!" ( echo "+--------------+--------+---+---+---+----+----+" echo "|Pool Name |Status |R |W |Ck |Used|Frag|" echo "| | |Err|Err|Err| | |" echo "| | | | | | | |" echo "+--------------+--------+---+---+---+----+----+" ) > ${logfile} for pool in $pools; do frag="$(zpool list -H -o frag "$pool")" status="$(zpool list -H -o health "$pool")" errors="$(zpool status "$pool" | grep -E "(ONLINE|DEGRADED|FAULTED|UNAVAIL|REMOVED)[ \t]+[0-9]+")" readErrors=0 for err in $(echo "$errors" | awk '{print $3}'); do if echo "$err" | grep -E -q "[^0-9]+"; then readErrors=1000 break fi readErrors=$((readErrors + err)) done writeErrors=0 for err in $(echo "$errors" | awk '{print $4}'); do if echo "$err" | grep -E -q "[^0-9]+"; then writeErrors=1000 break fi writeErrors=$((writeErrors + err)) done cksumErrors=0 for err in $(echo "$errors" | awk '{print $5}'); do if echo "$err" | grep -E -q "[^0-9]+"; then cksumErrors=1000 break fi cksumErrors=$((cksumErrors + err)) done if [ "$readErrors" -gt 999 ]; then readErrors=">1K"; fi if [ "$writeErrors" -gt 999 ]; then writeErrors=">1K"; fi if [ "$cksumErrors" -gt 999 ]; then cksumErrors=">1K"; fi used="$(zpool list -H -p -o capacity "$pool")" if [ "$status" = "FAULTED" ] \ || [ "$used" -gt "$usedCrit" ] then symbol="$critSymbol" elif [ "$status" != "ONLINE" ] \ || [ "$readErrors" != "0" ] \ || [ "$writeErrors" != "0" ] \ || [ "$cksumErrors" != "0" ] \ || [ "$used" -gt "$usedWarn" ] then symbol="$warnSymbol" else symbol=" " fi ( printf "|%-12s %1s|%-8s|%3s|%3s|%3s|%3s%%|%4s|\n" \ "$pool" "$symbol" "$status" "$readErrors" "$writeErrors" "$cksumErrors" \ "$used" "$frag" ) >> ${logfile} done ( echo "+--------------+--------+---+---+---+----+----+" ) >> ${logfile} cat ${logfile} > "$ZPOOL"
-
Install the corsairpsu plugin from CA, then edit the files status.php and status.page in: /usr/local/emhttp/plugins/corsairpsu/ still working on it. Could use some help.
-
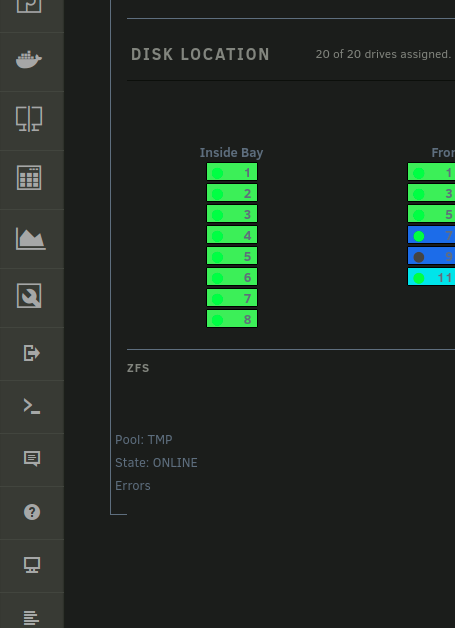
I've started to create a dashboard section for ZFS details. let me know if you can help me out with PHP/JSON/BASH I don't really know what i'm doing just trial en error, modifying an existing plugin (corsaircpu, status.php & status.page) https://github.com/ezraholm50/zfs-frontend-unraid
-
Updated previous post with useful commands and monitoring.
-
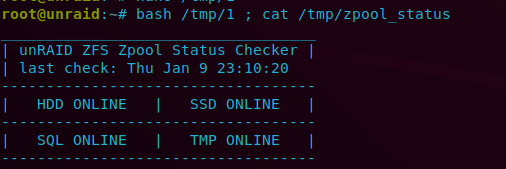
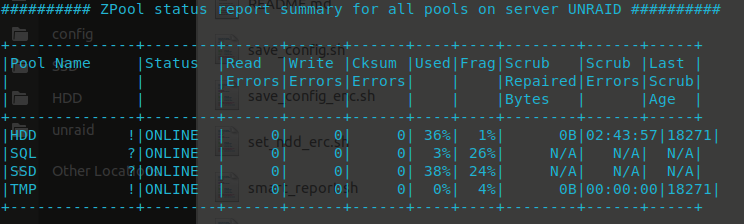
For sure a GUI would be great, i moved from FreeNAS to unRAID a few weeks back. It took me 2 weeks to figure it out and i now monitor everything via CLI and its fast, without any issues. I've also setup monitoring for the zpool status and unraid notifies me if somethings off. No need for a GUI, it would be nice but not a priority IMO. Let me know if anyone needs some useful commands or the monitoring setup. root@unraid:~# zpool status pool: HDD state: ONLINE scan: scrub repaired 0B in 0 days 02:43:57 with 0 errors on Sun Jan 5 14:14:00 2020 config: NAME STATE READ WRITE CKSUM HDD ONLINE 0 0 0 raidz2-0 ONLINE 0 0 0 sdp ONLINE 0 0 0 sde ONLINE 0 0 0 sdf ONLINE 0 0 0 sdr ONLINE 0 0 0 sdq ONLINE 0 0 0 sds ONLINE 0 0 0 logs sdg ONLINE 0 0 0 errors: No known data errors pool: SQL state: ONLINE scan: resilvered 254M in 0 days 00:00:01 with 0 errors on Thu Jan 9 13:10:08 2020 config: NAME STATE READ WRITE CKSUM SQL ONLINE 0 0 0 mirror-0 ONLINE 0 0 0 sdi ONLINE 0 0 0 sdl ONLINE 0 0 0 errors: No known data errors pool: SSD state: ONLINE scan: resilvered 395M in 0 days 00:00:02 with 0 errors on Thu Jan 9 13:30:10 2020 config: NAME STATE READ WRITE CKSUM SSD ONLINE 0 0 0 mirror-0 ONLINE 0 0 0 sdd ONLINE 0 0 0 sdo ONLINE 0 0 0 mirror-1 ONLINE 0 0 0 sdn ONLINE 0 0 0 sdm ONLINE 0 0 0 logs sdh ONLINE 0 0 0 errors: No known data errors pool: TMP state: ONLINE scan: scrub repaired 0B in 0 days 00:00:00 with 0 errors on Sun Jan 5 11:30:04 2020 config: NAME STATE READ WRITE CKSUM TMP ONLINE 0 0 0 sdt ONLINE 0 0 0 errors: No known data errors Monitor Disk I/O root@unraid:~# zpool iostat -v 1 capacity operations bandwidth pool alloc free read write read write ---------- ----- ----- ----- ----- ----- ----- HDD 5.93T 10.4T 20 126 5.47M 29.4M raidz2 5.93T 10.4T 20 125 5.47M 29.4M sdp - - 3 19 1.14M 4.89M sde - - 3 20 936K 4.89M sdf - - 3 20 835K 4.89M sdr - - 4 23 1.06M 4.89M sdq - - 2 19 803K 4.89M sds - - 3 23 783K 4.89M logs - - - - - - sdg 172K 29.5G 0 0 56 1.65K ---------- ----- ----- ----- ----- ----- ----- SQL 3.99G 106G 3 116 287K 4.66M mirror 3.99G 106G 3 116 287K 4.66M sdi - - 1 58 136K 2.33M sdl - - 1 58 151K 2.33M ---------- ----- ----- ----- ----- ----- ----- SSD 156G 288G 25 246 1.47M 8.83M mirror 77.6G 144G 12 111 755K 3.01M sdd - - 6 52 355K 1.50M sdo - - 6 59 400K 1.50M mirror 78.0G 144G 12 102 746K 2.90M sdn - - 6 55 399K 1.45M sdm - - 5 47 346K 1.45M logs - - - - - - sdh 4.91M 29.5G 0 31 201 2.92M ---------- ----- ----- ----- ----- ----- ----- TMP 1.50M 29.5G 0 0 149 2.70K sdt 1.50M 29.5G 0 0 149 2.70K ---------- ----- ----- ----- ----- ----- ----- List snapshots root@unraid:~# zfs list -t snapshot NAME USED AVAIL REFER MOUNTPOINT HDD@manual 160K - 87.2G - HDD/Backup@2019-12-29-180000 168K - 248K - HDD/Backup@2020-01-03-150000 65.1M - 36.5G - HDD/Backup@2020-01-04-000000 40.4M - 43.3G - HDD/Backup@2020-01-05-000000 72.0M - 43.8G - HDD/Backup@2020-01-06-000000 69.1M - 44.7G - HDD/Backup@2020-01-07-000000 35.6M - 45.1G - HDD/Backup@2020-01-08-000000 7.00M - 45.5G - HDD/Backup@2020-01-08-120000 400K - 45.5G - HDD/Backup@2020-01-08-150000 400K - 45.5G - HDD/Backup@2020-01-08-180000 416K - 45.5G - HDD/Backup@2020-01-08-210000 1.33M - 45.5G - HDD/Backup@2020-01-09-000000 1.33M - 46.0G - HDD/Backup@2020-01-09-030000 687K - 46.0G - HDD/Backup@2020-01-09-060000 663K - 46.0G - HDD/Backup@2020-01-09-090000 456K - 46.0G - HDD/Backup@2020-01-09-120000 480K - 46.0G - Scrub weekly - User scripts #!/bin/bash /usr/local/emhttp/webGui/scripts/notify -i normal -s "Scrub" -d "Scrub of all sub zfs file systems started..." /usr/sbin/zpool scrub SSD /usr/sbin/zpool scrub HDD /usr/sbin/zpool scrub SQL /usr/sbin/zpool scrub TMP Trim SSD's weekly - User scripts #!/bin/bash /usr/local/emhttp/webGui/scripts/notify -i normal -s "Trim" -d "Trim of all SSD disks started..." /usr/sbin/zpool trim SSD /usr/sbin/zpool trim SQL /usr/sbin/zpool trim TMP Zpool Status check every 5 minutes (custom */5 * * * *) - User scripts #!/bin/bash # # https://gist.github.com/petervanderdoes/bd6660302404ed5b094d # problems=0 emailSubject="`hostname` - ZFS pool - HEALTH check" emailMessage="" # ZFS_LOG="/boot/logs/ZFS-LOG.txt" # # Health - Check if all zfs volumes are in good condition. We are looking for # any keyword signifying a degraded or broken array. condition=$(/usr/sbin/zpool status | egrep -i '(DEGRADED|FAULTED|OFFLINE|UNAVAIL|REMOVED|FAIL|DESTROYED|corrupt|cannot|unrecover)') #condition=$(/usr/sbin/zpool status | egrep -i '(ONLINE)') if [ "${condition}" ]; then emailSubject="$emailSubject - fault" problems=1 fi # # Capacity - Make sure pool capacities are below 80% for best performance. The # percentage really depends on how large your volume is. If you have a 128GB # SSD then 80% is reasonable. If you have a 60TB raid-z2 array then you can # probably set the warning closer to 95%. # # ZFS uses a copy-on-write scheme. The file system writes new data to # sequential free blocks first and when the uberblock has been updated the new # inode pointers become valid. This method is true only when the pool has # enough free sequential blocks. If the pool is at capacity and space limited, # ZFS will be have to randomly write blocks. This means ZFS can not create an # optimal set of sequential writes and write performance is severely impacted. maxCapacity=80 if [ ${problems} -eq 0 ]; then capacity=$(/usr/sbin/zpool list -H -o capacity) for line in ${capacity//%/} do if [ $line -ge $maxCapacity ]; then emailSubject="$emailSubject - Capacity Exceeded" problems=1 fi done fi # Errors - Check the columns for READ, WRITE and CKSUM (checksum) drive errors # on all volumes and all drives using "zpool status". If any non-zero errors # are reported an email will be sent out. You should then look to replace the # faulty drive and run "zpool scrub" on the affected volume after resilvering. if [ ${problems} -eq 0 ]; then errors=$(/usr/sbin/zpool status | grep ONLINE | grep -v state | awk '{print $3 $4 $5}' | grep -v 000) if [ "${errors}" ]; then emailSubject="$emailSubject - Drive Errors" problems=1 fi fi # Scrub Expired - Check if all volumes have been scrubbed in at least the last # 8 days. The general guide is to scrub volumes on desktop quality drives once # a week and volumes on enterprise class drives once a month. You can always # use cron to schedule "zpool scrub" in off hours. We scrub our volumes every # Sunday morning for example. # # Scrubbing traverses all the data in the pool once and verifies all blocks can # be read. Scrubbing proceeds as fast as the devices allows, though the # priority of any I/O remains below that of normal calls. This operation might # negatively impact performance, but the file system will remain usable and # responsive while scrubbing occurs. To initiate an explicit scrub, use the # "zpool scrub" command. # # The scrubExpire variable is in seconds. So for 8 days we calculate 8 days # times 24 hours times 3600 seconds to equal 691200 seconds. ##scrubExpire=691200 # # 2764800 => 32 dias # scrubExpire=2764800 if [ ${problems} -eq 0 ]; then currentDate=$(date +%s) zfsVolumes=$(/usr/sbin/zpool list -H -o name) for volume in ${zfsVolumes} do if [ $(/usr/sbin/zpool status $volume | egrep -c "none requested") -ge 1 ]; then echo "ERROR: You need to run \"zpool scrub $volume\" before this script can monitor the scrub expiration time." break fi ## if [ $(/usr/sbin/zpool status $volume | egrep -c "scrub in progress|resilver") -ge 1 ]; then if [ $(/usr/sbin/zpool status $volume | egrep -c "scrub in progress") -ge 1 ]; then break fi ### FreeBSD with *nix supported date format #scrubRawDate=$(/usr/sbin/zpool status $volume | grep scrub | awk '{print $15 $12 $13}') #scrubDate=$(date -j -f '%Y%b%e-%H%M%S' $scrubRawDate'-000000' +%s) ### Ubuntu with GNU supported date format scrubRawDate=$(/usr/sbin/zpool status $volume | grep scrub | awk '{print $13" "$14" " $15" " $16" "$17}') scrubDate=$(date -d "$scrubRawDate" +%s) if [ $(($currentDate - $scrubDate)) -ge $scrubExpire ]; then if [ ${problems} -eq 0 ]; then emailSubject="$emailSubject - Scrub Time Expired. Scrub Needed on Volume(s)" fi problems=1 emailMessage="${emailMessage}Pool: $volume needs scrub \n" fi done fi # Notifications - On any problems send email with drive status information and # capacities including a helpful subject line to root. Also use logger to write # the email subject to the local logs. This is the place you may want to put # any other notifications like: # # + Update an anonymous twitter account with your ZFS status (https://twitter.com/zfsmonitor) # + Playing a sound file or beep the internal speaker # + Update Nagios, Cacti, Zabbix, Munin or even BigBrother if [ "$problems" -ne 0 ]; then logger $emailSubject echo -e "$emailSubject\t$emailMessage" > $ZFS_LOG # Notifica via email # COMMAND=$(cat "$ZFS_LOG") /usr/local/emhttp/webGui/scripts/notify -i warning -s "ZFS" -d "Zpool status change \n\n$COMMAND \n\n`date`" fi Also i've changed the ashift back and forth but came to the conclusion its better left at 0 (auto) after performance tests. I've set recordsize=1M on my media files I've added a SLOG (32GB SSD) to my SSD (VMs) pool and my HDD pool to prevent double writes: zpool add POOLNAME log SDX I've set atime off on every pool another one: Set ARC size - User scripts @reboot #!/bin/bash # numbers are 8GB just multiply by 2 if you want 16GB etc.. echo 8589934592 >> /sys/module/zfs/parameters/zfs_arc_max && /usr/local/emhttp/webGui/scripts/notify -i normal -s "System" -d "Adjusted ARC limit to 8G \n\n`date`" I use this to display a text card with homeassistant (ssh to cat the file as a sensor) setup as a user script in unRAID to run every 5 mins #!/bin/bash HDD=$(/usr/sbin/zpool status HDD | grep -m2 ""| awk '{print $2}' | tr '\n' ' ') SSD=$(/usr/sbin/zpool status SSD | grep -m2 ""| awk '{print $2}' | tr '\n' ' ') SQL=$(/usr/sbin/zpool status SQL | grep -m2 ""| awk '{print $2}' | tr '\n' ' ') TMP=$(/usr/sbin/zpool status TMP | grep -m2 ""| awk '{print $2}' | tr '\n' ' ') DATE=$(/bin/date | awk '{print $1 " " $2 " " $3 " " $4}') echo "___________________________________" > /tmp/zpool_status echo "| unRAID ZFS Zpool Status Checker |" >> /tmp/zpool_status echo "| last check: $DATE " >> /tmp/zpool_status echo "-----------------------------------" >> /tmp/zpool_status echo "| $HDD | $SSD |" >> /tmp/zpool_status echo "-----------------------------------" >> /tmp/zpool_status echo "| $SQL | $TMP |" >> /tmp/zpool_status echo "-----------------------------------" >> /tmp/zpool_status Output: Still trying to convert this script from unix to linux, could use some help: #!/bin/sh ### Parameters ### fbsd_relver=$(uname -a | awk '{print $3}' | sed 's/.......$//') freenashost=$(hostname -s | tr '[:lower:]' '[:upper:]') logfile="/tmp/zpool_report.tmp" subject="ZPool Status Report for ${freenashost}" pools=$(zpool list -H -o name) usedWarn=75 usedCrit=90 scrubAgeWarn=30 warnSymbol="?" critSymbol="!" ###### summary ###### ( echo "########## ZPool status report summary for all pools on server ${freenashost} ##########" echo "" echo "+--------------+--------+------+------+------+----+----+--------+------+-----+" echo "|Pool Name |Status |Read |Write |Cksum |Used|Frag|Scrub |Scrub |Last |" echo "| | |Errors|Errors|Errors| | |Repaired|Errors|Scrub|" echo "| | | | | | | |Bytes | |Age |" echo "+--------------+--------+------+------+------+----+----+--------+------+-----+" ) > ${logfile} for pool in $pools; do if [ "${pool}" = "freenas-boot" ]; then frag="" else frag="$(zpool list -H -o frag "$pool")" fi status="$(zpool list -H -o health "$pool")" errors="$(zpool status "$pool" | grep -E "(ONLINE|DEGRADED|FAULTED|UNAVAIL|REMOVED)[ \t]+[0-9]+")" readErrors=0 for err in $(echo "$errors" | awk '{print $3}'); do if echo "$err" | grep -E -q "[^0-9]+"; then readErrors=1000 break fi readErrors=$((readErrors + err)) done writeErrors=0 for err in $(echo "$errors" | awk '{print $4}'); do if echo "$err" | grep -E -q "[^0-9]+"; then writeErrors=1000 break fi writeErrors=$((writeErrors + err)) done cksumErrors=0 for err in $(echo "$errors" | awk '{print $5}'); do if echo "$err" | grep -E -q "[^0-9]+"; then cksumErrors=1000 break fi cksumErrors=$((cksumErrors + err)) done if [ "$readErrors" -gt 999 ]; then readErrors=">1K"; fi if [ "$writeErrors" -gt 999 ]; then writeErrors=">1K"; fi if [ "$cksumErrors" -gt 999 ]; then cksumErrors=">1K"; fi used="$(zpool list -H -p -o capacity "$pool")" scrubRepBytes="N/A" scrubErrors="N/A" scrubAge="N/A" if [ "$(zpool status "$pool" | grep "scan" | awk '{print $2}')" = "scrub" ]; then scrubRepBytes="$(zpool status "$pool" | grep "scan" | awk '{print $4}')" if [ "$fbsd_relver" -gt 1101000 ]; then scrubErrors="$(zpool status "$pool" | grep "scan" | awk '{print $10}')" scrubDate="$(zpool status "$pool" | grep "scan" | awk '{print $17"-"$14"-"$15"_"$16}')" else scrubErrors="$(zpool status "$pool" | grep "scan" | awk '{print $8}')" scrubDate="$(zpool status "$pool" | grep "scan" | awk '{print $15"-"$12"-"$13"_"$14}')" fi scrubTS="$(date "+%Y-%b-%e_%H:%M:%S" "$scrubDate" "+%s")" currentTS="$(date "+%s")" scrubAge=$((((currentTS - scrubTS) + 43200) / 86400)) fi if [ "$status" = "FAULTED" ] \ || [ "$used" -gt "$usedCrit" ] \ || ( [ "$scrubErrors" != "N/A" ] && [ "$scrubErrors" != "0" ] ) then symbol="$critSymbol" elif [ "$status" != "ONLINE" ] \ || [ "$readErrors" != "0" ] \ || [ "$writeErrors" != "0" ] \ || [ "$cksumErrors" != "0" ] \ || [ "$used" -gt "$usedWarn" ] \ || [ "$scrubRepBytes" != "0" ] \ || [ "$(echo "$scrubAge" | awk '{print int($1)}')" -gt "$scrubAgeWarn" ] then symbol="$warnSymbol" else symbol=" " fi ( printf "|%-12s %1s|%-8s|%6s|%6s|%6s|%3s%%|%4s|%8s|%6s|%5s|\n" \ "$pool" "$symbol" "$status" "$readErrors" "$writeErrors" "$cksumErrors" \ "$used" "$frag" "$scrubRepBytes" "$scrubErrors" "$scrubAge" ) >> ${logfile} done ( echo "+--------------+--------+------+------+------+----+----+--------+------+-----+" ) >> ${logfile} ###### for each pool ###### for pool in $pools; do ( echo "" echo "########## ZPool status report for ${pool} ##########" echo "" zpool status -v "$pool" ) >> ${logfile} done Should give a nice ui'ish summary of all zpools:
-
Thank you both, i've destroyed all snapshots prior to setting it up properly. after the creation i did a reboot. Still misses some of the 3 hourly's... id really like that. Anyway i'll start from scratch again. Thanks for the input.
-
Hello! thanks again for this awesome stuf. If you look at my snapshots, you see there are some missed snapshots. I've set it up: daily every 3 hours, weekly everyday. i think something is off, any idea where to start looking? SSD/VMs/Ubuntu@2019-12-29-180000 0B - 25K - SSD/VMs/Ubuntu@2019-12-30-000000 0B - 25K - SSD/VMs/Ubuntu@2020-01-03-150000 0B - 25K - SSD/VMs/Ubuntu@2020-01-04-000000 0B - 25K - SSD/VMs/Ubuntu@2020-01-04-030000 0B - 25K - SSD/VMs/Ubuntu@2020-01-04-060000 0B - 25K - SSD/VMs/Ubuntu@2020-01-04-090000 0B - 25K - SSD/VMs/Ubuntu@2020-01-04-120000 0B - 25K - SSD/VMs/Ubuntu@2020-01-04-150000 0B - 25K - SSD/VMs/Ubuntu@2020-01-04-180000 0B - 25K - SSD/VMs/Ubuntu@2020-01-04-210000 0B - 25K - SSD/VMs/Ubuntu@2020-01-05-000000 0B - 25K - SSD/VMs/Ubuntu@2020-01-05-030000 0B - 25K - SSD/VMs/Windows@2019-12-29-180000 0B - 24K - SSD/VMs/Windows@2019-12-30-000000 0B - 24K - SSD/VMs/Windows@2020-01-03-150000 0B - 24K - SSD/VMs/Windows@2020-01-04-000000 0B - 24K - SSD/VMs/Windows@2020-01-04-030000 0B - 24K - SSD/VMs/Windows@2020-01-04-060000 0B - 24K - SSD/VMs/Windows@2020-01-04-090000 0B - 24K - SSD/VMs/Windows@2020-01-04-120000 0B - 24K - SSD/VMs/Windows@2020-01-04-150000 0B - 24K - SSD/VMs/Windows@2020-01-04-180000 0B - 24K - SSD/VMs/Windows@2020-01-04-210000 0B - 24K - SSD/VMs/Windows@2020-01-05-000000 0B - 24K - SSD/VMs/Windows@2020-01-05-030000 0B - 24K - SSD/tmp@2019-12-29-180000 0B - 24K - SSD/tmp@2019-12-30-000000 0B - 24K - SSD/tmp@2020-01-03-150000 0B - 24K - SSD/tmp@2020-01-04-000000 0B - 24K - SSD/tmp@2020-01-04-030000 0B - 24K - SSD/tmp@2020-01-04-060000 0B - 24K - SSD/tmp@2020-01-04-090000 0B - 24K - SSD/tmp@2020-01-04-120000 0B - 24K - SSD/tmp@2020-01-04-150000 0B - 24K - SSD/tmp@2020-01-04-180000 0B - 24K - SSD/tmp@2020-01-04-210000 0B - 24K - SSD/tmp@2020-01-05-000000 0B - 24K - SSD/tmp@2020-01-05-030000 0B - 24K -
-
Hey, thanks for this app. I cant reach the webui of this container. I've seen something rather odd. Upon creation i see port 7818 for the webui and after i've started the container it said 8181 for the webui. Also the other ports don't add up. Please advise.

-
Also only read permission. Anyone any pointers?
-
Thanks man, took me less then 5 minutes. Awesome!


