





colev14
Members
-
Joined
-
Last visited
Everything posted by colev14
-
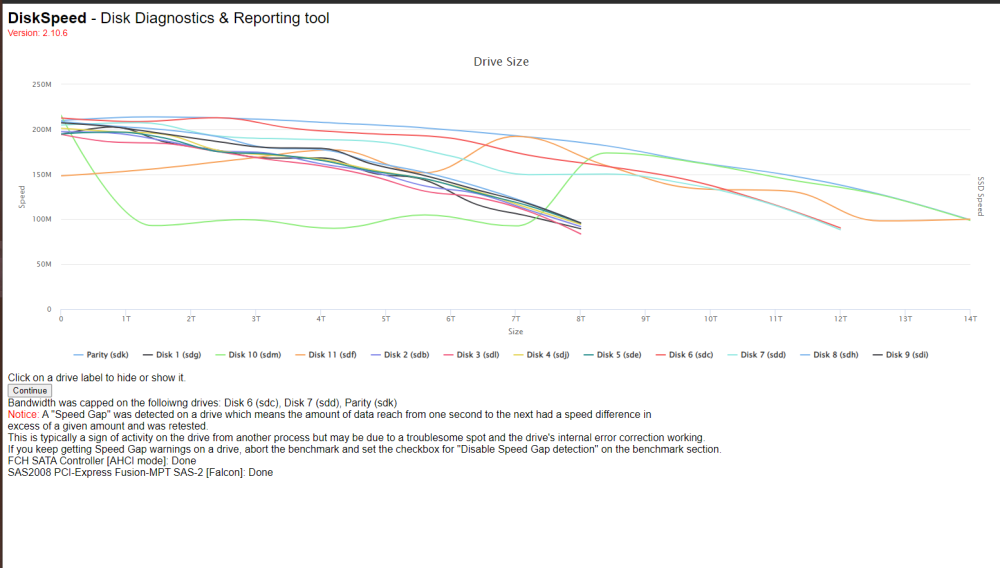
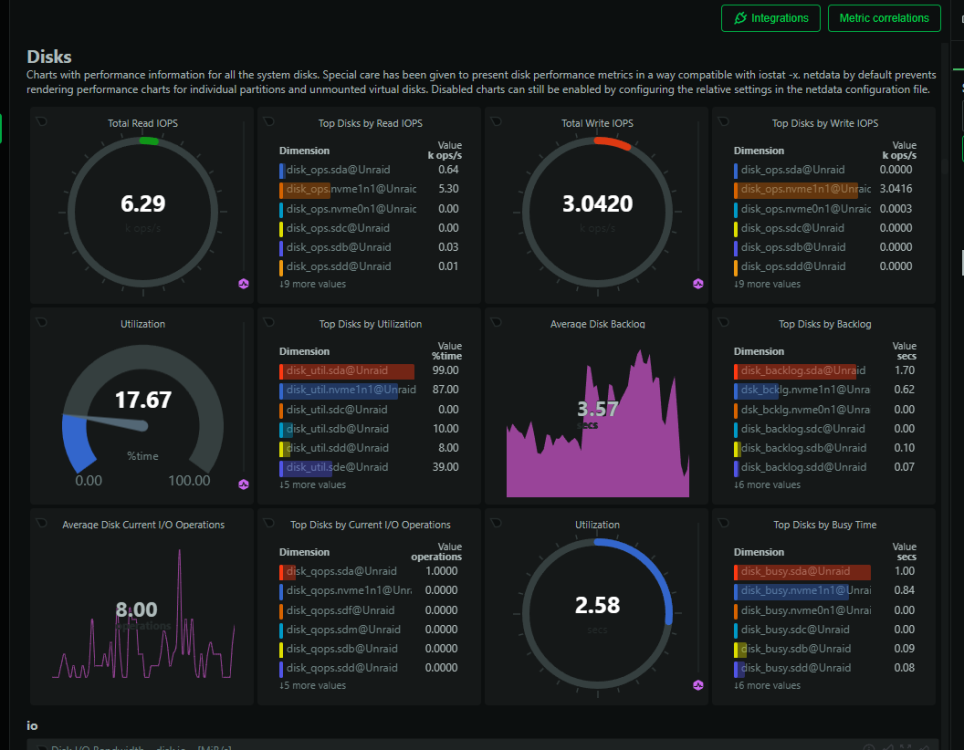
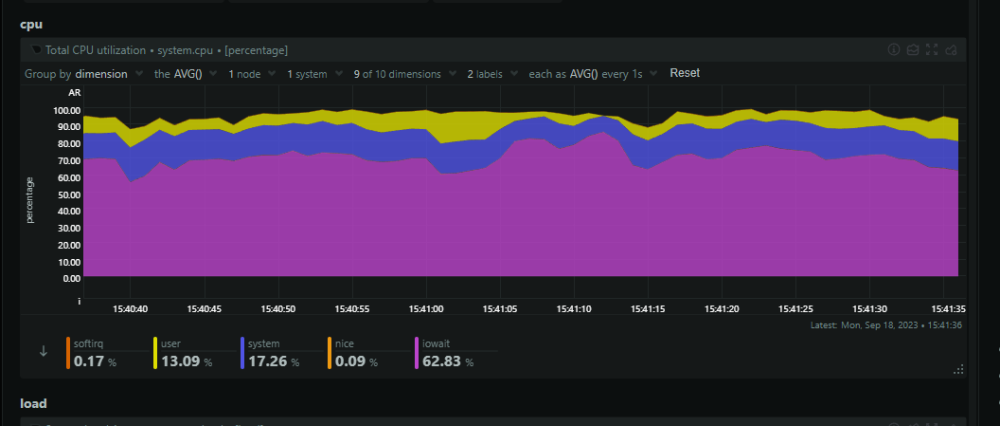
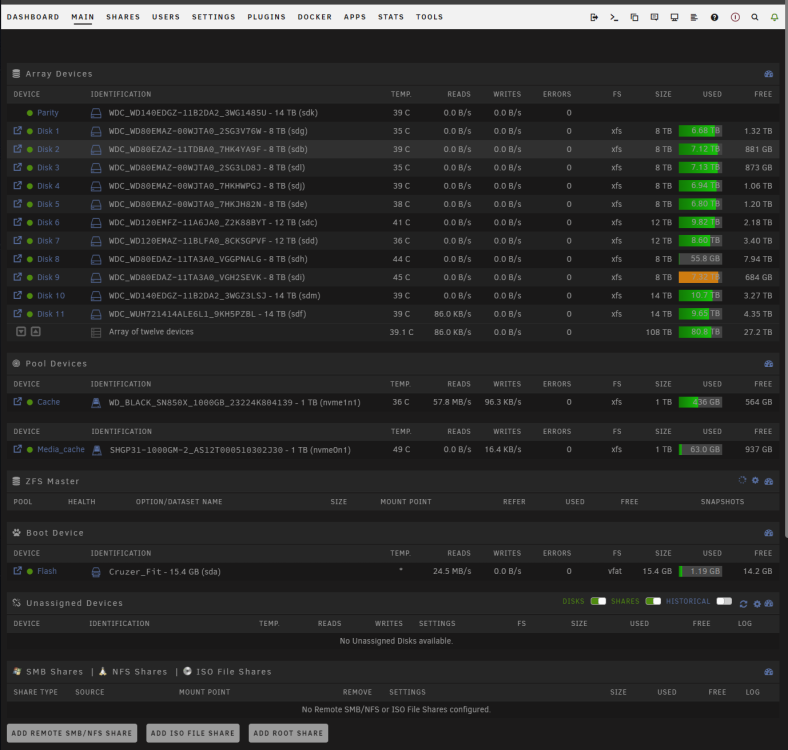
I've been dealing with IO Wait issues for months now. I've searched through the forum and tried all kinds of solutions. My most recent effort was changing the cache drive from btrfs to XFS. Now it seems like the issue is worse than ever. It took me 2 hours to even be able to login to the server. Everything is locked up and incredibly slow. I've added my logs and some relevant pictures below. I can see that the disk sda is busy, but I think that is my usb stick, so I'm not really sure why that would be the case. I've also updated my bios to the most recent version. It's weird because my dockers appear to be working fine, it's just the unraid UI that is slow and becomes inaccessible. I've tried pinning cpu cores to every docker container to keep some available to the server but that didn't really make a difference. Looking for any help to get my server to be usable again. unraid-diagnostics-20230918-1611.zip
-
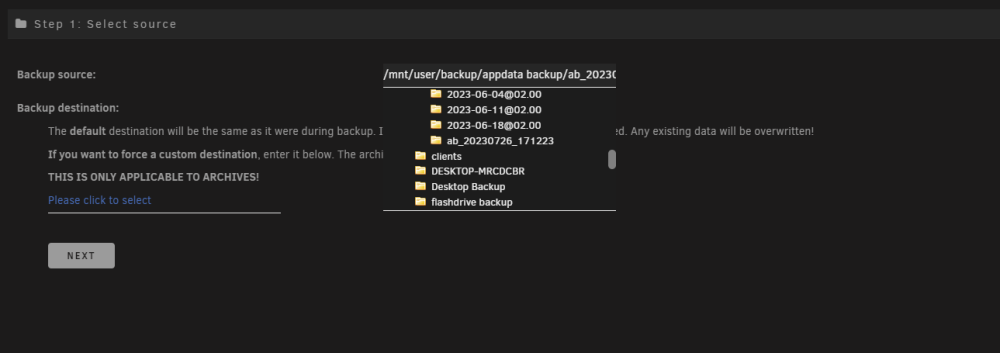
I'm getting a invalid source error. I made a backup of my appdata and it appears to have been successful. I've attached the debug log from the backup. When I try to restore from that exact same backup I get the invalid source error. I am not trying to restore my appdata from the old plugin, you can see in the first image I am selecting the ab_ folder. ab.debug.log

-
Guys, I swear I literally purchased a 2nd unraid license to run on a 2nd server for tinkering so I don't mess up my main server. But somehow I end up doing this on my main one anyway. I just never learn. I ended up solving the issue myself. I went into ZFS master and enabled destructive mode. Then changed the name of the dataset and the dataset location to appdatatest and then all my old appdata popped up exactly where it was before. Everything works fine now.
-
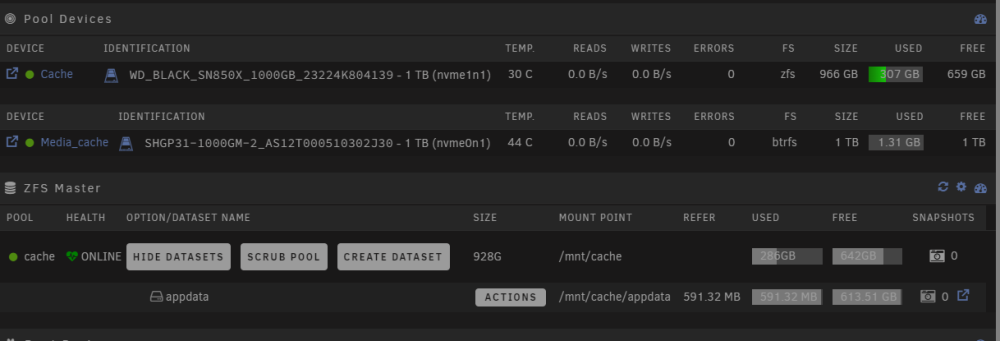
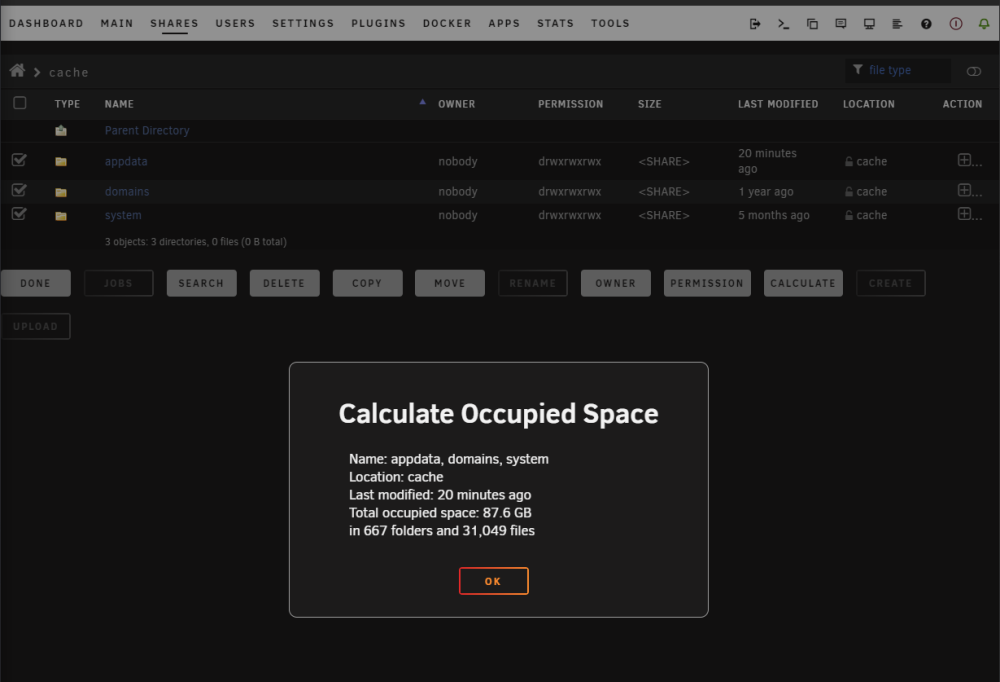
Hello, I was following the new Spaceinvaderone video on creating a dataset for each appdata folder. I created a dataset on the cache drive for appdata and suddenly my appdata is saying it's 587MB, when previously it was many GB. I can see that there is still 300GB being used on the cache, which is what was being used before. When I go into the file browser and calculate the size, it's saying 87.6 GB though. So I'm not really sure what happened to my old appdata. Everything appears to have been deleted. There are just the folders for the docker containers that are running that got generated fresh. unraid-diagnostics-20230726-1653.zip
-
Hello, I've been having this issue the past few days where the webui is extremely slow. It'll take minutes to load each page. It took me 20 minutes to get these diagnostics. I tried restarting my server and that helped for a couple hours, but now it's doing it again. I'm not really sure what the issue is. All my docker containers appear to be working fine. I can access plex just fine. Edit: was able to grab more diagnostics after the restart. unraid-diagnostics-20230627-0826.zip unraid-diagnostics-20230627-1143.zip
-
I got an out of memory error and fix common problems said I should post the diagnostics here. unraid-diagnostics-20230521-0832.zip
-
Restored cache drive. I'm now 15+ days of uptime with no crashes or any other issues. Thank you!
-
There are 6 uncorrectable errors
-
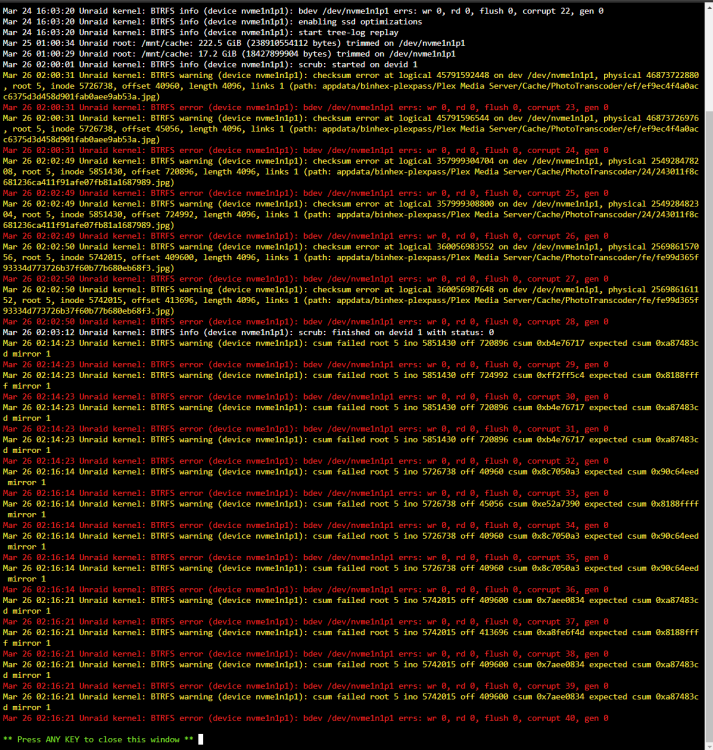
I switched off XMP in the bios. I am still getting this error now after a couple of days. Am I doing something else wrong? unraid-diagnostics-20230326-1409.zip
-
I have disabled C states before. I used to have this issue every other day and that solved it. As part of solving the original issue I changed to this new cache drive and got a new ram kit. I went from 4 8Gb sticks to 2 new 8gb sticks. Would just turning off XMP solve this? I'm not sure if I did that or not. I will have to check when I get back from work tonight.
-
I noticed all my docker containers weren't working, but my server was still running and everything appeared to be working fine on the dashboard. I clicked on the logs for my cache drive and saw a bunch of red BTRFS errors and saying it was now mounted read only. I have attached my diagnostics. I rebooted and everything is running fine now, but it did detect an unclean shutdown and started a parity check. I did some troubleshooting for unclean shutdowns previously and have my docker stop timeout at 240 seconds, so I think the issue is all in the cache drive. unraid-diagnostics-20230321-2030.zip
-
-
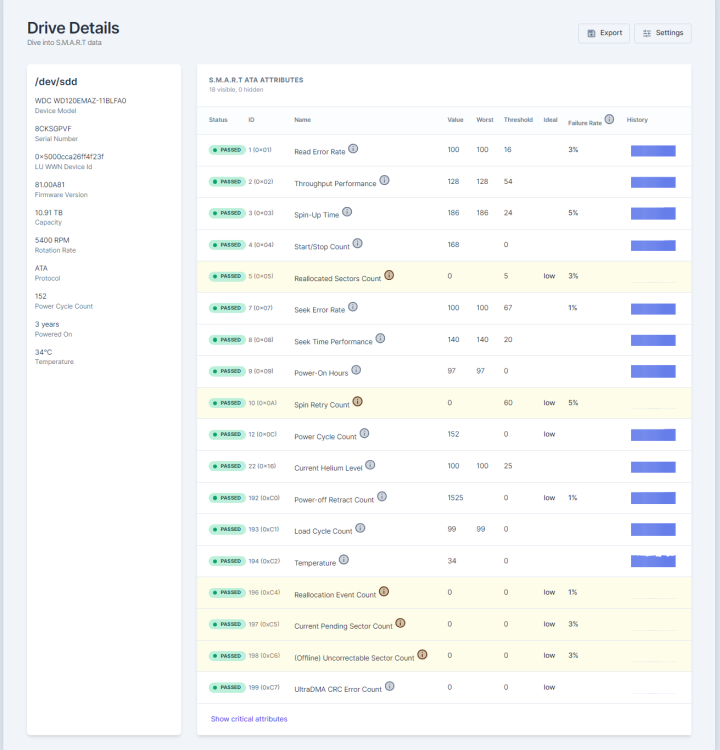
Good morning, I just woke up to the notification that one of my disks has an error. I checked Scrutiny and the most recent smart test was good, so I'm not sure if I can just rebuild it? I've attached the diagnostics. I've been having errors lately where every 3-5 days the GUI will completely lock up and I can't even ping the server. It makes me have to do a hard restart. I've been trying to trouble shoot that for a couple weeks. I just recently read something about disabling power states, which I was going to do this morning before I got this error. I also have a couple new sticks of ram coming this afternoon because I thought that could be the issue. I'm not sure what my next step should be here. Scrutiny: Error from disk logs: Jan 14 11:37:49 Unraid kernel: sd 9:0:0:0: [sdd] tag#7 UNKNOWN(0x2003) Result: hostbyte=0x00 driverbyte=DRIVER_OK cmd_age=5s Jan 14 11:37:49 Unraid kernel: sd 9:0:0:0: [sdd] tag#7 Sense Key : 0x5 [current] Jan 14 11:37:49 Unraid kernel: sd 9:0:0:0: [sdd] tag#7 ASC=0x21 ASCQ=0x4 Jan 14 11:37:49 Unraid kernel: sd 9:0:0:0: [sdd] tag#7 CDB: opcode=0x88 88 00 00 00 00 03 6e 29 e9 50 00 00 04 00 00 00 Jan 14 11:37:49 Unraid kernel: I/O error, dev sdd, sector 14733142352 op 0x0:(READ) flags 0x0 phys_seg 128 prio class 0 Jan 14 11:37:49 Unraid kernel: I/O error, dev sdd, sector 14733143376 op 0x0:(READ) flags 0x0 phys_seg 128 prio class 0 Jan 14 11:37:49 Unraid kernel: I/O error, dev sdd, sector 14733144400 op 0x0:(READ) flags 0x4000 phys_seg 168 prio class 0 Jan 14 11:37:49 Unraid kernel: I/O error, dev sdd, sector 14733145744 op 0x0:(READ) flags 0x4000 phys_seg 168 prio class 0 Jan 14 11:37:49 Unraid kernel: I/O error, dev sdd, sector 14733147088 op 0x0:(READ) flags 0x4000 phys_seg 168 prio class 0 Jan 14 11:37:49 Unraid kernel: I/O error, dev sdd, sector 14733148432 op 0x0:(READ) flags 0x4000 phys_seg 168 prio class 0 Jan 14 11:37:49 Unraid kernel: I/O error, dev sdd, sector 14733149776 op 0x0:(READ) flags 0x0 phys_seg 96 prio class 0 Jan 14 11:37:49 Unraid kernel: I/O error, dev sdd, sector 14733142352 op 0x1:(WRITE) flags 0x4000 phys_seg 168 prio class 0 Jan 14 11:37:49 Unraid kernel: sd 9:0:0:0: [sdd] Synchronizing SCSI cache Jan 14 11:37:49 Unraid kernel: sd 9:0:0:0: [sdd] Synchronize Cache(10) failed: Result: hostbyte=0x04 driverbyte=DRIVER_OK Jan 14 11:37:49 Unraid kernel: sd 9:0:0:0: [sdd] Stopping disk Jan 14 11:37:49 Unraid kernel: sd 9:0:0:0: [sdd] Start/Stop Unit failed: Result: hostbyte=0x04 driverbyte=DRIVER_OK Jan 14 12:16:45 Unraid emhttpd: error: hotplug_devices, 1730: No such file or directory (2): Error: tagged device WDC_WD120EMAZ-11BLFA0_8CKSGPVF was (sdd) is now (sdn) unraid-diagnostics-20230114-1223.zip
-
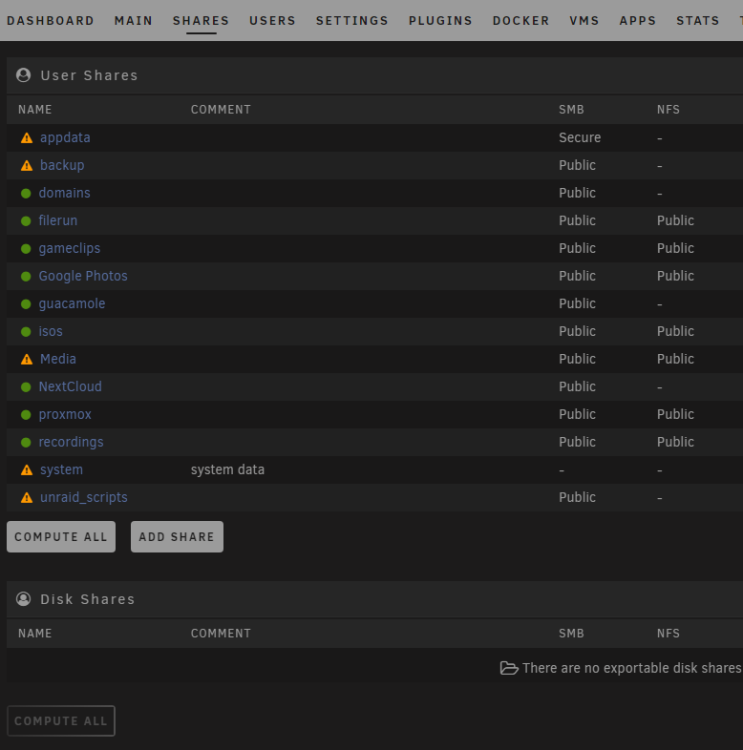
There wasn't a lost and found share created. I restarted and there isn't one even after restart.
-
Thank you! You all are absolute legends.
-
Phase 1 - find and verify superblock... - block cache size set to 1446096 entries Phase 2 - using internal log - zero log... zero_log: head block 3856388 tail block 3856388 - scan filesystem freespace and inode maps... - found root inode chunk Phase 3 - for each AG... - scan and clear agi unlinked lists... - process known inodes and perform inode discovery... - agno = 0 bad CRC for inode 712810574 bad CRC for inode 712810574, will rewrite cleared inode 712810574 - agno = 1 - agno = 2 - agno = 3 - agno = 4 - agno = 5 - agno = 6 - agno = 7 - agno = 8 - agno = 9 - agno = 10 - process newly discovered inodes... Phase 4 - check for duplicate blocks... - setting up duplicate extent list... - check for inodes claiming duplicate blocks... - agno = 1 - agno = 0 - agno = 2 - agno = 5 - agno = 6 - agno = 7 - agno = 8 - agno = 3 - agno = 9 - agno = 4 - agno = 10 Phase 5 - rebuild AG headers and trees... - agno = 0 - agno = 1 - agno = 2 - agno = 3 - agno = 4 - agno = 5 - agno = 6 - agno = 7 - agno = 8 - agno = 9 - agno = 10 - reset superblock... Phase 6 - check inode connectivity... - resetting contents of realtime bitmap and summary inodes - traversing filesystem ... - agno = 0 - agno = 1 - agno = 2 - agno = 3 - agno = 4 - agno = 5 - agno = 6 - agno = 7 - agno = 8 - agno = 9 - agno = 10 - traversal finished ... - moving disconnected inodes to lost+found ... Phase 7 - verify and correct link counts... XFS_REPAIR Summary Mon Dec 19 09:47:03 2022 Phase Start End Duration Phase 1: 12/19 09:46:31 12/19 09:46:31 Phase 2: 12/19 09:46:31 12/19 09:46:32 1 second Phase 3: 12/19 09:46:32 12/19 09:46:51 19 seconds Phase 4: 12/19 09:46:51 12/19 09:46:51 Phase 5: 12/19 09:46:51 12/19 09:46:53 2 seconds Phase 6: 12/19 09:46:53 12/19 09:47:02 9 seconds Phase 7: 12/19 09:47:02 12/19 09:47:02 Total run time: 31 seconds done I ran it with -V and got this output. Is this fixed now? I don't really have a great understanding of the issue.
-
I ran that and got this output: Phase 1 - find and verify superblock... - block cache size set to 1446096 entries Phase 2 - using internal log - zero log... zero_log: head block 3856388 tail block 3856388 - scan filesystem freespace and inode maps... - found root inode chunk Phase 3 - for each AG... - scan (but don't clear) agi unlinked lists... - process known inodes and perform inode discovery... - agno = 0 bad CRC for inode 712810574 bad CRC for inode 712810574, would rewrite would have cleared inode 712810574 - agno = 1 - agno = 2 - agno = 3 - agno = 4 - agno = 5 - agno = 6 - agno = 7 - agno = 8 - agno = 9 - agno = 10 - process newly discovered inodes... Phase 4 - check for duplicate blocks... - setting up duplicate extent list... - check for inodes claiming duplicate blocks... - agno = 1 - agno = 9 - agno = 7 - agno = 0 - agno = 3 - agno = 8 - agno = 5 - agno = 6 - agno = 10 - agno = 4 - agno = 2 bad CRC for inode 712810574, would rewrite would have cleared inode 712810574 No modify flag set, skipping phase 5 Phase 6 - check inode connectivity... - traversing filesystem ... - agno = 0 Metadata corruption detected at 0x46e010, inode 0x2a7ca04e dinode couldn't map inode 712810574, err = 117 - agno = 1 - agno = 2 - agno = 3 - agno = 4 - agno = 5 - agno = 6 - agno = 7 - agno = 8 - agno = 9 - agno = 10 - traversal finished ... - moving disconnected inodes to lost+found ... disconnected dir inode 2207801806, would move to lost+found Phase 7 - verify link counts... Metadata corruption detected at 0x46e010, inode 0x2a7ca04e dinode couldn't map inode 712810574, err = 117, can't compare link counts No modify flag set, skipping filesystem flush and exiting. XFS_REPAIR Summary Mon Dec 19 09:20:07 2022 Phase Start End Duration Phase 1: 12/19 09:19:38 12/19 09:19:38 Phase 2: 12/19 09:19:38 12/19 09:19:39 1 second Phase 3: 12/19 09:19:39 12/19 09:19:58 19 seconds Phase 4: 12/19 09:19:58 12/19 09:19:58 Phase 5: Skipped Phase 6: 12/19 09:19:58 12/19 09:20:07 9 seconds Phase 7: 12/19 09:20:07 12/19 09:20:07 Total run time: 29 seconds unraid-diagnostics-20221219-0921.zip
-
Earlier, I just turned off xmp and ran all my ram at 2666 and cleared the cache drive and everything was fine for a week. Now I'm getting similar errors so I will run a memtest and see what happens. I've attached diagnostics for the errors I'm getting now. unraid-diagnostics-20221209-1428.zip
-
Hello, Came home to some a bunch of errors on 2/3 of my cache drives. I have tried running a scrub, but it seems to complete in 2 seconds and nothing happens. I've attached my logs. My docker image does not seem to be full and neither is the cache drive, so I'm not really sure what's going on. Any help would be appreciated. Edit: Fix common problems says: unable to write to cache and unable to write to docker image Edit2: On the docker tab there are a lot of these errors: Warning: file_put_contents(/var/lib/docker/unraid/images/grocy-icon.png): failed to open stream: Read-only file system in /usr/local/emhttp/plugins/dynamix.docker.manager/include/DockerClient.php on line 93 Dec 2 02:00:03 Unraid kernel: BTRFS error (device nvme0n1p1): bdev /dev/nvme0n1p1 errs: wr 0, rd 0, flush 0, corrupt 150, gen 0 Dec 2 02:00:03 Unraid kernel: BTRFS warning (device nvme0n1p1): csum failed root 5 ino 17790576 off 1602236416 csum 0x7b6aa7d1 expected csum 0x9007ed7c mirror 1 Dec 1 23:34:33 Unraid kernel: BTRFS error (device nvme2n1p1): block=1715306496 write time tree block corruption detected Dec 1 23:34:33 Unraid kernel: BTRFS: error (device nvme2n1p1) in btrfs_commit_transaction:2418: errno=-5 IO failure (Error while writing out transaction) Dec 1 23:34:33 Unraid kernel: BTRFS info (device nvme2n1p1: state E): forced readonly Dec 1 23:34:33 Unraid kernel: BTRFS warning (device nvme2n1p1: state E): Skipping commit of aborted transaction. Dec 1 23:34:33 Unraid kernel: BTRFS: error (device nvme2n1p1: state EA) in cleanup_transaction:1982: errno=-5 IO failure Dec 1 23:34:33 Unraid kernel: BTRFS: error (device nvme2n1p1: state EA) in btrfs_sync_log:3332: errno=-5 IO failure unraid-syslog-20221202-2058.zip
-
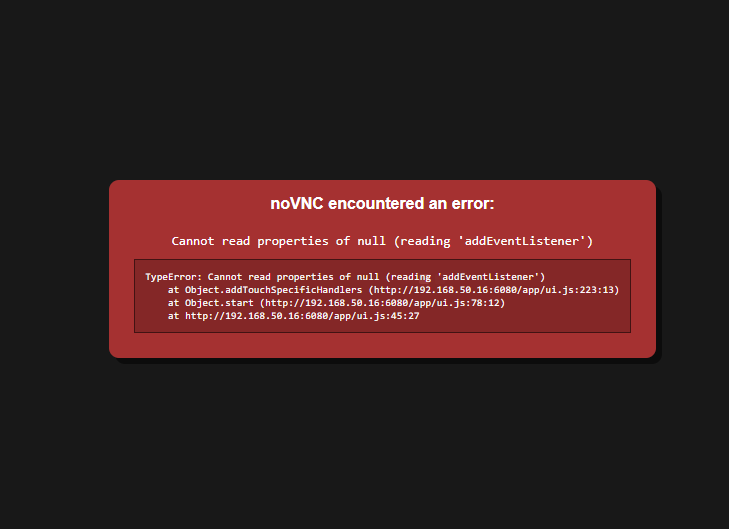
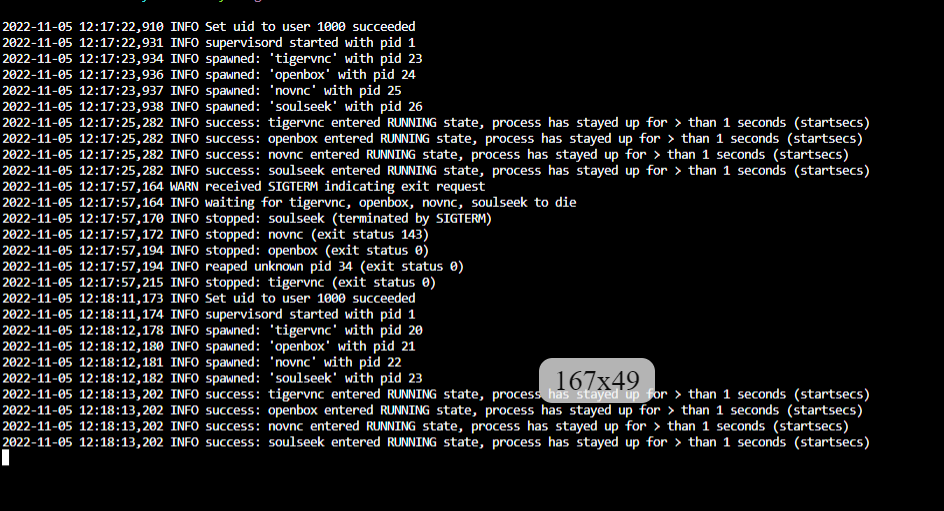
I have followed some of the unraid docker configs posted in this thread. I can get the container to spin up and run according to the logs, but I keep getting this noVNC error. I've attached snips on my docker config, logs, and the error. Any idea what the issue could be?
-
I recently had a drive fail. This is the 3rd time I've had that disk/the rma disk fail, so I've kind of given up on it. I'm now trying to shrink my array by one. So I followed the steps to reset my config and reduce the array by 1. I am now rebuilding parity with the bad disk unassigned but it is going very slowly. I checked my Hba and it appears to be running in x8, so I'm not really sure what is causing the issue. 0d:00.0 Serial Attached SCSI controller: Broadcom / LSI SAS2008 PCI-Express Fusion-MPT SAS-2 [Falcon] (rev 03) Subsystem: Broadcom / LSI SAS2008 PCI-Express Fusion-MPT SAS-2 [Falcon] Control: I/O+ Mem+ BusMaster+ SpecCycle- MemWINV- VGASnoop- ParErr- Stepping- SERR- FastB2B- DisINTx+ Status: Cap+ 66MHz- UDF- FastB2B- ParErr- DEVSEL=fast >TAbort- <TAbort- <MAbort- >SERR- <PERR- INTx- Latency: 0, Cache Line Size: 64 bytes Interrupt: pin A routed to IRQ 163 IOMMU group: 30 Region 0: I/O ports at e000 [size=256] Region 1: Memory at c04c0000 (64-bit, non-prefetchable) [size=16K] Region 3: Memory at c0080000 (64-bit, non-prefetchable) [size=256K] Expansion ROM at c0000000 [disabled] [size=512K] Capabilities: [50] Power Management version 3 Flags: PMEClk- DSI- D1+ D2+ AuxCurrent=0mA PME(D0-,D1-,D2-,D3hot-,D3cold-) Status: D0 NoSoftRst+ PME-Enable- DSel=0 DScale=0 PME- Capabilities: [68] Express (v2) Endpoint, MSI 00 DevCap: MaxPayload 4096 bytes, PhantFunc 0, Latency L0s <64ns, L1 <1us ExtTag+ AttnBtn- AttnInd- PwrInd- RBE+ FLReset+ SlotPowerLimit 0.000W DevCtl: CorrErr+ NonFatalErr+ FatalErr+ UnsupReq+ RlxdOrd+ ExtTag+ PhantFunc- AuxPwr- NoSnoop+ FLReset- MaxPayload 512 bytes, MaxReadReq 512 bytes DevSta: CorrErr- NonFatalErr- FatalErr- UnsupReq- AuxPwr- TransPend- LnkCap: Port #0, Speed 5GT/s, Width x8, ASPM L0s, Exit Latency L0s <64ns ClockPM- Surprise- LLActRep- BwNot- ASPMOptComp- LnkCtl: ASPM Disabled; RCB 64 bytes, Disabled- CommClk+ ExtSynch- ClockPM- AutWidDis- BWInt- AutBWInt- LnkSta: Speed 5GT/s (ok), Width x8 (ok) TrErr- Train- SlotClk+ DLActive- BWMgmt- ABWMgmt- DevCap2: Completion Timeout: Range BC, TimeoutDis+ NROPrPrP- LTR- 10BitTagComp- 10BitTagReq- OBFF Not Supported, ExtFmt- EETLPPrefix- EmergencyPowerReduction Not Supported, EmergencyPowerReductionInit- FRS- TPHComp- ExtTPHComp- AtomicOpsCap: 32bit- 64bit- 128bitCAS- DevCtl2: Completion Timeout: 50us to 50ms, TimeoutDis- LTR- OBFF Disabled, AtomicOpsCtl: ReqEn- LnkCtl2: Target Link Speed: 5GT/s, EnterCompliance- SpeedDis- Transmit Margin: Normal Operating Range, EnterModifiedCompliance- ComplianceSOS- Compliance De-emphasis: -6dB LnkSta2: Current De-emphasis Level: -6dB, EqualizationComplete- EqualizationPhase1- EqualizationPhase2- EqualizationPhase3- LinkEqualizationRequest- Retimer- 2Retimers- CrosslinkRes: unsupported Capabilities: [d0] Vital Product Data pcilib: sysfs_read_vpd: read failed: No such device Not readable Capabilities: [a8] MSI: Enable- Count=1/1 Maskable- 64bit+ Address: 0000000000000000 Data: 0000 Capabilities: [c0] MSI-X: Enable+ Count=15 Masked- Vector table: BAR=1 offset=00002000 PBA: BAR=1 offset=00003800 Capabilities: [100 v1] Advanced Error Reporting UESta: DLP- SDES- TLP- FCP- CmpltTO- CmpltAbrt- UnxCmplt- RxOF- MalfTLP- ECRC- UnsupReq- ACSViol- UEMsk: DLP- SDES- TLP- FCP- CmpltTO- CmpltAbrt- UnxCmplt- RxOF- MalfTLP- ECRC- UnsupReq- ACSViol- UESvrt: DLP+ SDES+ TLP- FCP+ CmpltTO- CmpltAbrt- UnxCmplt- RxOF+ MalfTLP+ ECRC- UnsupReq- ACSViol- CESta: RxErr- BadTLP- BadDLLP- Rollover- Timeout- AdvNonFatalErr- CEMsk: RxErr- BadTLP- BadDLLP- Rollover- Timeout- AdvNonFatalErr+ AERCap: First Error Pointer: 00, ECRCGenCap+ ECRCGenEn- ECRCChkCap+ ECRCChkEn- MultHdrRecCap- MultHdrRecEn- TLPPfxPres- HdrLogCap- HeaderLog: 00000000 00000000 00000000 00000000 Capabilities: [138 v1] Power Budgeting <?> Capabilities: [150 v1] Single Root I/O Virtualization (SR-IOV) IOVCap: Migration-, Interrupt Message Number: 000 IOVCtl: Enable- Migration- Interrupt- MSE- ARIHierarchy+ IOVSta: Migration- Initial VFs: 16, Total VFs: 16, Number of VFs: 0, Function Dependency Link: 00 VF offset: 1, stride: 1, Device ID: 0072 Supported Page Size: 00000553, System Page Size: 00000001 Region 0: Memory at 00000000c04c4000 (64-bit, non-prefetchable) Region 2: Memory at 00000000c00c0000 (64-bit, non-prefetchable) VF Migration: offset: 00000000, BIR: 0 Capabilities: [190 v1] Alternative Routing-ID Interpretation (ARI) ARICap: MFVC- ACS-, Next Function: 0 ARICtl: MFVC- ACS-, Function Group: 0 Kernel driver in use: mpt3sas Kernel modules: mpt3sas unraid-diagnostics-20220805-1644.zip
-
I was able to figure out the issue, I'm going to post it both places in case anyone else runs into the same problem. For some reason the permissions for that share were messed up. I just had to go into the unraid file manager. Check the box next to my gameclips share, and then hit the permissions button at the bottom and change all of them to read/write. The group and other ones both were no access before for some reason. https://imgur.com/a/knBhLY5
-
Having an issue where the docker container does not have access to read the video files. Getting this error: [error] 11#11: *23 open() "/processed/derived/e254ff204511325c2ae45302981cc677/poster.jpg" failed (13: Permission denied), client: 192.168.50.103, server: default, request: "GET /_content/derived/e254ff204511325c2ae45302981cc677/poster.jpg HTTP/1.1", host: "192.168.50.16:8081", referrer: "http://192.168.50.16:8081/" and getting this error when I scan the database: 2022-07-01 17:48:47,116 INFO cli.create_posters:212 | Checking for videos with missing posters... 2022-07-01 17:48:47,116 WARNING cli.create_posters:217 | Skipping creation of poster for video aff0133875f1fafc5f93d4d8fd7c34eb because the video at /processed/video_links/aff0133875f1fafc5f93d4d8fd7c34eb.mp4 does not exist or is not accessible 2022-07-01 17:48:47,116 WARNING cli.create_posters:217 | Skipping creation of poster for video 44be4b1853f05f38c3fcb329985e4d90 because the video at /processed/video_links/44be4b1853f05f38c3fcb329985e4d90.mp4 does not exist or is not accessible 2022-07-01 17:48:47,117 WARNING cli.create_posters:217 | Skipping creation of poster for video ae8ab7f2af99dd9ee7e76ee532166042 because the video at /processed/video_links/ae8ab7f2af99dd9ee7e76ee532166042.mp4 does not exist or is not accessible





