






zoggy
Members
-
Joined
-
Last visited
Everything posted by zoggy
-
it's any version you want it to be from 14 to 16 (jarvis beta4) by setting the VERSION variable. and you only have to keep the same major version across a mysql setup, point releases are immaterial because the mysql d/bases don't change. just to note, that yes the db version stays pretty static for final releases.. however those that live off git / use beta/rc... it does change. those are curious if upgrading to x version is going to involve a new db version they can always refer to: http://kodi.wiki/view/Database_versions
-
the site was up.. just was seeing the 404 page was being served by dockerhub at the time. just tried url again, its working now. example of the 404 page (purposely causing it by using bad page): https://hub.docker.com/r/linuxserver/kodi-headless2/
-
404 when trying to go to https://hub.docker.com/r/linuxserver/kodi-headless/
-
Does this plugin take care of that? is that needed/way to test if its needed? also side question, for unraid6 does this still apply: Per: http://lime-technology.com/wiki/index.php/Upgrading_to_UnRAID_v6#More_Tips http://lime-technology.com/forum/index.php?topic=41126.0
-
Per: http://lime-technology.com/wiki/index.php/Upgrading_to_UnRAID_v6#New_Permissions Does this plugin take care of that? is that needed/way to test if its needed? also side question, for unraid6 does this still apply: Per: http://lime-technology.com/wiki/index.php/Upgrading_to_UnRAID_v6#More_Tips
-
Have you tested it with 64bit? I have unraid 5.x (so no, 32bit only), when trying out cache_dis I was using: # cache_dirs -w -i "Movies" -i "TV" -F Should I have been doing something to limit the depth or changing ulimit? Per: http://lime-technology.com/forum/index.php?topic=4500.msg290565#msg290565 --- i understand cache_dirs wants to keep the filelist? folder list? in ram.. seems like almost 4gb of ram for ~940gb of movies is a bit excessive. :/mnt/user/Movies# du -h --max-depth=1 936G ./Movies-SD 44G ./Movies-Asian 68G ./Movies-Ghibli 9.4G ./Movies-Stand-Up :/mnt/user/Movies# du -a | cut -d/ -f2 | sort | uniq -c | sort -nr 6101 Movies-SD 899 Movies-HD 179 Movies-Asian 60 Movies-Ghibli 41 Movies-Stand-Up --
-
dunno if you recall my testing but i have 4gb of ram and cache_dirs couldnt handle just one of my shares (either movies or music)....
-
but for a lot of people all this does is make your unraid crash due to out of memory...
-
i understand cache_dirs wants to keep the filelist? folder list? in ram.. seems like almost 4gb of ram for ~940gb of movies is a bit excessive. It's not how large the data set is, it's how many files. When the kernel tries to throw away the dentries, cache_dir is there forcing them to stay active. It's doing what it was intended to do. I don't have the code, but the chances are that it also adjusts the kernel to allow the dentries to be preferred to be in ram. I think it's an architecture limitation. It's an issue with low memory. When you run out of low memory, you start to get OOM errors. It's kernel tunings along with the md driver tunings. I'm hoping the x64 architecture will resolve this issue. I had 8GB and I had the same issues with a huge number of files. Another person had problems with an app and running out of memory. Here's the thread, you can also see what I put in my rsync script. http://lime-technology.com/forum/index.php?topic=28920.msg258077#msg258077 And another person who put the drop_cache line in the mover script. http://lime-technology.com/forum/index.php?topic=29798.msg267760#msg267760 right, which is why I posted how many unique files were in the folders. there's not that many folders or files... just checked again and per the share it says there are: 6,054 files and 1,252 folders wasting so much memory and increase cpu load non stop with a chance of OOM (no swap) just does not seem like its worth it in the end. oh well, maybe 0.6.x will bring some optimizations so one wouldn't need this sort of hack anyways. oh well thanks for all the feedback but I'm giving up on this for now
-
i understand cache_dirs wants to keep the filelist? folder list? in ram.. seems like almost 4gb of ram for ~940gb of movies is a bit excessive. :/mnt/user/Movies# du -h --max-depth=1 936G ./Movies-SD 44G ./Movies-Asian 68G ./Movies-Ghibli 9.4G ./Movies-Stand-Up :/mnt/user/Movies# du -a | cut -d/ -f2 | sort | uniq -c | sort -nr 6101 Movies-SD 899 Movies-HD 179 Movies-Asian 60 Movies-Ghibli 41 Movies-Stand-Up
-
Base (45 hours running cache_dirs): top - 08:17:00 up 5 days, 21:45, 2 users, load average: 0.27, 0.32, 0.35 Tasks: 145 total, 1 running, 144 sleeping, 0 stopped, 0 zombie Cpu(s): 0.0%us, 0.9%sy, 2.3%ni, 96.8%id, 0.0%wa, 0.0%hi, 0.0%si, 0.0%st Mem: 4026904k total, 3085816k used, 941088k free, 182972k buffers Swap: 0k total, 0k used, 0k free, 2678436k cached Base (47 hours running cache_dirs): Active / Total Objects (% used) : 648683 / 717451 (90.4%) Active / Total Slabs (% used) : 14877 / 14877 (100.0%) Active / Total Caches (% used) : 54 / 99 (54.5%) Active / Total Size (% used) : 79111.36K / 84939.12K (93.1%) Minimum / Average / Maximum Object : 0.01K / 0.12K / 16.12K OBJS ACTIVE USE OBJ SIZE SLABS OBJ/SLAB CACHE SIZE NAME 426028 375540 88% 0.05K 5836 73 23344K buffer_head 45110 41699 92% 0.30K 1735 26 13880K radix_tree_node 27455 27455 100% 0.41K 1445 19 11560K reiser_inode_cache 74912 72241 96% 0.12K 2341 32 9364K dentry 16452 16452 100% 0.44K 914 18 7312K fuse_inode 1488 1488 100% 2.58K 124 12 3968K unraid/md 7875 7875 100% 0.31K 315 25 2520K inode_cache Ran: # cat /proc/sys/vm/drop_caches 0 echo 1 > /proc/sys/vm/drop_caches After: top - 23:14:56 up 4 days, 12:43, 1 user, load average: 0.11, 0.52, 0.50 top - 10:48:10 up 6 days, 16 min, 2 users, load average: 0.16, 0.69, 0.55 Tasks: 145 total, 2 running, 143 sleeping, 0 stopped, 0 zombie Cpu(s): 0.0%us, 0.4%sy, 1.1%ni, 98.5%id, 0.0%wa, 0.0%hi, 0.0%si, 0.0%st Mem: 4026904k total, 491452k used, 3535452k free, 38608k buffers Swap: 0k total, 0k used, 0k free, 237576k cached Active / Total Objects (% used) : 260470 / 589736 (44.2%) Active / Total Slabs (% used) : 13075 / 13075 (100.0%) Active / Total Caches (% used) : 54 / 99 (54.5%) Active / Total Size (% used) : 51250.83K / 77518.22K (66.1%) Minimum / Average / Maximum Object : 0.01K / 0.13K / 16.12K OBJS ACTIVE USE OBJ SIZE SLABS OBJ/SLAB CACHE SIZE NAME 299884 13896 4% 0.05K 4108 73 16432K buffer_head 43602 14627 33% 0.30K 1677 26 13416K radix_tree_node 27455 27455 100% 0.41K 1445 19 11560K reiser_inode_cache 74912 71904 95% 0.12K 2341 32 9364K dentry 16452 16452 100% 0.44K 914 18 7312K fuse_inode 1488 1488 100% 2.58K 124 12 3968K unraid/md 7875 7875 100% 0.31K 315 25 2520K inode_cache Notice that memory usage dropped quite a bit... so if this is the 'magic' fix why doesn't cache_dirs just do this during the mover script time?
-
Since cache_dirs is just a shell script, it is basically doing this in your example: create a semaphore_file (it can be removed with "cache_dirs -q" to cause cache_dirs to stop) while semaphore_file_exists do s=current_time (to track how long it takes to perform the "find" command) find /mnt/disk1/Movies >/dev/null 2>/dev/null find /mnt/disk2/Movies >/dev/null 2>/dev/null find /mnt/disk3/Movies >/dev/null 2>/dev/null find /mnt/disk4/Movies >/dev/null 2>/dev/null f=finish_time_of_find d=duration sleep for X seconds based on calculated duration done If the shell had a memory leak, it could be the culprit as it loops. (although possible, it is more likely that something else has the memory leak, since so many others use the "shell" and typically it gets found/fixed by the linux community.) At one point (long ago) there was a limit on the number of child processes a shell could "fork." That was addressed long ago by using a sub-shell It could as easily be an issue in the kernel, or in the user-share file system. (although the user-shares are not normally being scanned by the "find"commands) In any case, a memory leak would would normally show as increased memory size of a given process. sorting as you have, by "M" should show the culprit. Joe L. Just updated my post above with the values at 27hours in. So right now, where is all the memory it's used at (I don't see any process memory actually show the allocation of the memory)? I don't run other apps/plugins (besides unmenu - I do have the status/powerdown scripts installed but obviously those arent running).
-
Just started a new cache_dir process (as root) at the top of the hour, this time I'm doing: cache_dirs -w -i "Movies" Running top (as root) with 30sec delay, sorted by memory (M), showing threads (H). After 11mins in: top - 11:11:36 up 4 days, 39 min, 1 user, load average: 0.68, 0.85, 0.49 Tasks: 139 total, 1 running, 138 sleeping, 0 stopped, 0 zombie Cpu(s): 1.2%us, 0.4%sy, 0.0%ni, 98.4%id, 0.0%wa, 0.0%hi, 0.0%si, 0.0%st Mem: 4026904k total, 2868600k used, 1158304k free, 148744k buffers Swap: 0k total, 0k used, 0k free, 2521436k cached PID USER PR NI VIRT RES SHR S %CPU %MEM TIME+ COMMAND 2973 zoggy 20 0 22208 9068 7360 S 0 0.2 2:13.65 smbd 3603 root 20 0 21184 7940 6616 S 0 0.2 0:59.29 smbd 2533 root 20 0 16552 3872 3140 S 0 0.1 0:00.31 smbd 2933 root 20 0 4820 3536 940 S 0 0.1 0:00.10 awk 1253 root 20 0 8196 2924 2240 S 0 0.1 0:06.99 ntpd 3175 root 20 0 14232 2328 576 S 0 0.1 0:00.00 shfs 3176 root 20 0 14232 2328 576 S 0 0.1 0:44.63 shfs 3177 root 20 0 14232 2328 576 S 0 0.1 0:44.87 shfs 3183 root 20 0 14232 2328 576 S 0 0.1 0:42.44 shfs 5017 root 20 0 14232 2328 576 S 0 0.1 0:38.95 shfs 2516 root 20 0 10004 2036 1480 S 0 0.1 0:01.96 nmbd 17536 root 20 0 6876 1948 1496 S 0 0.0 0:00.08 in.telnetd 2579 root 20 0 16552 1932 1200 S 0 0.0 0:00.33 smbd 17537 root 20 0 4304 1720 1296 S 0 0.0 0:00.02 bash 2572 avahi 20 0 3052 1588 1348 S 0 0.0 0:00.03 avahi-daemon 1288 root 20 0 5768 1492 1164 S 0 0.0 0:00.46 emhttp 2606 root 20 0 5768 1492 1164 S 0 0.0 0:39.45 emhttp 3166 root 20 0 10284 1264 564 S 0 0.0 0:00.00 shfs 3167 root 20 0 10284 1264 564 S 0 0.0 0:24.55 shfs 3168 root 20 0 10284 1264 564 S 0 0.0 0:28.35 shfs 6465 root 20 0 10284 1264 564 S 0 0.0 0:28.14 shfs 22744 root 20 0 2472 1100 824 R 0 0.0 0:00.51 top 799 root 16 -4 2476 1032 496 S 0 0.0 0:00.04 udevd 17592 root 20 0 4208 920 564 S 0 0.0 0:00.17 cache_dirs 17593 root 20 0 4208 920 564 S 0 0.0 0:00.17 cache_dirs 17595 root 20 0 4208 920 564 S 0 0.0 0:00.17 cache_dirs 17597 root 20 0 4208 920 564 S 0 0.0 0:00.17 cache_dirs 17599 root 20 0 4208 920 564 S 0 0.0 0:00.18 cache_dirs 17601 root 20 0 4208 920 564 S 0 0.0 0:00.17 cache_dirs 17602 root 20 0 4208 920 564 S 0 0.0 0:00.17 cache_dirs 17603 root 20 0 4208 920 564 S 0 0.0 0:00.17 cache_dirs 17604 root 20 0 4208 920 564 S 0 0.0 0:00.17 cache_dirs 17605 root 20 0 4208 920 564 S 0 0.0 0:00.17 cache_dirs 17625 root 20 0 4268 900 484 S 0 0.0 0:00.73 cache_dirs -- trimmed the top output to the first 0.0 mem item to reduce uneeded lines -- After 1h in: top - 12:01:18 up 4 days, 1:29, 1 user, load average: 0.88, 0.53, 0.50 Tasks: 139 total, 1 running, 138 sleeping, 0 stopped, 0 zombie Cpu(s): 1.5%us, 0.5%sy, 0.0%ni, 97.8%id, 0.0%wa, 0.0%hi, 0.2%si, 0.0%st Mem: 4026904k total, 2869684k used, 1157220k free, 148744k buffers Swap: 0k total, 0k used, 0k free, 2521436k cached PID USER PR NI VIRT RES SHR S %CPU %MEM TIME+ COMMAND 2973 root 20 0 22208 9068 7360 S 0 0.2 2:14.03 smbd 3603 root 20 0 21184 7940 6616 S 0 0.2 0:59.30 smbd 2533 root 20 0 16552 3872 3140 S 0 0.1 0:00.31 smbd 2933 root 20 0 4820 3536 940 S 0 0.1 0:00.10 awk 1253 root 20 0 8196 2924 2240 S 0 0.1 0:07.06 ntpd 3175 root 20 0 14232 2328 576 S 0 0.1 0:00.00 shfs 3176 root 20 0 14232 2328 576 S 0 0.1 0:44.70 shfs 3177 root 20 0 14232 2328 576 S 0 0.1 0:44.95 shfs 3183 root 20 0 14232 2328 576 S 0 0.1 0:42.54 shfs 5017 root 20 0 14232 2328 576 S 0 0.1 0:39.07 shfs 2516 root 20 0 10004 2036 1480 S 0 0.1 0:01.99 nmbd 17536 root 20 0 6876 1948 1496 S 0 0.0 0:00.10 in.telnetd 2579 root 20 0 16552 1932 1200 S 0 0.0 0:00.33 smbd 17537 root 20 0 4304 1720 1296 S 0 0.0 0:00.02 bash 2572 avahi 20 0 3052 1588 1348 S 0 0.0 0:00.03 avahi-daemon 1288 root 20 0 5768 1492 1164 S 0 0.0 0:00.46 emhttp 2606 root 20 0 5768 1492 1164 S 0 0.0 0:39.82 emhttp 17625 root 20 0 4692 1324 484 S 0 0.0 0:09.42 cache_dirs 3166 root 20 0 10284 1264 564 S 0 0.0 0:00.00 shfs 3167 root 20 0 10284 1264 564 S 0 0.0 0:24.55 shfs 3168 root 20 0 10284 1264 564 S 0 0.0 0:28.35 shfs 6465 root 20 0 10284 1264 564 S 0 0.0 0:28.14 shfs 22744 root 20 0 2472 1100 824 R 0 0.0 0:00.97 top 799 root 16 -4 2476 1032 496 S 0 0.0 0:00.04 udevd 17592 root 20 0 4244 960 568 S 0 0.0 0:00.88 cache_dirs 17593 root 20 0 4244 960 568 S 0 0.0 0:00.87 cache_dirs 17595 root 20 0 4244 960 568 S 0 0.0 0:00.89 cache_dirs 17597 root 20 0 4244 960 568 S 0 0.0 0:00.89 cache_dirs 17599 root 20 0 4244 960 568 S 0 0.0 0:00.90 cache_dirs 17601 root 20 0 4244 960 568 S 0 0.0 0:00.88 cache_dirs 17602 root 20 0 4244 960 568 S 0 0.0 0:00.88 cache_dirs 17603 root 20 0 4244 960 568 S 0 0.0 0:00.90 cache_dirs 17604 root 20 0 4244 960 568 S 0 0.0 0:00.88 cache_dirs 17605 root 20 0 4244 960 568 S 0 0.0 0:00.88 cache_dirs After 7 hours in: top - 18:11:06 up 4 days, 7:39, 1 user, load average: 0.73, 0.75, 0.71 Tasks: 140 total, 2 running, 138 sleeping, 0 stopped, 0 zombie Cpu(s): 0.0%us, 0.5%sy, 1.2%ni, 98.3%id, 0.0%wa, 0.0%hi, 0.0%si, 0.0%st Mem: 4026904k total, 2940248k used, 1086656k free, 148860k buffers Swap: 0k total, 0k used, 0k free, 2591688k cached PID USER PR NI VIRT RES SHR S %CPU %MEM TIME+ COMMAND 2973 zoggy 20 0 22208 9068 7360 S 0 0.2 2:17.05 smbd 3603 root 20 0 21184 7940 6616 S 0 0.2 0:59.37 smbd 2533 root 20 0 16552 3872 3140 S 0 0.1 0:00.34 smbd 2933 root 20 0 4820 3536 940 S 0 0.1 0:00.10 awk 15503 root 20 0 16884 3360 2592 S 0 0.1 0:00.02 smbd 1253 root 20 0 8196 2924 2240 S 0 0.1 0:07.61 ntpd 3175 root 20 0 14228 2144 576 S 0 0.1 0:00.00 shfs 3176 root 20 0 14228 2144 576 S 0 0.1 0:45.33 shfs 3177 root 20 0 14228 2144 576 S 0 0.1 0:45.63 shfs 3183 root 20 0 14228 2144 576 S 0 0.1 0:43.16 shfs 5017 root 20 0 14228 2144 576 S 0 0.1 0:39.68 shfs 2516 root 20 0 10004 2036 1480 S 0 0.1 0:02.17 nmbd 17536 root 20 0 6876 1948 1496 S 0 0.0 0:00.23 in.telnetd After 12 hours in: top - 23:15:17 up 4 days, 12:43, 1 user, load average: 0.21, 0.52, 0.50 Tasks: 140 total, 2 running, 138 sleeping, 0 stopped, 0 zombie Cpu(s): 0.0%us, 0.3%sy, 1.3%ni, 98.3%id, 0.0%wa, 0.0%hi, 0.0%si, 0.0%st Mem: 4026904k total, 3894748k used, 132156k free, 146048k buffers Swap: 0k total, 0k used, 0k free, 3541400k cached PID USER PR NI VIRT RES SHR S %CPU %MEM TIME+ COMMAND 2973 zoggy 20 0 22208 9092 7384 S 0 0.2 2:20.72 smbd 3603 root 20 0 21184 8136 6812 S 0 0.2 1:15.47 smbd 2533 root 20 0 16552 3872 3140 S 0 0.1 0:00.35 smbd 2933 root 20 0 4820 3536 940 S 0 0.1 0:00.10 awk 15503 root 20 0 16884 3360 2592 S 0 0.1 0:00.05 smbd 3175 root 20 0 15416 3232 576 S 0 0.1 0:00.00 shfs 3176 root 20 0 15416 3232 576 S 0 0.1 0:48.71 shfs 3177 root 20 0 15416 3232 576 S 0 0.1 0:48.87 shfs 3183 root 20 0 15416 3232 576 S 0 0.1 0:46.52 shfs 5017 root 20 0 15416 3232 576 S 0 0.1 0:43.15 shfs 1253 root 20 0 8196 2924 2240 S 0 0.1 0:08.06 ntpd 2516 root 20 0 10004 2036 1480 S 0 0.1 0:02.33 nmbd 17536 root 20 0 6876 1948 1496 S 0 0.0 0:00.34 in.telnetd After 12 hours in (slabtop): # slabtop -s c Active / Total Objects (% used) : 335034 / 590252 (56.8%) Active / Total Slabs (% used) : 12385 / 12385 (100.0%) Active / Total Caches (% used) : 54 / 99 (54.5%) Active / Total Size (% used) : 56141.15K / 71910.02K (78.1%) Minimum / Average / Maximum Object : 0.01K / 0.12K / 16.12K OBJS ACTIVE USE OBJ SIZE SLABS OBJ/SLAB CACHE SIZE NAME 337771 95197 28% 0.05K 4627 73 18508K buffer_head 41522 38448 92% 0.30K 1597 26 12776K radix_tree_node 20216 20216 100% 0.41K 1064 19 8512K reiser_inode_cache 61088 59784 97% 0.12K 1909 32 7636K dentry 13032 13032 100% 0.44K 724 18 5792K fuse_inode 1488 1488 100% 2.58K 124 12 3968K unraid/md 7875 7875 100% 0.31K 315 25 2520K inode_cache After 15 hours in: top - 02:29:32 up 4 days, 15:57, 2 users, load average: 0.40, 0.30, 0.42 Tasks: 143 total, 1 running, 142 sleeping, 0 stopped, 0 zombie Cpu(s): 0.0%us, 1.0%sy, 2.6%ni, 96.4%id, 0.0%wa, 0.0%hi, 0.0%si, 0.0%st Mem: 4026904k total, 3896212k used, 130692k free, 147324k buffers Swap: 0k total, 0k used, 0k free, 3534348k cached PID USER PR NI VIRT RES SHR S %CPU %MEM TIME+ COMMAND 2973 root 20 0 22208 9092 7384 S 0 0.2 2:22.01 smbd 3603 root 20 0 21184 8228 6904 S 0 0.2 1:19.72 smbd 2533 root 20 0 16552 3872 3140 S 0 0.1 0:00.35 smbd 15503 root 20 0 21172 3748 2972 S 0 0.1 0:00.08 smbd 2933 root 20 0 4820 3536 940 S 0 0.1 0:00.10 awk 3175 root 20 0 15432 3000 576 S 0 0.1 0:00.00 shfs 3176 root 20 0 15432 3000 576 S 0 0.1 0:50.77 shfs 3177 root 20 0 15432 3000 576 S 0 0.1 0:50.89 shfs 3183 root 20 0 15432 3000 576 S 0 0.1 0:48.40 shfs 5017 root 20 0 15432 3000 576 S 0 0.1 0:45.09 shfs 1253 root 20 0 8196 2924 2240 S 0 0.1 0:08.35 ntpd 2516 root 20 0 10004 2036 1480 S 0 0.1 0:02.41 nmbd 8889 root 20 0 6876 1952 1496 S 0 0.0 0:00.03 in.telnetd ... After 15 hours in (slabtop): Active / Total Objects (% used) : 334612 / 591238 (56.6%) Active / Total Slabs (% used) : 12390 / 12390 (100.0%) Active / Total Caches (% used) : 54 / 99 (54.5%) Active / Total Size (% used) : 56181.47K / 72017.39K (78.0%) Minimum / Average / Maximum Object : 0.01K / 0.12K / 16.12K OBJS ACTIVE USE OBJ SIZE SLABS OBJ/SLAB CACHE SIZE NAME 337552 93578 27% 0.05K 4624 73 18496K buffer_head 40976 38717 94% 0.30K 1576 26 12608K radix_tree_node 20349 20349 100% 0.41K 1071 19 8568K reiser_inode_cache 61184 60592 99% 0.12K 1912 32 7648K dentry 13176 13176 100% 0.44K 732 18 5856K fuse_inode 1488 1488 100% 2.58K 124 12 3968K unraid/md 7875 7875 100% 0.31K 315 25 2520K inode_cache can see the mem free dwindling away.. but where is it going? just memory leak in cache_dirs? After 27 hours in: top - 14:16:19 up 5 days, 3:44, 2 users, load average: 1.01, 1.18, 1.16 Tasks: 142 total, 1 running, 141 sleeping, 0 stopped, 0 zombie Cpu(s): 0.0%us, 0.7%sy, 1.5%ni, 97.8%id, 0.0%wa, 0.0%hi, 0.1%si, 0.0%st Mem: 4026904k total, 3887944k used, 138960k free, 147324k buffers Swap: 0k total, 0k used, 0k free, 3534360k cached PID USER PR NI VIRT RES SHR S %CPU %MEM TIME+ COMMAND 2973 zoggy 20 0 22208 9188 7480 S 0 0.2 2:30.72 smbd 3603 root 20 0 21184 8232 6908 S 0 0.2 1:19.86 smbd 2533 root 20 0 16552 3872 3140 S 0 0.1 0:00.38 smbd 15503 root 20 0 21172 3752 2976 S 0 0.1 0:00.15 smbd 2933 root 20 0 4820 3536 940 S 0 0.1 0:00.10 awk 3175 root 20 0 15436 3000 576 S 0 0.1 0:00.00 shfs 3176 root 20 0 15436 3000 576 S 0 0.1 0:52.56 shfs 3177 root 20 0 15436 3000 576 S 0 0.1 0:52.85 shfs 3183 root 20 0 15436 3000 576 S 0 0.1 0:50.27 shfs 5017 root 20 0 15436 3000 576 S 0 0.1 0:46.92 shfs 1253 root 20 0 8196 2924 2240 S 0 0.1 0:09.39 ntpd 2516 root 20 0 10004 2036 1480 S 0 0.1 0:02.75 nmbd 8889 root 20 0 6876 1952 1496 S 0 0.0 0:00.06 in.telnetd Active / Total Objects (% used) : 336508 / 591608 (56.9%) Active / Total Slabs (% used) : 12397 / 12397 (100.0%) Active / Total Caches (% used) : 54 / 99 (54.5%) Active / Total Size (% used) : 56640.92K / 72104.58K (78.6%) Minimum / Average / Maximum Object : 0.01K / 0.12K / 16.12K OBJS ACTIVE USE OBJ SIZE SLABS OBJ/SLAB CACHE SIZE NAME 337552 93578 27% 0.05K 4624 73 18496K buffer_head 40976 38717 94% 0.30K 1576 26 12608K radix_tree_node 20349 20349 100% 0.41K 1071 19 8568K reiser_inode_cache 61408 60724 98% 0.12K 1919 32 7676K dentry 13194 13194 100% 0.44K 733 18 5864K fuse_inode 1488 1488 100% 2.58K 124 12 3968K unraid/md 7875 7875 100% 0.31K 315 25 2520K inode_cache So this is the longest i've seen it last.. the only difference this instance is that I did NOT use -F option. So perhaps -F option is causing it to use more memory than it should/leak? My mover script ran at 0730 which might have helped as well? After 45 hours in: top - 08:17:00 up 5 days, 21:45, 2 users, load average: 0.27, 0.32, 0.35 Tasks: 145 total, 1 running, 144 sleeping, 0 stopped, 0 zombie Cpu(s): 0.0%us, 0.9%sy, 2.3%ni, 96.8%id, 0.0%wa, 0.0%hi, 0.0%si, 0.0%st Mem: 4026904k total, 3085816k used, 941088k free, 182972k buffers Swap: 0k total, 0k used, 0k free, 2678436k cached PID USER PR NI VIRT RES SHR S %CPU %MEM TIME+ COMMAND 2973 zoggy 20 0 22208 9272 7504 S 0 0.2 3:10.45 smbd 3603 root 20 0 21184 8344 7016 S 0 0.2 2:02.43 smbd 2533 root 20 0 16552 3872 3140 S 0 0.1 0:00.44 smbd 15503 root 20 0 21172 3752 2976 S 0 0.1 0:00.26 smbd 2933 root 20 0 4820 3536 940 S 0 0.1 0:00.10 awk 3175 root 20 0 20152 3128 576 S 0 0.1 0:00.00 shfs 3176 root 20 0 20152 3128 576 S 0 0.1 1:04.68 shfs 3177 root 20 0 20152 3128 576 S 0 0.1 1:04.62 shfs 3183 root 20 0 20152 3128 576 S 0 0.1 1:02.17 shfs 5017 root 20 0 20152 3128 576 S 0 0.1 0:58.80 shfs 9873 root 20 0 20152 3128 576 S 0 0.1 0:11.37 shfs 1869 root 20 0 20152 3128 576 S 0 0.1 0:07.75 shfs 1253 root 20 0 8196 2924 2240 S 0 0.1 0:11.01 ntpd 2516 root 20 0 10004 2060 1504 S 0 0.1 0:03.47 nmbd 8889 root 20 0 6876 1952 1496 S 0 0.0 0:00.12 in.telnetd Active / Total Objects (% used) : 651626 / 722360 (90.2%) Active / Total Slabs (% used) : 14941 / 14941 (100.0%) Active / Total Caches (% used) : 54 / 99 (54.5%) Active / Total Size (% used) : 79185.53K / 85171.41K (93.0%) Minimum / Average / Maximum Object : 0.01K / 0.12K / 16.12K OBJS ACTIVE USE OBJ SIZE SLABS OBJ/SLAB CACHE SIZE NAME 426028 375540 88% 0.05K 5836 73 23344K buffer_head 45110 41700 92% 0.30K 1735 26 13880K radix_tree_node 27455 27455 100% 0.41K 1445 19 11560K reiser_inode_cache 74912 72059 96% 0.12K 2341 32 9364K dentry 16452 16452 100% 0.44K 914 18 7312K fuse_inode 1488 1488 100% 2.58K 124 12 3968K unraid/md 7875 7875 100% 0.31K 315 25 2520K inode_cache Can see its getting closer and closer to out of memory....
-
so cache_dirs took up all 4gb? is there a way to limit how much it can use? I tried running it again only on my Movies and it did the same thing.
-
running 5.0.5, only things I have installed are unmenu, vim, smtp, shutdown + status script. I do have a cache drive. I launched cache_dirs with: # cache_dirs -w -i "Movies" -i "TV" -F after a few hours it stopped, looking at the tab the tail end showed: Executed find in 0.015807 seconds, weighted avg=0.015852 seconds, now sleeping 10 seconds Executed find in 0.015729 seconds, weighted avg=0.015835 seconds, now sleeping 10 seconds Executed find in 0.015959 seconds, weighted avg=0.015840 seconds, now sleeping 9 seconds Executed find in 0.019165 seconds, weighted avg=0.016150 seconds, now sleeping 8 seconds Executed find in 0.015761 seconds, weighted avg=0.016119 seconds, now sleeping 9 seconds Executed find in 0.015785 seconds, weighted avg=0.016091 seconds, now sleeping 10 seconds Executed find in 0.015797 seconds, weighted avg=0.016064 seconds, now sleeping 10 seconds Executed find in 0.015786 seconds, weighted avg=0.016047 seconds, now sleeping 10 seconds Executed find in 0.015710 seconds, weighted avg=0.016023 seconds, now sleeping 10 seconds Executed find in 0.015828 seconds, weighted avg=0.016011 seconds, now sleeping 10 seconds Executed find in 0.015751 seconds, weighted avg=0.015991 seconds, now sleeping 10 seconds Executed find in 0.015857 seconds, weighted avg=0.015982 seconds, now sleeping 10 seconds Executed find in 0.015817 seconds, weighted avg=0.015969 seconds, now sleeping 10 seconds Executed find in 0.015824 seconds, weighted avg=0.015957 seconds, now sleeping 10 seconds Executed find in 0.015797 seconds, weighted avg=0.015941 seconds, now sleeping 10 seconds Executed find in 0.015780 seconds, weighted avg=0.015924 seconds, now sleeping 10 seconds Executed find in 0.015825 seconds, weighted avg=0.015912 seconds, now sleeping 10 seconds Executed find in 0.015814 seconds, weighted avg=0.015898 seconds, now sleeping 10 seconds Executed find in 0.015816 seconds, weighted avg=0.015883 seconds, now sleeping 10 seconds Executed find in 0.015808 seconds, weighted avg=0.015868 seconds, now sleeping 10 seconds Executed find in 0.015743 seconds, weighted avg=0.015846 seconds, now sleeping 10 seconds Executed find in 0.015774 seconds, weighted avg=0.015828 seconds, now sleeping 10 seconds Executed find in 0.015788 seconds, weighted avg=0.015811 seconds, now sleeping 10 seconds ./cache_dirs: xrealloc: subst.c:658: cannot allocate 256 bytes (901120 bytes allocated) Executed find in seconds, now sleeping 10 seconds ./cache_dirs: xrealloc: subst.c:658: cannot allocate 256 bytes (901120 bytes allocated) Executed find in seconds, now sleeping 10 seconds ./cache_dirs: xmalloc: subst.c:7606: cannot allocate 112 bytes (901120 bytes allocated) ./cache_dirs: xmalloc: subst.c:7606: cannot allocate 112 bytes (901120 bytes allocated) ./cache_dirs: xrealloc: subst.c:658: cannot allocate 256 bytes (901120 bytes allocated) Executed find in seconds, now sleeping 10 seconds ./cache_dirs: xmalloc: subst.c:7606: cannot allocate 112 bytes (901120 bytes allocated) ./cache_dirs: xmalloc: subst.c:7606: cannot allocate 112 bytes (901120 bytes allocated) ./cache_dirs: xmalloc: subst.c:7606: cannot allocate 112 bytes (901120 bytes allocated) ./cache_dirs: xmalloc: subst.c:7606: cannot allocate 112 bytes (901120 bytes allocated) ./cache_dirs: xmalloc: subst.c:7606: cannot allocate 112 bytes (901120 bytes allocated) ./cache_dirs: xmalloc: subst.c:7606: cannot allocate 112 bytes (901120 bytes allocated) ./cache_dirs: xmalloc: subst.c:7606: cannot allocate 112 bytes (901120 bytes allocated) ./cache_dirs: xmalloc: subst.c:7606: cannot allocate 112 bytes (901120 bytes allocated) ./cache_dirs: xmalloc: subst.c:7606: cannot allocate 112 bytes (901120 bytes allocated) ./cache_dirs: xmalloc: subst.c:7606: cannot allocate 112 bytes (901120 bytes allocated) ./cache_dirs: xmalloc: subst.c:7606: cannot allocate 112 bytes (901120 bytes allocated) ./cache_dirs: xmalloc: subst.c:7606: cannot allocate 112 bytes (901120 bytes allocated) ./cache_dirs: xmalloc: subst.c:7606: cannot allocate 112 bytes (901120 bytes allocated) ./cache_dirs: xmalloc: subst.c:7606: cannot allocate 112 bytes (901120 bytes allocated) ./cache_dirs: xmalloc: subst.c:7606: cannot allocate 112 bytes (901120 bytes allocated) ./cache_dirs: xmalloc: subst.c:7606: cannot allocate 112 bytes (901120 bytes allocated) ./cache_dirs: xmalloc: execute_cmd.c:3599: cannot allocate 72 bytes (901120 bytes allocated) ./cache_dirs: line 462: [: : integer expression expected ./cache_dirs: xmalloc: stringlib.c:135: cannot allocate 120 bytes (901120 bytes allocated) during the cache_dirs process (before it stopped) here is what top showed: ~# top top - 16:40:32 up 3 days, 21:29, 2 users, load average: 0.63, 0.46, 0.28 Tasks: 132 total, 1 running, 131 sleeping, 0 stopped, 0 zombie Cpu(s): 1.6%us, 0.7%sy, 0.0%ni, 97.8%id, 0.0%wa, 0.0%hi, 0.0%si, 0.0%st Mem: 4026904k total, 3897424k used, 129480k free, 246844k buffers Swap: 0k total, 0k used, 0k free, 3441640k cached PID USER PR NI VIRT RES SHR S %CPU %MEM TIME+ COMMAND 626 root 20 0 0 0 0 S 0 0.0 1:00.04 kworker/3:1 18212 root 20 0 4208 920 564 S 0 0.0 0:00.30 cache_dirs 18260 root 20 0 4408 1084 528 S 0 0.0 0:03.47 cache_dirs 1 root 20 0 828 304 264 S 0 0.0 0:06.41 init 2 root 20 0 0 0 0 S 0 0.0 0:00.00 kthreadd 3 root 20 0 0 0 0 S 0 0.0 0:01.57 ksoftirqd/0 5 root 0 -20 0 0 0 S 0 0.0 0:00.00 kworker/0:0H 7 root 0 -20 0 0 0 S 0 0.0 0:00.00 kworker/u:0H 8 root RT 0 0 0 0 S 0 0.0 0:00.19 migration/0 9 root 20 0 0 0 0 S 0 0.0 0:00.00 rcu_bh 10 root 20 0 0 0 0 S 0 0.0 0:04.60 rcu_sched now since it stopped, ~# top top - 19:50:19 up 4 days, 39 min, 2 users, load average: 0.00, 0.01, 0.05 Tasks: 109 total, 1 running, 108 sleeping, 0 stopped, 0 zombie Cpu(s): 0.2%us, 0.0%sy, 0.0%ni, 99.8%id, 0.0%wa, 0.0%hi, 0.0%si, 0.0%st Mem: 4026904k total, 3888912k used, 137992k free, 243876k buffers Swap: 0k total, 0k used, 0k free, 3435500k cached PID USER PR NI VIRT RES SHR S %CPU %MEM TIME+ COMMAND 3970 root 20 0 2464 1000 756 R 0 0.0 0:00.01 top 1 root 20 0 828 304 264 S 0 0.0 0:06.46 init 2 root 20 0 0 0 0 S 0 0.0 0:00.00 kthreadd 3 root 20 0 0 0 0 S 0 0.0 0:02.60 ksoftirqd/0 5 root 0 -20 0 0 0 S 0 0.0 0:00.00 kworker/0:0H 7 root 0 -20 0 0 0 S 0 0.0 0:00.00 kworker/u:0H 8 root RT 0 0 0 0 S 0 0.0 0:00.23 migration/0 9 root 20 0 0 0 0 S 0 0.0 0:00.00 rcu_bh 10 root 20 0 0 0 0 S 0 0.0 0:05.11 rcu_sched # free -l total used free shared buffers cached Mem: 4026904 3888628 138276 0 243876 3435500 Low: 867104 740020 127084 High: 3159800 3148608 11192 -/+ buffers/cache: 209252 3817652 Swap: 0 0 0 are my folders to large for the cache_dirs? folder size: :/mnt/user/TV# du -h --max-depth=1 2.9T ./TV 79G ./TV-Misc 65G ./TV-Food & Travel 311G ./TV-Canceled 9.4G ./TV-Mini Series 52G ./TV-Docu 21G ./TV-Anime 48G ./TV-Asian 3.4T . :/mnt/user/Movies# du -h --max-depth=1 936G ./Movies-SD 44G ./Movies-Asian 68G ./Movies-Ghibli 9.4G ./Movies-Stand-Up 1.1T ./Movies-HD 2.1T . number of unique files: :/mnt/user/TV# du -a | cut -d/ -f2 | sort | uniq -c | sort -nr 8232 TV 1902 TV-Canceled 258 TV-Anime 254 TV-Misc 177 TV-Asian 148 TV-Food & Travel 73 TV-Docu 58 TV-Mini Series :/mnt/user/Movies# du -a | cut -d/ -f2 | sort | uniq -c | sort -nr 6101 Movies-SD 899 Movies-HD 179 Movies-Asian 60 Movies-Ghibli 41 Movies-Stand-Up # ulimit -a core file size (blocks, -c) unlimited data seg size (kbytes, -d) unlimited scheduling priority (-e) 0 file size (blocks, -f) unlimited pending signals (-i) 31201 max locked memory (kbytes, -l) unlimited max memory size (kbytes, -m) unlimited open files (-n) 40960 pipe size (512 bytes, -p) 8 POSIX message queues (bytes, -q) 819200 real-time priority (-r) 0 stack size (kbytes, -s) unlimited cpu time (seconds, -t) unlimited max user processes (-u) 31201 virtual memory (kbytes, -v) unlimited file locks (-x) unlimited # slabtop -s c Active / Total Objects (% used) : 757906 / 861036 (88.0%) Active / Total Slabs (% used) : 19478 / 19478 (100.0%) Active / Total Caches (% used) : 54 / 99 (54.5%) Active / Total Size (% used) : 103664.34K / 113958.34K (91.0%) Minimum / Average / Maximum Object : 0.01K / 0.13K / 16.12K OBJS ACTIVE USE OBJ SIZE SLABS OBJ/SLAB CACHE SIZE NAME 419896 355813 84% 0.05K 5752 73 23008K buffer_head 47063 47063 100% 0.41K 2477 19 19816K reiser_inode_cache 58136 47590 81% 0.30K 2236 26 17888K radix_tree_node 37710 37046 98% 0.44K 2095 18 16760K fuse_inode 121728 109541 89% 0.12K 3804 32 15216K dentry 1488 1488 100% 2.58K 124 12 3968K unraid/md 57216 55937 97% 0.06K 894 64 3576K kmalloc-64 7900 7900 100% 0.31K 316 25 2528K inode_cache
-
came back from the holidays and found my log was quite full with the same message.. turned out that something fell and landed on the keyboard that was attached... the joys of not having email notices or any logic to say.. hey that line thats repeating a zillion times in the log.. maybe we should notify the user that something is up. Dec 14 07:31:41 husky logger: mover finished Dec 14 07:33:34 husky agetty[27087]: tty1: input overrun Dec 14 07:39:13 husky agetty[27169]: tty1: input overrun Dec 14 07:44:51 husky agetty[27170]: tty1: input overrun Dec 14 07:50:30 husky agetty[27172]: tty1: input overrun Dec 14 07:56:09 husky agetty[27351]: tty1: input overrun ... Dec 17 01:41:46 husky agetty[5261]: tty1: input overrun Dec 17 01:47:25 husky agetty[5262]: tty1: input overrun Dec 17 01:53:04 husky agetty[5396]: tty1: input overrun Dec 17 01:58:42 husky agetty[5397]: tty1: input overrun Dec 17 02:04:21 husky agetty[5398]: tty1: input overrun Dec 17 02:10:00 husky agetty[5400]: tty1: input overrun Dec 17 02:15:39 husky agetty[5401]: tty1: input overrun Dec 17 02:21:17 husky agetty[5402]: tty1: input overrun Dec 17 02:26:56 husky agetty[5403]: tty1: input overrun Dec 17 02:32:35 husky agetty[5404]: tty1: input overrun Dec 17 02:38:13 husky agetty[5405]: tty1: input overrun ... Dec 20 16:43:06 husky agetty[18333]: tty1: input overrun Dec 20 16:48:45 husky agetty[18354]: tty1: input overrun Dec 20 16:54:23 husky agetty[18473]: tty1: input overrun Dec 20 17:00:02 husky agetty[18475]: tty1: input overrun Dec 20 17:05:41 husky agetty[18476]: tty1: input overrun Dec 20 17:11:19 husky agetty[18477]: tty1: input overrun Dec 20 17:16:58 husky agetty[18478]: tty1: input overrun Dec 20 17:22:37 husky agetty[18479]: tty1: input overrun Dec 20 17:28:15 husky agetty[18481]: tty1: input overrun Dec 20 17:30:59 husky shfs/user: cache disk full Dec 20 17:33:54 husky agetty[18482]: tty1: input overrun Dec 20 17:39:33 husky agetty[18486]: tty1: input overrun Dec 20 17:45:11 husky agetty[18487]: tty1: input overrun Dec 20 17:50:50 husky agetty[18488]: tty1: input overrun Dec 20 17:56:29 husky agetty[18608]: tty1: input overrun Dec 20 18:02:08 husky agetty[18609]: tty1: input overrun Dec 20 18:07:46 husky agetty[18611]: tty1: input overrun Dec 20 18:13:25 husky agetty[18612]: tty1: input overrun Dec 20 18:19:04 husky agetty[18614]: tty1: input overrun Dec 20 18:24:42 husky agetty[18616]: tty1: input overrun Dec 20 18:30:21 husky agetty[18617]: tty1: input overrun Dec 20 18:36:00 husky agetty[18619]: tty1: input overrun Dec 20 18:41:38 husky agetty[18620]: tty1: input overrun Dec 20 18:47:17 husky agetty[18622]: tty1: input overrun Dec 20 18:52:56 husky agetty[18741]: tty1: input overrun Dec 20 18:58:34 husky agetty[18743]: tty1: input overrun Dec 20 19:03:00 husky shfs/user: cache disk full ... Dec 31 23:22:50 husky agetty[27410]: tty1: input overrun Dec 31 23:28:29 husky agetty[27412]: tty1: input overrun Dec 31 23:34:07 husky agetty[27413]: tty1: input overrun Dec 31 23:39:46 husky agetty[27415]: tty1: input overrun Dec 31 23:45:25 husky agetty[27416]: tty1: input overrun Dec 31 23:51:03 husky agetty[27417]: tty1: input overrun Dec 31 23:56:42 husky agetty[27566]: tty1: input overrun Jan 1 00:02:21 husky agetty[27567]: tty1: input overrun Jan 1 00:07:59 husky agetty[27569]: tty1: input overrun Jan 1 00:13:38 husky agetty[27570]: tty1: input overrun Jan 1 00:19:17 husky agetty[27572]: tty1: input overrun
-
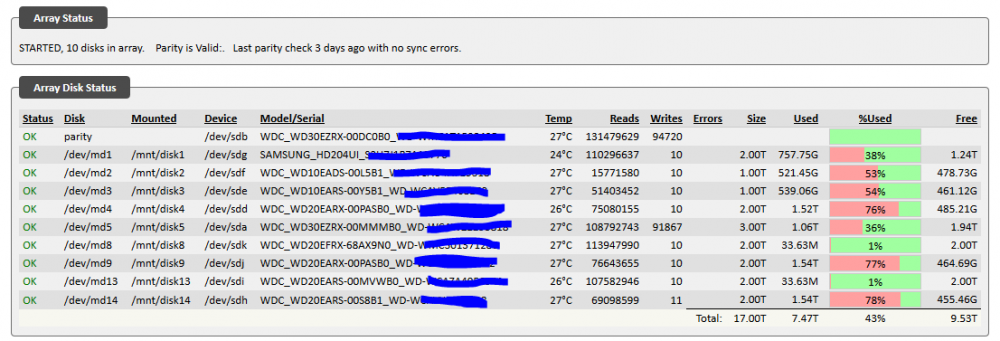
mixture of green and red drives and ssd for cache. here is what I'm currently idling with:
-
Thats a bit odd.. I've had excellent results with the NF-R8 with the LNA which only spinning at 1300 RPM instead of stock 1800. Granted I only have 11 out of the 15 drives populated...
-
Well what adapter/speed are you using the NF-R8 with? Personally I find the LNA working well for me, gets a little warm during parity (40-42) but I can deal with that once a month. Ultra-Low-Noise Adaptor (U.L.N.A.) Low-Noise Adaptor (L.N.A.) Rotational Speed (+/- 10%) 1800 RPM Rotational Speed with L.N.A. (+/- 10%) 1300 RPM Rotational Speed with U.L.N.A. (+/- 10%) 800 RPM Airflow 53 m³/h Airflow with L.N.A. 39 m³/h Airflow with U.L.N.A. 26 m³/h
-
really you should have a branch for whatever code you wanna do.. i'm assuming your going to have a webgui for 5.x and one for 6.x ? you can do this two different ways, 1 repo for each trunk code, so webgui-5 and then webgui-6, keeps them separate but does require double the work.. but if your not really going to be making changes to the gui for 5.x as most efforts i would assume would be directed towards 6.x.. then this may be overkill. you could just have 1 repo as you currently do, and just have the 'master' branch would be the latest 5.x code... you just make a new branch based off 'master' where you can go modify it to your heats content for 6.x. then when your ready you push down master. the key is that you never push to master directly since other branches are based offf it.. you push to 5.x or 6.x then pull down into master from them. if you want to maintain two separate forks of code.. like 5.x in case you want to push out updates later for that.. you just keep that in its own branch. kinda like what we do for sabnzbd https://github.com/sabnzbd/sabnzbd/branches 'master' is the latest code for the current trunk.. 0.7.x. develop has 0.8.x. when we need to make a new update to 0.7.x we put the new code there then push down to master. this keeps 'master' more like a stable branch.. allows us to test code and keep the code diversions to a minimum. http://nvie.com/posts/a-successful-git-branching-model/
-
could just buy a 2x2tb or a 3tb drive and get rid of most of those drives and reduce the heat+power... but anyways which Noctua you going to try now? The NF-R8?
-
hehe.. just for giggles i ran that command on /mnt/user/ 161915 Music 96022 Personal 10391 TV 7107 Movies 2017 Media
-
personally i've given up interest on this.. besides the lack of apparent support on github (only one gatekeeper) its just too cumbersome to test/dev with this current method/setup.
-
Correct, I don't compare pass 2 results to pass 1, since they run for different lengths of time. Pass 2 results are expected to be slightly lower, as the test extends farther into the parity check, which gradually slows from beginning to end. It is expected that pass 1 gets you into the right range, and pass 2 finds the best value in that range. If I compared pass 2 to pass 1, the majority of the time the logic would probably pick the pass 1 result since it would probably have the faster time due to the shorter test length. Unfortunately some servers are not testing well (he's not slow, he just doesn't test well...). It's not so much about comparing pass 1 to pass 2, rather it's more about servers producing inconsistent results, which no amount of logic can power through. Myself, I'm looking at RockDawg's results and have no freaking idea which values are good values... My point exactly, inconsistent results. Test 36 should have been pretty close, but slightly below test 1. Actually, if you look at the bigger picture (and RockDawg's server is not the first to show this behavior), the 1st test started off at a nice speed, and each subsequent test gets slower, until a lower threshold is reached, and then all results hover around that lower threshold. I would hazard a guess that these md_* values are not actually affecting anything on RockDawg's server - he could run a 512 byte test 10 times in a row, and each subsequent test would be a little bit slower. I think VM is highly suspect. zoggy had nearly identical behavior in his test results: Tunables Report from unRAID Tunables Tester v2.0 by Pauven Test | num_stripes | write_limit | sync_window | Speed --- FULLY AUTOMATIC TEST PASS 1 (Rough - 20 Sample Points @ 3min Duration)--- 1 | 1408 | 768 | 512 | 88.0 MB/s 2 | 1536 | 768 | 640 | 87.8 MB/s 3 | 1664 | 768 | 768 | 87.4 MB/s 4 | 1920 | 896 | 896 | 87.0 MB/s 5 | 2176 | 1024 | 1024 | 87.2 MB/s 6 | 2560 | 1152 | 1152 | 86.8 MB/s 7 | 2816 | 1280 | 1280 | 86.6 MB/s 8 | 3072 | 1408 | 1408 | 86.2 MB/s 9 | 3328 | 1536 | 1536 | 86.0 MB/s 10 | 3584 | 1664 | 1664 | 85.7 MB/s 11 | 3968 | 1792 | 1792 | 85.7 MB/s 12 | 4224 | 1920 | 1920 | 86.1 MB/s 13 | 4480 | 2048 | 2048 | 86.2 MB/s 14 | 4736 | 2176 | 2176 | 85.7 MB/s 15 | 5120 | 2304 | 2304 | 85.3 MB/s 16 | 5376 | 2432 | 2432 | 85.3 MB/s 17 | 5632 | 2560 | 2560 | 85.1 MB/s 18 | 5888 | 2688 | 2688 | 85.1 MB/s 19 | 6144 | 2816 | 2816 | 84.8 MB/s 20 | 6528 | 2944 | 2944 | 84.8 MB/s --- Targeting Fastest Result of md_sync_window 512 bytes for Medium Pass --- --- FULLY AUTOMATIC TEST PASS 2 (Final - 16 Sample Points @ 4min Duration)--- 21 | 1288 | 768 | 392 | 84.9 MB/s 22 | 1296 | 768 | 400 | 84.8 MB/s 23 | 1304 | 768 | 408 | 84.7 MB/s 24 | 1312 | 768 | 416 | 84.7 MB/s 25 | 1320 | 768 | 424 | 84.4 MB/s 26 | 1328 | 768 | 432 | 84.7 MB/s 27 | 1336 | 768 | 440 | 84.7 MB/s 28 | 1344 | 768 | 448 | 84.4 MB/s 29 | 1360 | 768 | 456 | 84.6 MB/s 30 | 1368 | 768 | 464 | 84.7 MB/s 31 | 1376 | 768 | 472 | 84.3 MB/s 32 | 1384 | 768 | 480 | 84.5 MB/s 33 | 1392 | 768 | 488 | 84.7 MB/s 34 | 1400 | 768 | 496 | 84.6 MB/s 35 | 1408 | 768 | 504 | 84.5 MB/s 36 | 1416 | 768 | 512 | 84.7 MB/s Notice that the 512 byte test is both the fastest and one of the slowest! I talked to zoggy the other day about his build, and I don't think he mentioned VM, but I didn't think to ask either. -Paul nope, no vm here.
-
most people run a weekly or monthly parity check. anything that cuts this down from the multi-hour event is a welcomed thing... assuming it doesnt greatly affect day-to-day performance. speaking of, i would assume the md_ variables dont really affect the cache drive. thus you could always recommend tuning for parity then rely on cache drive for day-to-day?

