





Capt.Insano
Community Developer
-
Joined
-
Last visited
Everything posted by Capt.Insano
-
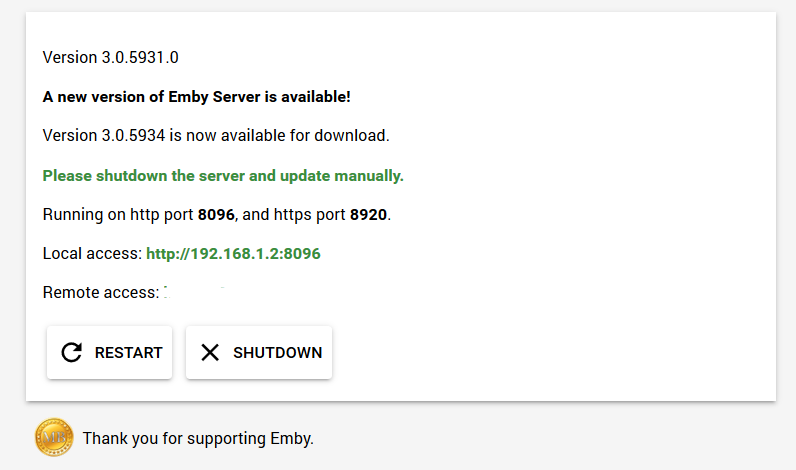
@hurricanehrndz sidenote: Any chance of an update to the docker container to bring the server up to date? See attachment below. Thanks a million
-
You have one item under docker images as follows: <none> <none> dacd34ba0e5a 5 months ago 503.4 MB Try the following command to remove the orphaned image: docker rmi dacd34ba0e5a Then try again. Great work on this container linuxserver.io team!!
-
Any chance of triggering an updated container build? Thanks as always hurricane!! Capt.Insano, please read the immediate post above yours. Thanks BRiT, I have edited my post. I misunderstood what was said before my last post!
-
My Emby Server Dashboard reports: Any chance of triggering an updated container build? Thanks as always hurricane!! Edit: Sorry, misunderstood above posts!! Question removed! Thanks!
-
This works nicely, thank you. But is there an easy way to make it permanent so that it survives a reboot? Not an easy way, to be honest I have moved to an Observium VM using this: https://www.turnkeylinux.org/observium No probs since.
-
I re-ran all three commands in succession: sensors: root@Tower:/tmp# sensors coretemp-isa-0000 Adapter: ISA adapter CPU 1 Core 1: +25.0°C (high = +61.0°C, crit = +71.0°C) CPU 1 Core 2: +24.0°C (high = +61.0°C, crit = +71.0°C) CPU 1 Core 3: +21.0°C (high = +61.0°C, crit = +71.0°C) CPU 1 Core 4: +25.0°C (high = +61.0°C, crit = +71.0°C) coretemp-isa-0001 Adapter: ISA adapter CPU 2 Core 1: +28.0°C (high = +61.0°C, crit = +71.0°C) CPU 2 Core 2: +24.0°C (high = +61.0°C, crit = +71.0°C) CPU 2 Core 3: +28.0°C (high = +61.0°C, crit = +71.0°C) CPU 2 Core 4: +24.0°C (high = +61.0°C, crit = +71.0°C) /usr/sbin/ipmi-sensors --output-sensor-thresholds --comma-separated-output --output-sensor-state --ignore-not-available-sensors --non-abbreviated-units: root@Tower:/tmp# /usr/sbin/ipmi-sensors --output-sensor-thresholds --comma-separated-output --output-sensor-state --ignore-not-available-sensors --non-abbreviated-units ID,Name,Type,State,Reading,Units,Lower NR,Lower C,Lower NC,Upper NC,Upper C,Upper NR,Event 1,BB +1.1V IOH,Voltage,Nominal,1.08,Volts,N/A,1.03,1.05,1.15,1.18,N/A,'OK' 2,BB +1.1V P1 Vccp,Voltage,Nominal,0.93,Volts,N/A,0.68,0.71,1.50,1.54,N/A,'OK' 4,BB +1.8V AUX,Voltage,Nominal,1.78,Volts,N/A,1.67,1.72,1.87,1.93,N/A,'OK' 5,BB +3.3V,Voltage,Nominal,3.30,Volts,N/A,2.98,3.07,3.53,3.63,N/A,'OK' 6,BB +3.3V STBY,Voltage,Nominal,3.24,Volts,N/A,2.98,3.07,3.53,3.63,N/A,'OK' 7,BB +3.3V Vbat,Voltage,Nominal,3.00,Volts,N/A,2.18,2.50,3.19,3.28,N/A,'OK' 8,BB +5.0V,Voltage,Nominal,4.99,Volts,N/A,4.47,4.63,5.38,5.54,N/A,'OK' 9,BB +5.0V STBY,Voltage,Nominal,4.97,Volts,N/A,4.42,4.57,5.27,5.42,N/A,'OK' 10,BB +12.0V,Voltage,Nominal,12.25,Volts,N/A,10.74,11.10,12.92,13.29,N/A,'OK' 11,BB +1.35v P1 MEM,Voltage,Nominal,1.38,Volts,N/A,1.24,1.27,1.44,1.48,N/A,'OK' 12,Baseboard Temp,Temperature,Nominal,28.00,degrees C,N/A,5.00,10.00,61.00,66.00,N/A,'OK' 13,IOH Therm Margin,Temperature,Nominal,-37.00,degrees C,N/A,N/A,N/A,5.00,10.00,N/A,'OK' 14,Mem P1 Thrm Mrgn,Temperature,Nominal,-43.00,degrees C,N/A,N/A,N/A,5.00,10.00,N/A,'OK' 15,Processor 1 Fan,Fan,Nominal,3200.00,RPM,N/A,640.00,768.00,N/A,N/A,N/A,'OK' 16,Processor 1A Fan,Fan,Critical,640.00,RPM,N/A,640.00,768.00,N/A,N/A,N/A,'At or Below (<=) Lower Critical Threshold' 17,Processor 2 Fan,Fan,Nominal,3136.00,RPM,N/A,640.00,768.00,N/A,N/A,N/A,'OK' 18,P1 Therm Margin,Temperature,Nominal,-45.00,degrees C,N/A,N/A,N/A,N/A,N/A,N/A,'OK' 19,P1 Therm Ctrl %,Temperature,Nominal,0.00,%,N/A,N/A,N/A,11.70,19.50,N/A,'OK' 20,Pwr Unit Status,Power Unit,Nominal,N/A,N/A,N/A,N/A,N/A,N/A,N/A,N/A,'OK' 21,IPMI Watchdog,Watchdog 2,Nominal,N/A,N/A,N/A,N/A,N/A,N/A,N/A,N/A,'OK' 22,Physical Scrty,Physical Security,Nominal,N/A,N/A,N/A,N/A,N/A,N/A,N/A,N/A,'OK' 23,FP NMI Diag Int,Critical Interrupt,Nominal,N/A,N/A,N/A,N/A,N/A,N/A,N/A,N/A,'OK' 24,SMI Timeout,OEM Reserved,N/A,N/A,N/A,N/A,N/A,N/A,N/A,N/A,N/A,'OK' 25,System Event Log,Event Logging Disabled,Nominal,N/A,N/A,N/A,N/A,N/A,N/A,N/A,N/A,'OK' 26,System Event,System Event,Nominal,N/A,N/A,N/A,N/A,N/A,N/A,N/A,N/A,'OK' 27,P1 Status,Processor,Nominal,N/A,N/A,N/A,N/A,N/A,N/A,N/A,N/A,'Processor Presence detected' 28,P1 VRD Hot,Temperature,Nominal,N/A,N/A,N/A,N/A,N/A,N/A,N/A,N/A,'OK' 29,CATERR,Processor,Nominal,N/A,N/A,N/A,N/A,N/A,N/A,N/A,N/A,'OK' 30,CPU Missing,Processor,Nominal,N/A,N/A,N/A,N/A,N/A,N/A,N/A,N/A,'OK' 31,IOH Therm Trip,Temperature,Nominal,N/A,N/A,N/A,N/A,N/A,N/A,N/A,N/A,'OK' ipmi-sensors: root@Tower:/tmp# ipmi-sensors ID | Name | Type | Reading | Units | Event 1 | BB +1.1V IOH | Voltage | 1.08 | V | 'OK' 2 | BB +1.1V P1 Vccp | Voltage | 0.89 | V | 'OK' 3 | BB +1.5V P1 DDR3 | Voltage | N/A | V | N/A 4 | BB +1.8V AUX | Voltage | 1.78 | V | 'OK' 5 | BB +3.3V | Voltage | 3.30 | V | 'OK' 6 | BB +3.3V STBY | Voltage | 3.24 | V | 'OK' 7 | BB +3.3V Vbat | Voltage | 3.00 | V | 'OK' 8 | BB +5.0V | Voltage | 4.99 | V | 'OK' 9 | BB +5.0V STBY | Voltage | 4.97 | V | 'OK' 10 | BB +12.0V | Voltage | 12.25 | V | 'OK' 11 | BB +1.35v P1 MEM | Voltage | 1.37 | V | 'OK' 12 | Baseboard Temp | Temperature | 28.00 | C | 'OK' 13 | IOH Therm Margin | Temperature | -36.00 | C | 'OK' 14 | Mem P1 Thrm Mrgn | Temperature | -43.00 | C | 'OK' 15 | Processor 1 Fan | Fan | 3136.00 | RPM | 'OK' 16 | Processor 1A Fan | Fan | 640.00 | RPM | 'At or Below (<=) Lower Critical Threshold' 17 | Processor 2 Fan | Fan | 3136.00 | RPM | 'OK' 18 | P1 Therm Margin | Temperature | -45.00 | C | 'OK' 19 | P1 Therm Ctrl % | Temperature | 0.00 | % | 'OK' 20 | Pwr Unit Status | Power Unit | N/A | N/A | 'OK' 21 | IPMI Watchdog | Watchdog 2 | N/A | N/A | 'OK' 22 | Physical Scrty | Physical Security | N/A | N/A | 'OK' 23 | FP NMI Diag Int | Critical Interrupt | N/A | N/A | 'OK' 24 | SMI Timeout | OEM Reserved | N/A | N/A | 'OK' 25 | System Event Log | Event Logging Disabled | N/A | N/A | 'OK' 26 | System Event | System Event | N/A | N/A | 'OK' 27 | P1 Status | Processor | N/A | N/A | 'Processor Presence detected' 28 | P1 VRD Hot | Temperature | N/A | N/A | 'OK' 29 | CATERR | Processor | N/A | N/A | 'OK' 30 | CPU Missing | Processor | N/A | N/A | 'OK' 31 | IOH Therm Trip | Temperature | N/A | N/A | 'OK' 32 | NM Capabilities | OEM Reserved | N/A | N/A | N/A Neither CPU temps are showing up as approx 44C or 35C as previosly expected?
-
Output: root@Tower:/tmp# /usr/sbin/ipmi-sensors --output-sensor-thresholds --comma-separated-output --output-sensor-state --ignore-not-available-sensors --non-abbreviated-units ID,Name,Type,State,Reading,Units,Lower NR,Lower C,Lower NC,Upper NC,Upper C,Upper NR,Event 1,BB +1.1V IOH,Voltage,Nominal,1.08,Volts,N/A,1.03,1.05,1.15,1.18,N/A,'OK' 2,BB +1.1V P1 Vccp,Voltage,Nominal,0.87,Volts,N/A,0.68,0.71,1.50,1.54,N/A,'OK' 4,BB +1.8V AUX,Voltage,Nominal,1.78,Volts,N/A,1.67,1.72,1.87,1.93,N/A,'OK' 5,BB +3.3V,Voltage,Nominal,3.30,Volts,N/A,2.98,3.07,3.53,3.63,N/A,'OK' 6,BB +3.3V STBY,Voltage,Nominal,3.24,Volts,N/A,2.98,3.07,3.53,3.63,N/A,'OK' 7,BB +3.3V Vbat,Voltage,Nominal,3.00,Volts,N/A,2.18,2.50,3.19,3.28,N/A,'OK' 8,BB +5.0V,Voltage,Nominal,4.99,Volts,N/A,4.47,4.63,5.38,5.54,N/A,'OK' 9,BB +5.0V STBY,Voltage,Nominal,4.97,Volts,N/A,4.42,4.57,5.27,5.42,N/A,'OK' 10,BB +12.0V,Voltage,Nominal,12.25,Volts,N/A,10.74,11.10,12.92,13.29,N/A,'OK' 11,BB +1.35v P1 MEM,Voltage,Nominal,1.37,Volts,N/A,1.24,1.27,1.44,1.48,N/A,'OK' 12,Baseboard Temp,Temperature,Nominal,28.00,degrees C,N/A,5.00,10.00,61.00,66.00,N/A,'OK' 13,IOH Therm Margin,Temperature,Nominal,-36.00,degrees C,N/A,N/A,N/A,5.00,10.00,N/A,'OK' 14,Mem P1 Thrm Mrgn,Temperature,Nominal,-43.00,degrees C,N/A,N/A,N/A,5.00,10.00,N/A,'OK' 15,Processor 1 Fan,Fan,Nominal,3200.00,RPM,N/A,640.00,768.00,N/A,N/A,N/A,'OK' 16,Processor 1A Fan,Fan,Critical,640.00,RPM,N/A,640.00,768.00,N/A,N/A,N/A,'At or Below (<=) Lower Critical Threshold' 17,Processor 2 Fan,Fan,Nominal,3200.00,RPM,N/A,640.00,768.00,N/A,N/A,N/A,'OK' 18,P1 Therm Margin,Temperature,Nominal,-45.00,degrees C,N/A,N/A,N/A,N/A,N/A,N/A,'OK' 19,P1 Therm Ctrl %,Temperature,Nominal,0.00,%,N/A,N/A,N/A,11.70,19.50,N/A,'OK' 20,Pwr Unit Status,Power Unit,Nominal,N/A,N/A,N/A,N/A,N/A,N/A,N/A,N/A,'OK' 21,IPMI Watchdog,Watchdog 2,Nominal,N/A,N/A,N/A,N/A,N/A,N/A,N/A,N/A,'OK' 22,Physical Scrty,Physical Security,Nominal,N/A,N/A,N/A,N/A,N/A,N/A,N/A,N/A,'OK' 23,FP NMI Diag Int,Critical Interrupt,Nominal,N/A,N/A,N/A,N/A,N/A,N/A,N/A,N/A,'OK' 24,SMI Timeout,OEM Reserved,N/A,N/A,N/A,N/A,N/A,N/A,N/A,N/A,N/A,'OK' 25,System Event Log,Event Logging Disabled,Nominal,N/A,N/A,N/A,N/A,N/A,N/A,N/A,N/A,'OK' 26,System Event,System Event,Nominal,N/A,N/A,N/A,N/A,N/A,N/A,N/A,N/A,'OK' 27,P1 Status,Processor,Nominal,N/A,N/A,N/A,N/A,N/A,N/A,N/A,N/A,'Processor Presence detected' 28,P1 VRD Hot,Temperature,Nominal,N/A,N/A,N/A,N/A,N/A,N/A,N/A,N/A,'OK' 29,CATERR,Processor,Nominal,N/A,N/A,N/A,N/A,N/A,N/A,N/A,N/A,'OK' 30,CPU Missing,Processor,Nominal,N/A,N/A,N/A,N/A,N/A,N/A,N/A,N/A,'OK' 31,IOH Therm Trip,Temperature,Nominal,N/A,N/A,N/A,N/A,N/A,N/A,N/A,N/A,'OK' root@Tower:/tmp#
-
I ran ipmi-sensors and sensors one after the other and got the following: root@Tower:/tmp# ipmi-sensors Caching SDR repository information: /root/.freeipmi/sdr-cache/sdr-cache-Tower.localhost Caching SDR record 146 of 146 (current record ID 146) ID | Name | Type | Reading | Units | Event 1 | BB +1.1V IOH | Voltage | 1.08 | V | 'OK' 2 | BB +1.1V P1 Vccp | Voltage | 0.93 | V | 'OK' 3 | BB +1.5V P1 DDR3 | Voltage | N/A | V | N/A 4 | BB +1.8V AUX | Voltage | 1.78 | V | 'OK' 5 | BB +3.3V | Voltage | 3.30 | V | 'OK' 6 | BB +3.3V STBY | Voltage | 3.24 | V | 'OK' 7 | BB +3.3V Vbat | Voltage | 2.98 | V | 'OK' 8 | BB +5.0V | Voltage | 4.99 | V | 'OK' 9 | BB +5.0V STBY | Voltage | 4.97 | V | 'OK' 10 | BB +12.0V | Voltage | 12.25 | V | 'OK' 11 | BB +1.35v P1 MEM | Voltage | 1.37 | V | 'OK' 12 | Baseboard Temp | Temperature | 28.00 | C | 'OK' 13 | IOH Therm Margin | Temperature | -33.00 | C | 'OK' 14 | Mem P1 Thrm Mrgn | Temperature | -42.00 | C | 'OK' 15 | Processor 1 Fan | Fan | 3200.00 | RPM | 'OK' 16 | Processor 1A Fan | Fan | 640.00 | RPM | 'At or Below (<=) Lower Critical Threshold' 17 | Processor 2 Fan | Fan | 3200.00 | RPM | 'OK' 18 | P1 Therm Margin | Temperature | -44.00 | C | 'OK' 19 | P1 Therm Ctrl % | Temperature | 0.00 | % | 'OK' 20 | Pwr Unit Status | Power Unit | N/A | N/A | 'OK' 21 | IPMI Watchdog | Watchdog 2 | N/A | N/A | 'OK' 22 | Physical Scrty | Physical Security | N/A | N/A | 'OK' 23 | FP NMI Diag Int | Critical Interrupt | N/A | N/A | 'OK' 24 | SMI Timeout | OEM Reserved | N/A | N/A | 'OK' 25 | System Event Log | Event Logging Disabled | N/A | N/A | 'OK' 26 | System Event | System Event | N/A | N/A | 'OK' 27 | P1 Status | Processor | N/A | N/A | 'Processor Presence detected' 28 | P1 VRD Hot | Temperature | N/A | N/A | 'OK' 29 | CATERR | Processor | N/A | N/A | 'OK' 30 | CPU Missing | Processor | N/A | N/A | 'OK' 31 | IOH Therm Trip | Temperature | N/A | N/A | 'OK' 32 | NM Capabilities | OEM Reserved | N/A | N/A | N/A root@Tower:/tmp# sensors coretemp-isa-0000 Adapter: ISA adapter CPU 1 Core 1: +26.0°C (high = +61.0°C, crit = +71.0°C) CPU 1 Core 2: +25.0°C (high = +61.0°C, crit = +71.0°C) CPU 1 Core 3: +22.0°C (high = +61.0°C, crit = +71.0°C) CPU 1 Core 4: +26.0°C (high = +61.0°C, crit = +71.0°C) coretemp-isa-0001 Adapter: ISA adapter CPU 2 Core 1: +28.0°C (high = +61.0°C, crit = +71.0°C) CPU 2 Core 2: +24.0°C (high = +61.0°C, crit = +71.0°C) CPU 2 Core 3: +28.0°C (high = +61.0°C, crit = +71.0°C) CPU 2 Core 4: +24.0°C (high = +61.0°C, crit = +71.0°C) I have also looked online for a build of freeipmi v1.5.1 for slackware but I cannot find one anywhere to see if any further info given.
-
I just tried with your build of freeipmi 1.4.11: root@Tower:/tmp# ipmi-sensors ID | Name | Type | Reading | Units | Event 1 | BB +1.1V IOH | Voltage | 1.08 | V | 'OK' 2 | BB +1.1V P1 Vccp | Voltage | 0.87 | V | 'OK' 3 | BB +1.5V P1 DDR3 | Voltage | N/A | V | N/A 4 | BB +1.8V AUX | Voltage | 1.78 | V | 'OK' 5 | BB +3.3V | Voltage | 3.30 | V | 'OK' 6 | BB +3.3V STBY | Voltage | 3.24 | V | 'OK' 7 | BB +3.3V Vbat | Voltage | 2.98 | V | 'OK' 8 | BB +5.0V | Voltage | 4.99 | V | 'OK' 9 | BB +5.0V STBY | Voltage | 4.97 | V | 'OK' 10 | BB +12.0V | Voltage | 12.25 | V | 'OK' 11 | BB +1.35v P1 MEM | Voltage | 1.38 | V | 'OK' 12 | Baseboard Temp | Temperature | 28.00 | C | 'OK' 13 | IOH Therm Margin | Temperature | -33.00 | C | 'OK' 14 | Mem P1 Thrm Mrgn | Temperature | -43.00 | C | 'OK' 15 | Processor 1 Fan | Fan | 3200.00 | RPM | 'OK' 16 | Processor 1A Fan | Fan | 640.00 | RPM | 'At or Below (<=) Lower Critical Threshold' 17 | Processor 2 Fan | Fan | 3136.00 | RPM | 'OK' 18 | P1 Therm Margin | Temperature | -44.00 | C | 'OK' 19 | P1 Therm Ctrl % | Temperature | 0.00 | % | 'OK' 20 | Pwr Unit Status | Power Unit | N/A | N/A | 'OK' 21 | IPMI Watchdog | Watchdog 2 | N/A | N/A | 'OK' 22 | Physical Scrty | Physical Security | N/A | N/A | 'OK' 23 | FP NMI Diag Int | Critical Interrupt | N/A | N/A | 'OK' 24 | SMI Timeout | OEM Reserved | N/A | N/A | 'OK' 25 | System Event Log | Event Logging Disabled | N/A | N/A | 'Log Area Reset/Cleared' 26 | System Event | System Event | N/A | N/A | 'OK' 27 | P1 Status | Processor | N/A | N/A | 'Processor Presence detected' 28 | P1 VRD Hot | Temperature | N/A | N/A | 'OK' 29 | CATERR | Processor | N/A | N/A | 'OK' 30 | CPU Missing | Processor | N/A | N/A | 'OK' 31 | IOH Therm Trip | Temperature | N/A | N/A | 'OK' 32 | NM Capabilities | OEM Reserved | N/A | N/A | N/A No further luck with CPU temps!! Note: nevermind the error with "Processor 1A Fan", that fan header is connected to a fan controller so incorrect speeds are reported!! Thanks for this help so far!
-
root@Tower:~# ipmitool lan print Set in Progress : Set Complete Auth Type Support : MD5 PASSWORD Auth Type Enable : Callback : MD5 PASSWORD : User : MD5 PASSWORD : Operator : MD5 PASSWORD : Admin : MD5 : OEM : IP Address Source : Static Address IP Address : 192.168.1.15 Subnet Mask : 255.255.255.0 MAC Address : 00:15:17:9e:58:f0 SNMP Community String : INTEL IP Header : TTL=0x00 Flags=0x00 Precedence=0x00 TOS=0x00 BMC ARP Control : ARP Responses Enabled, Gratuitous ARP Disabled Gratituous ARP Intrvl : 0.0 seconds Default Gateway IP : 192.168.1.1 Default Gateway MAC : c0:3e:0f:4e:17:70 Backup Gateway IP : 0.0.0.0 Backup Gateway MAC : 00:00:00:00:00:00 802.1q VLAN ID : Disabled 802.1q VLAN Priority : 0 RMCP+ Cipher Suites : 1,2,3,6,7,8,11,12,0 Cipher Suite Priv Max : caaaXXaaaXXaaXX : X=Cipher Suite Unused : c=CALLBACK : u=USER : o=OPERATOR : a=ADMIN : O=OEM I have tried to access 192.168.1.15 as above but I get nothing, I also tried 192.168.1.15:623 because I read somewhere that IPMI tends to act over port 623 but again get nothing. I followed a guide here: https://www.thomas-krenn.com/en/wiki/Configuring_IPMI_under_Linux_using_ipmitool. still nothing! Finally, I downloaded SuperMicro IPMIView and I can connect to the server IPMI over 192.168.1.15, I can see some things about the server (power status, Motherboard Details, IPMI firmware version etc.), but IPMIView freezes when I try to look at sensors or use remote shell. I have read somewhere that it is likely due to java updates breaking IPMIView. Does intel offer a program similar to IPMIView? I have searched and found nothing!! Any other help will be much appreciated!!
-
This is going to sound like a stupid question I'm sure but; do all IPMI systems have a web-interface? I have googled "intel ipmi web interface" and found nothing. Could you give me any pointers at all as how to access the IPMI web interface? Currently I CAN get cpu temps through the coretemp sensors.lm module: root@Tower:~# modprobe coretemp root@Tower:~# sensors coretemp-isa-0000 Adapter: ISA adapter Core 0: +31.0°C (high = +61.0°C, crit = +71.0°C) Core 1: +28.0°C (high = +61.0°C, crit = +71.0°C) Core 9: +25.0°C (high = +61.0°C, crit = +71.0°C) Core 10: +31.0°C (high = +61.0°C, crit = +71.0°C) coretemp-isa-0001 Adapter: ISA adapter Core 0: +34.0°C (high = +61.0°C, crit = +71.0°C) Core 1: +28.0°C (high = +61.0°C, crit = +71.0°C) Core 9: +33.0°C (high = +61.0°C, crit = +71.0°C) Core 10: +28.0°C (high = +61.0°C, crit = +71.0°C) but I would prefer to use the IPMI route! Thanks for any help!
-
-
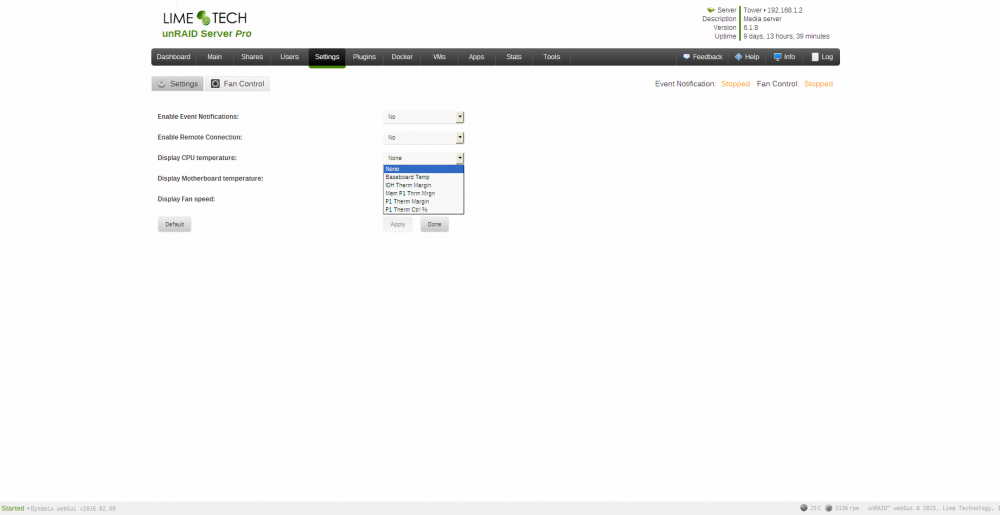
Thanks for this, great tool and I am looking forward to Fan Control! A quick question about my IPMI setup: Motherboard: Intel S5500WB CPUs: Intel Xeon CPU L5630 (x2) output of "/usr/bin/ipmitool -vc sdr": root@Tower:~# /usr/bin/ipmitool -vc sdr Running Get PICMG Properties my_addr 0x20, transit 0, target 0 Error Response 0xc1 from Get PICMG Properities No PICMG Extenstion discovered BB +1.1V IOH,1.084,Volts,ok,7.1,System Board,Voltage,1.102,1.067,1.133,,1.177,1.146,,1.027,1.054,0.068,1.190 BB +1.1V P1 Vccp,0.921,Volts,ok,7.1,System Board,Voltage,1.098,0.714,1.482,,1.543,1.501,,0.683,0.708,0.006,1.562 BB +1.5V P1 DDR3,,,ns,7.1,System Board,Voltage,1.492,1.420,1.570,,1.635,1.589,,1.362,1.401,-0.003,1.654 BB +1.8V AUX,1.781,Volts,ok,7.1,System Board,Voltage,1.797,1.743,1.851,,1.927,1.874,,1.673,1.720,-0.013,1.951 BB +3.3V,3.296,Volts,ok,7.1,System Board,Voltage,3.296,3.125,3.454,,3.625,3.525,,2.982,3.067,0.022,3.668 BB +3.3V STBY,3.239,Volts,ok,7.1,System Board,Voltage,3.296,3.125,3.454,,3.625,3.525,,2.982,3.067,0.022,3.668 BB +3.3V Vbat,2.997,Volts,ok,7.1,System Board,Voltage,2.997,2.542,3.139,,3.283,3.192,,2.178,2.502,0.007,3.322 BB +5.0V,4.994,Volts,ok,7.1,System Board,Voltage,4.994,4.744,5.243,,5.538,5.380,,4.471,4.630,-0.182,5.607 BB +5.0V STBY,4.972,Volts,ok,7.1,System Board,Voltage,4.908,4.672,5.143,,5.421,5.272,,4.416,4.565,0.029,5.486 BB +12.0V,12.247,Volts,ok,7.1,System Board,Voltage,11.987,11.363,12.559,,13.287,12.923,,10.739,11.103,0.183,13.443 BB +1.35v P1 MEM,1.378,Volts,ok,7.1,System Board,Voltage,1.354,1.289,1.425,,1.484,1.443,,1.236,1.271,-0.003,1.502 Baseboard Temp,25,degrees C,ok,66.1,Baseboard/Main System Board,Temperature,38.000,20.000,55.000,,66.000,61.000,,5.000,10.000,-128.000,127.000 IOH Therm Margin,-40,degrees C,ok,7.1,System Board,Temperature,-20.000,-40.000,0.000,,10.000,5.000,,,,-128.000,127.000 Mem P1 Thrm Mrgn,-47,degrees C,ok,7.1,System Board,Temperature,-20.000,-40.000,0.000,,10.000,5.000,,,,-128.000,127.000 Processor 1 Fan,3136,RPM,ok,29.1,Fan Device,Fan,8640.000,960.000,16320.000,,,,,640.000,768.000,0.000,16320.000 Processor 1A Fan,640,RPM,Lower Critical,29.2,Fan Device,Fan,8640.000,960.000,16320.000,,,,,640.000,768.000,0.000,16320.000 Processor 2 Fan,3136,RPM,ok,29.5,Fan Device,Fan,8640.000,960.000,16320.000,,,,,640.000,768.000,0.000,16320.000 P1 Therm Margin,-47,degrees C,ok,65.1,Processor,Temperature,-15.000,-70.000,0.000,,,,,,,-128.000,127.000 P1 Therm Ctrl %,0,percent,ok,3.1,Processor,Temperature,0.000,0.000,7.800,,19.500,11.700,,,,0.000,39.000 Pwr Unit Status,01h,ok,21.1, IPMI Watchdog,03h,ok,7.1, Physical Scrty,04h,ok,23.1, FP NMI Diag Int,05h,ok,7.1, SMI Timeout,06h,ok,7.1, System Event Log,07h,ok,7.1, System Event,08h,ok,7.1, P1 Status,60h,ok,3.1,Presence detected P1 VRD Hot,66h,ok,3.1, CATERR,68h,ok,3.1, CPU Missing,69h,ok,3.1, IOH Therm Trip,6Ah,ok,7.1, NM Capabilities,1Ah,ok,46.1, In the IMPI settings page I only get the following options for CPU temp (see attachment): Is there anything I should be doing to enable CPU temp? Thanks again!
-
That looks like a connection issue to a folding@home assignment server. Restart the container and check if the server is back up. Otherwise check that ports are open as per the folding@home docker template.
-
My ISP (Sky Ireland) provide a shite router (SkyHub 2.0) which does not easily provide DNS settings. My Solution: root@tower:# docker exec -it Observium /bin/bash root@300cb02a1ebf:#vi /etc/hosts add ip address and hostname to hostfile and BINGO, Observium resolves host!! hey Cap - thanks for sharing your solution. Quick question. I do have a router (ASUS RT N56-U) and I believe I have DNS configured (I believe) - do I still need to add ip address and hostname to hostfile. Based on that screenshot you will need to, the DNS setting pictured is not the same settings as previously mentioned in this thread.
-
Also, 2 questions for users of this plugin with observium? 1: Does location work for you? The map on my Observium homepage reports my server as being in Sao Miguel instead of Ireland!! 2: virbr0 appears as a "Port Down" for me, are others getting this error report? I believe it is the the network bridge created by KVM, but why is it appearing as down? My VMs have perfect network/internet access. Thanks!
-
My ISP (Sky Ireland) provide a shite router (SkyHub 2.0) which does not easily provide DNS settings. My Solution: root@tower:# docker exec -it Observium /bin/bash root@300cb02a1ebf:#vi /etc/hosts add ip address and hostname to hostfile and BINGO, Observium resolves host!!
-
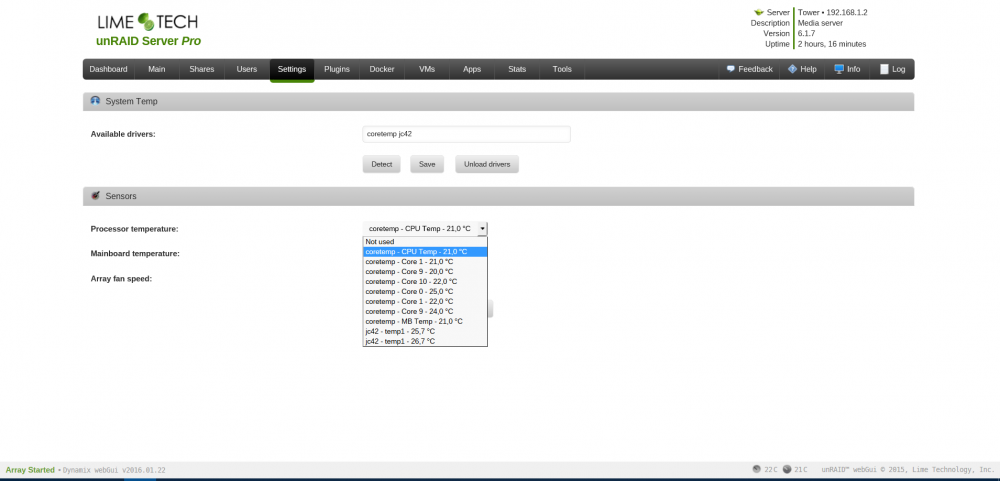
Each chip has 4 cores. For some reason (documented around the web) coretemp lists the cores of each CPU as: core 0 core 1 core 9 core 10 I could choose 1 core from each CPU as a reference of CPU temp, but being able to show temp of each CPU would allow me monitor for cooling problems on each CPU (Separate Fans). That make sense? Edit: For clarity. The output of sensors: root@Tower:/etc/sensors.d# sensors coretemp-isa-0000 Adapter: ISA adapter Core 0: +20.0°C (high = +61.0°C, crit = +71.0°C) Core 1: +19.0°C (high = +61.0°C, crit = +71.0°C) Core 9: +19.0°C (high = +61.0°C, crit = +71.0°C) Core 10: +23.0°C (high = +61.0°C, crit = +71.0°C) coretemp-isa-0001 Adapter: ISA adapter Core 0: +24.0°C (high = +61.0°C, crit = +71.0°C) Core 1: +20.0°C (high = +61.0°C, crit = +71.0°C) Core 9: +23.0°C (high = +61.0°C, crit = +71.0°C) Core 10: +20.0°C (high = +61.0°C, crit = +71.0°C) jc42-i2c-0-18 Adapter: SMBus I801 adapter at 3000 temp1: +25.2°C (low = +0.0°C) (high = +0.0°C, hyst = +0.0°C) (crit = +75.0°C, hyst = +75.0°C) jc42-i2c-0-1c Adapter: SMBus I801 adapter at 3000 temp1: +26.0°C (low = +0.0°C) (high = +0.0°C, hyst = +0.0°C) (crit = +75.0°C, hyst = +75.0°C)
-
Would it be possible in SystemTemp to add the option to show the temp of multiple CPUs if multiple CPUs are installed? The attached image shows my options but I can only choose 1:
-
Any chance of this feature being added to the DockerMan GUI similar the VM Manager? A list of CPU core checkboxes in the advanced mode would make managing CPU pinning much easier for those who want it.
-
This fixed the excessive usage in mycase: http://lime-technology.com/forum/index.php?topic=45249.0 Great find by aptalca! linuxserver/headphones had a log file 2GB big!!
-
Looks perfect! Many thanks!
-
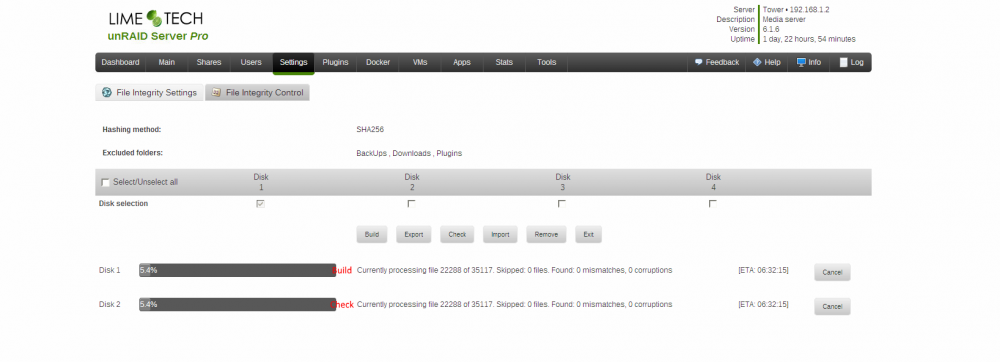
One small request: Would it be possible to show what action is currently underway above the progress bar? I have a relatively underpowered CPU so I set a task in motion and then check back over the day and I am likely to forget exactly what is running. Attached is a crude representation of what I am suggesting!! Many Thanks, The Capt. EDIT: attachment updated to slightly improve representation of idea. (If single or multiple discs active, show what tasks are running)
-
Any chance the legend could be put in a floating frame or something similar so that if I am scrolling through the log I don't need to go back up to the top of the page to check the colour legend? Also is there a colour for docker errors? I know Docker was not around in the unMENU days!! Thanks
-
Thanks!


