





Bitbass
Members
-
Joined
-
Last visited
Everything posted by Bitbass
-
Upgraded to 6.10.3 on both systems and still having the problem. The primary is on a different subnet from the target, but the firewall that's in the middle isn't causing a problem for anything else. I can access the target metrics page from other systems next to the primary, and the primary can access an Ubuntu target at 172.16.172.31, right next to the Unraid target. When I curl from the primary Unraid cli to the target Unraid metrics page it just hangs indefinitely. Is it possible something related to DNS is getting stuck? I have different "names" on each Unraid system, but the primary is simply called "unraid". I can't really change that. Is it possible the target is somehow responding with "unraid" to the query and the primary is getting confused and looking at itself? Maybe the target is trying to resolve "unraid" and getting confused. Could that be happening with the exporter plugin? Not sure that's what's going on. Here's the output from the curl: root@unraid:~# curl -v http://172.16.172.30:9100/metrics * Trying 172.16.172.30:9100... * Connected to 172.16.172.30 (172.16.172.30) port 9100 (#0) > GET /metrics HTTP/1.1 > Host: 172.16.172.30:9100 > User-Agent: curl/7.83.1 > Accept: */* > ************hangs at this point and I quit out of it ^C root@unraid:~# curl -v http://172.16.172.31:9100/metrics * Trying 172.16.172.31:9100... * Connected to 172.16.172.31 (172.16.172.31) port 9100 (#0) > GET /metrics HTTP/1.1 > Host: 172.16.172.31:9100 > User-Agent: curl/7.83.1 > Accept: */* > * Mark bundle as not supporting multiuse < HTTP/1.1 200 OK < Content-Type: text/plain; version=0.0.4; charset=utf-8 < Date: Mon, 20 Jun 2022 16:38:29 GMT < Transfer-Encoding: chunked < *********** full normal scrape after this. I've truncated it.
-
@dadarara Old post, I know, but how did you mount the PSU? I've been looking at doing something similar and the PSUs I've been looking at are kind of a mixed bag in terms of mounting points. Most are NOT good for that kind of flush mounting.
-
I took a look at the script and it lines up with the settings in the WebUI, but it’s dated 2009. It’s possible it hasn’t changed since then. I also don’t see any other “stuff” in that file, including user scripts. Is it possible it’s referencing another file and the actual problem is somewhere else?
-
I did have a user script for HDD temps many moons ago. Before the Container version of that. So I should be able to clean that up and it won't be a problem?
-
Just shutdown, installed replacement (larger) drive, booted up to start the rebuild and got this. Diagnostics attached.
-
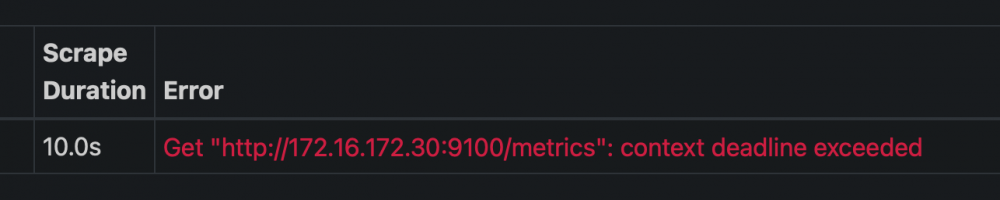
I'm an old crusty IT guy and it doesn't make any sense to me either. This is the error I get from the Docker on the primary Unraid: If I telnet to the primary Unraid and "curl http://172.16.172.30:9100/metrics" it just hangs indefinitely. If I "curl http://172.16.172.30:9100" I get an immediate response of the top level page with a link to the metrics page in the middle. If I go to http://172.16.172.30:9100/metrics from my Mac mini, which is on the same network as the primary Unraid, I can browse to that, I can curl it, everything works. If I telnet to the target Unraid and "curl http://172.16.172.30:9100/metrics" I get an immediate response. Not going to localhost, but the NIC's IP from itself. So, it's like something on the Primary Unraid, at the system level, is unhappy with the html response from the /metrics page on the target.
-
I know you weren't asking me but I'm up to date on both the docker primary and the plugin node exporter on the other Unraid. Unraid OS is current on both as well. I also added another bare bones Ubuntu node exporter over the weekend and it works fine. The problem I'm having is strictly from Unraid full scraping Unraid plugin. And I suspect it has something to do with Unraid itself, because I can't curl the plugin address from the CLI on the main Unraid system. Oddly enough, I can curl the plugin from itself. This would be a bit of work for me but I might be able to do a pcap to see what's going on at the IP level. Parse the actual html GETs.
-
Standard installs on both the main node in the docker and the target node exporter plugin. They are on different subnets, if that makes a difference. However, I’m successfully scraping a straight Ubuntu install on the same subnet as the target Unraid plugin. This appears to be a problem with the Unraid docker reading the Unraid plugin node. Everything else works ok.
-
Works fine against the non-unraid Ubuntu target. So, the problem seems to be with the target Unraid Node Exporter plugin being scraped by another Unraid server. That's pretty specific but it's what I'm finding.
-
I think I've narrowed this down to a problem with the HTML renderer on Unraid. It works fine to pull the 1.2.3.4:9100 page but fails to pull 1.2.3.4:9100/metrics. Just stalls and eventually times out. I have another non-Unraid target machine I'm going to set up to test this.
-
Just installed the plugin on the target Unraid system and pointed the YAML on the main system to the target. Fails with "context deadline exceeded". Every mention I've seen of this is that it's either a timeout problem (not in my case) or it's related to a docker change. Now, I'm running this as a plugin but does the plugin still use the docker bridge? Any other ideas for fixing this? Direct access to the metrics page works fine.
-
Still nothing working. The container starts, runs for 10-30 seconds and then quits. If I flip it to harvester only = false it starts and runs. I can then stop the chia daemon from the console and start the harvester. The weird thing is, in the farmer logs I only ever see the stop process causing a peer disconnect. I don't see a connect message. I have the logs set to INFO. So, it seems to be communicating something to the farmer.
-
I have the same question as christycent above. My setup is getting a bit complex and I want to start running only the harvester in this docker. If I configure only the plots variable plus the farmer ip, port and harvester only = true the docker will start and then immediately shut down. I can't keep it running. I thought removing the mnemonic variable might fix it but it does not. I haven't set this up at all yet, not as a full node or anything in between. I'd rather not run the full node setup process. Is there a way to simply start it as a harvester? Edit - do I have to update the mnemonic file just to get it to run? Edit 2 - I might end up answering my own question here. The git instructions kind of suggest you do need to do a full install on the harvester node before tagging it as harvester only = true.
-
And there’s no loss of data? I have another disk available and unraid complains about not being protected?
-
I currently have an array with parity that I'd like to use as a JBOD without parity. Can I shut down the array, flip the parity disk to a regular disk and then start the array back up? I don't care about losing individual disks, but I would like to take advantage of the user shares and other features of Unraid. I could spin up a linux instance and run it as a JBOD, but I haven't found an answer to the ease of creating SMB and NFS shares through a web gui.
-
Updated Grafana recently and I guess it went to v8.0.3. I didn’t have problems with my items (although it did change some of the coloring and formatting) but I’m now having Chrome and Chromium crashes on a couple of display systems. The Aw, Snap variety that don’t auto-recover. Anyone else dealing with this?
-
Can someone write up the MariaDB process for creating the user and DB? I've tried and I think I have it set up correctly, but I'm getting an access denied. Can't tell if I need to open something up on MariaDB or if I created or assigned the user incorrectly. This is all docker on Unraid and it's all new install.
-
binhex, thanks for pointing me in the right direction. It looks like it decided to do some metadata indexing: Apr 28, 2021 17:56:00.693 [0x152b98202b38] DEBUG - Updating metadata item (save) (IMG_2594) with ID 122370 Apr 28, 2021 17:56:01.475 [0x152b98202b38] DEBUG - Updating metadata item (save) (IMG_2595) with ID 122371 Apr 28, 2021 17:56:02.286 [0x152b98202b38] DEBUG - Updating metadata item (save) (IMG_2594) with ID 171654 Apr 28, 2021 17:56:03.060 [0x152b98202b38] DEBUG - Updating metadata item (save) (IMG_2595) with ID 171655 That's running endlessly and it appears to be making progress through the images. Just that it's also iterating different IDs like you can see here. I have 330k images, so it does concern me a little. Did Plex update a tagging feature in a recent release? I'm also seeing this: Apr 28, 2021 17:55:51.859 [0x152b99ae1b38] DEBUG - NetworkServiceBrowser: Parsing SSDP schema for http://192.168.169.10:8080/upnp Apr 28, 2021 17:55:51.859 [0x152b99ae1b38] DEBUG - HTTP requesting GET http://192.168.169.10:8080/upnp Apr 28, 2021 17:55:51.863 [0x152b99ae1b38] DEBUG - HTTP/1.1 (0.0s) 404 response from GET http://192.168.169.10:8080/upnp Apr 28, 2021 17:55:51.863 [0x152b99ae1b38] ERROR - SSDP: Error parsing device schema for http://192.168.169.10:8080/upnp Remote access works fine, and .10 is not my firewall. Never has been. It's actually a Unifi controller. So I'm not sure if this is Plex picking up a UPNP request from .10, or if it's a configuration Plex has embedded somewhere and it thought it needed to nag .10 for UPNP. I don't see any references to the controller sending UPNP traffic, only the USG devices. **edit - I found a reference to this error and how it was happening for someone else with Ubiquiti devices. So scratch the second half of this note. I'll leave it here in case someone else has the same issue. Anyway, I appreciate the help. Let me know if I need to take this over to the Plex forums. I don't mind doing that.
-
Ok, I've had to fix this before, but now I can't find the answer. Plex is pulling a lot of CPU all of a sudden. It started a couple of days ago (I monitor CPU in Graphana and know exactly when it happened). It was a couple of days after the 6.9.2 update was installed and in the middle of the day. It shouldn't have been the mover, and I wasn't messing around with firewall settings. Pretty quiet day, actually. No GPU build, just straight Binhex-plexpass. What should I check?
-
Just to lend my voice to the list...InfluxDB 2.0 also broke everything for me. Grafana was throwing the access error, but it also turns out I was not capturing any data from multiple sources, including Telegraf. It's possible the return to 1.8 blew out what was captured during that time, but that would be surprising to me. Changing to 1.8 brought it back, with the data gap.
-
No change since I posted this a week ago. I'm still getting the drop outs on two disks. Any thoughts on where I should look?
-
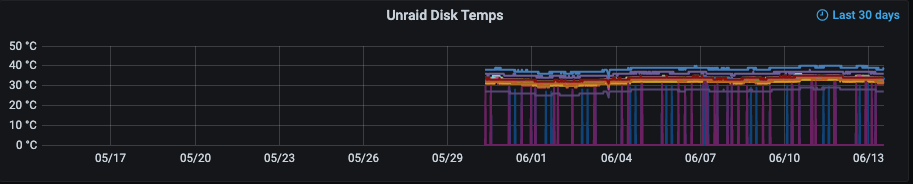
I don't appear to have the same problem with HDDTemp, but I do have another problem. Since switching to this docker I'm getting the following graph: The two disks with the vertical lines are usually reading at 0deg but will occasionally read the correct temps. The two disks in question happen to both be Seagate 4TB disks, but they aren't my only of that type. No other disks are behaving this way. Nothing unusual in the Unraid syslog. I happen to have another docker that's pulling Netatmo stats from the API. This one also quits reporting from time to time. I don't know if this is an Unraid docker problem, or if it's specific to how the container works. Any advice is appreciated!
-
I'm currently using a Norco 4220 (I think, it's old) installed in a 4 post rack. I'm thinking long term and would like to move toward removing the 4 post rack at some point, and going to either MDF wall mounting for everything or maybe just a 2 post rack. I also think I can reduce my disk count from the current 16 HDDs to 8 HDDs. So, to start, what are my options for something that can be wall mounted and carry 8 disks plus the ATX mobo? Something like a tower case with at least 8 3.5" bays that has mounting points for the back of the chassis? If I can't find a good option for that I'd consider a center mounted case in the 2 post rack.
-
Checking on Telegraf and I'm having a problem there with the array utilization reporting. Where can I find the array percent utilization? My previous comment about using the mean of fstype isn't work right. I think it's averaging the disk utilization across all XFS disks. The math doesn't work out the same. It's coming up as 66% utilized when the array is actually close to 68%.
-
Running Grafana and I'm having a problem with displaying to a Chromecast proxy. This is not a problem with the container, but rather a problem with the new version of Grafana. I want to do some troubleshooting and it was suggested I check the nginx access log. Where do I find that? I went into the console and looked in /var/log/grafana and it was empty.

