Greygoose
Members
-
Joined
-
Last visited
Everything posted by Greygoose
-
hi JorgeB, I sorted it, I had to hard shutdown the machine. Then restarting I could delete the share.
-
/usr/local/emhttp/plugins/fix.common.problems/scripts/scan.php diagnostics mkdir -p '/betty-diagnostics-20250126-1352/system' '/betty-diagnostics-20250126-1352/config' '/betty-diagnostics-20250126-1352/logs' '/betty-diagnostics-20250126-1352/shares' '/betty-diagnostics-20250126-1352/smart' '/betty-diagnostics-20250126-1352/qemu' '/betty-diagnostics-20250126-1352/xml' top -bn1 -o%CPU 2>/dev/null|todos >'/betty-diagnostics-20250126-1352/system/top.txt' tail /boot/bz*.sha256 >> '/betty-diagnostics-20250126-1352/unraid-7.0.0.txt' uptime nproc lscpu 2>/dev/null|todos >'/betty-diagnostics-20250126-1352/system/lscpu.txt' lsscsi -vgl 2>/dev/null|todos >'/betty-diagnostics-20250126-1352/system/lsscsi.txt' lspci -knn 2>/dev/null|todos >'/betty-diagnostics-20250126-1352/system/lspci.txt' lspci -vv 2>/dev/null| awk '/ASPM/{print $0}' RS=|grep -P '(^[a-z0-9:.]+|ASPM |Disabled;|Enabled;)'|todos >'/betty-diagnostics-20250126-1352/system/aspm-status.txt' lsusb 2>/dev/null|todos >'/betty-diagnostics-20250126-1352/system/lsusb.txt' free -mth 2>/dev/null|todos >'/betty-diagnostics-20250126-1352/system/memory.txt' lsof -Pni 2>/dev/null|todos >'/betty-diagnostics-20250126-1352/system/lsof.txt' lsmod|sort 2>/dev/null|todos >'/betty-diagnostics-20250126-1352/system/lsmod.txt' df -h 2>/dev/null|todos >'/betty-diagnostics-20250126-1352/system/df.txt' ip -br a|awk '/^(eth|bond)[0-9]+ /{print $1}'|sort dmidecode -qt2|awk -F: '/^ Manufacturer:/{m=$2};/^ Product Name:/{p=$2} END{print m" -"p}' 2>/dev/null|todos >'/betty-diagnostics-20250126-1352/system/motherboard.txt' dmidecode -qt0 2>/dev/null|todos >>'/betty-diagnostics-20250126-1352/system/motherboard.txt' cat /proc/meminfo 2>/dev/null|todos >'/betty-diagnostics-20250126-1352/system/meminfo.txt' dmidecode --type 17 2>/dev/null|todos >>'/betty-diagnostics-20250126-1352/system/meminfo.txt' ethtool 'eth0' 2>/dev/null|todos >>'/betty-diagnostics-20250126-1352/system/ethtool.txt' ethtool -i 'eth0' 2>/dev/null|todos >>'/betty-diagnostics-20250126-1352/system/ethtool.txt' ip -br a|todos >'/betty-diagnostics-20250126-1352/system/ifconfig.txt' sed -ri 's/(["\[ ])(127|10|172\.1[6-9]|172\.2[0-9]|172\.3[0-1]|192\.168)((\.[0-9]{1,3}){2,3}([/" .]|$))/\1@@@\2\3/g; s/(["\[ ][0-9]{1,3}\.)([0-9]{1,3}\.){2}([0-9]{1,3})([/" .]|$)/\1XXX.XXX.\3\4/g; s/@@@//g' '/betty-diagnostics-20250126-1352/system/ifconfig.txt' 2>/dev/null sed -ri 's/(([0-9a-f]{1,4}:){4})(([0-9a-f]{1,4}:){3}|:)([0-9a-f]{1,4})([ .:/]|$)/\1XXXX:XXXX:XXXX:\5\6/g' '/betty-diagnostics-20250126-1352/system/ifconfig.txt' 2>/dev/null sed -ri 's/(\[([0-9a-f]{1,4}:){4})(([0-9a-f]{1,4}:){3}|:)([0-9a-f]{1,4})(\])([ .:/]|$)/\1XXXX:XXXX:XXXX:\5\6/g' '/betty-diagnostics-20250126-1352/system/ifconfig.txt' 2>/dev/null sed -ri 's/(([0-9a-f]{1,4}:){4})(([0-9a-f]{1,4}:){3}|:)([0-9a-f]{1,4})(\/[0-9]{1,3})([ .:/]|$)/\1XXXX:XXXX:XXXX:\5\7/g' '/betty-diagnostics-20250126-1352/system/ifconfig.txt' 2>/dev/null find /sys/kernel/iommu_groups/ -type l 2>/dev/null|sort -V|todos >'/betty-diagnostics-20250126-1352/system/iommu_groups.txt' todos '/betty-diagnostics-20250126-1352/system/cmdline.txt' echo -ne ' /boot ' >>'/betty-diagnostics-20250126-1352/system/folders.txt';ls -l '/boot'|todos >>'/betty-diagnostics-20250126-1352/system/folders.txt' echo -ne ' /boot/config ' >>'/betty-diagnostics-20250126-1352/system/folders.txt';ls -l '/boot/config'|todos >>'/betty-diagnostics-20250126-1352/system/folders.txt' echo -ne ' /boot/config/plugins ' >>'/betty-diagnostics-20250126-1352/system/folders.txt';ls -l '/boot/config/plugins'|todos >>'/betty-diagnostics-20250126-1352/system/folders.txt' echo -ne ' /boot/syslinux ' >>'/betty-diagnostics-20250126-1352/system/folders.txt';ls -l '/boot/syslinux'|todos >>'/betty-diagnostics-20250126-1352/system/folders.txt' echo -ne ' /var/log ' >>'/betty-diagnostics-20250126-1352/system/folders.txt';ls -l '/var/log'|todos >>'/betty-diagnostics-20250126-1352/system/folders.txt' echo -ne ' /var/log/plugins ' >>'/betty-diagnostics-20250126-1352/system/folders.txt';ls -l '/var/log/plugins'|todos >>'/betty-diagnostics-20250126-1352/system/folders.txt' echo -ne ' /boot/extra ' >>'/betty-diagnostics-20250126-1352/system/folders.txt';ls -l '/boot/extra'|todos >>'/betty-diagnostics-20250126-1352/system/folders.txt' echo -ne ' /var/log/packages ' >>'/betty-diagnostics-20250126-1352/system/folders.txt';ls -l '/var/log/packages'|todos >>'/betty-diagnostics-20250126-1352/system/folders.txt' echo -ne ' /var/lib/pkgtools/packages ' >>'/betty-diagnostics-20250126-1352/system/folders.txt';ls -l '/var/lib/pkgtools/packages'|todos >>'/betty-diagnostics-20250126-1352/system/folders.txt' echo -ne ' /tmp ' >>'/betty-diagnostics-20250126-1352/system/folders.txt';ls -l '/tmp'|todos >>'/betty-diagnostics-20250126-1352/system/folders.txt' cp /boot/config/*.{cfg,conf,dat} '/betty-diagnostics-20250126-1352/config' 2>/dev/null cp /boot/config/go '/betty-diagnostics-20250126-1352/config/go.txt' 2>/dev/null sed -i -e '/password/c ***line removed***' -e '/user/c ***line removed***' -e '/pass/c ***line removed***' '/betty-diagnostics-20250126-1352/config/go.txt' sed -ri 's/^((disk|flash)(Read|Write)List.*=")[^"]+/\1.../' '/betty-diagnostics-20250126-1352/config/*.cfg' 2>/dev/null sed -ri 's/(["\[ ])(127|10|172\.1[6-9]|172\.2[0-9]|172\.3[0-1]|192\.168)((\.[0-9]{1,3}){2,3}([/" .]|$))/\1@@@\2\3/g; s/(["\[ ][0-9]{1,3}\.)([0-9]{1,3}\.){2}([0-9]{1,3})([/" .]|$)/\1XXX.XXX.\3\4/g; s/@@@//g' '/betty-diagnostics-20250126-1352/config/network.cfg' 2>/dev/null sed -ri 's/(([0-9a-f]{1,4}:){4})(([0-9a-f]{1,4}:){3}|:)([0-9a-f]{1,4})([ .:/]|$)/\1XXXX:XXXX:XXXX:\5\6/g' '/betty-diagnostics-20250126-1352/config/network.cfg' 2>/dev/null sed -ri 's/(\[([0-9a-f]{1,4}:){4})(([0-9a-f]{1,4}:){3}|:)([0-9a-f]{1,4})(\])([ .:/]|$)/\1XXXX:XXXX:XXXX:\5\6/g' '/betty-diagnostics-20250126-1352/config/network.cfg' 2>/dev/null sed -ri 's/(([0-9a-f]{1,4}:){4})(([0-9a-f]{1,4}:){3}|:)([0-9a-f]{1,4})(\/[0-9]{1,3})([ .:/]|$)/\1XXXX:XXXX:XXXX:\5\7/g' '/betty-diagnostics-20250126-1352/config/network.cfg' 2>/dev/null /usr/local/emhttp/webGui/scripts/show_interfaces ip|tr ',' ' ' >'/betty-diagnostics-20250126-1352/config/listen.txt' /usr/local/emhttp/webGui/scripts/error_interfaces|sed 's///' >>'/betty-diagnostics-20250126-1352/config/listen.txt' sed -ri 's/(["\[ ])(127|10|172\.1[6-9]|172\.2[0-9]|172\.3[0-1]|192\.168)((\.[0-9]{1,3}){2,3}([/" .]|$))/\1@@@\2\3/g; s/(["\[ ][0-9]{1,3}\.)([0-9]{1,3}\.){2}([0-9]{1,3})([/" .]|$)/\1XXX.XXX.\3\4/g; s/@@@//g' '/betty-diagnostics-20250126-1352/config/listen.txt' 2>/dev/null sed -ri 's/(([0-9a-f]{1,4}:){4})(([0-9a-f]{1,4}:){3}|:)([0-9a-f]{1,4})([ .:/]|$)/\1XXXX:XXXX:XXXX:\5\6/g' '/betty-diagnostics-20250126-1352/config/listen.txt' 2>/dev/null sed -ri 's/(\[([0-9a-f]{1,4}:){4})(([0-9a-f]{1,4}:){3}|:)([0-9a-f]{1,4})(\])([ .:/]|$)/\1XXXX:XXXX:XXXX:\5\6/g' '/betty-diagnostics-20250126-1352/config/listen.txt' 2>/dev/null sed -ri 's/(([0-9a-f]{1,4}:){4})(([0-9a-f]{1,4}:){3}|:)([0-9a-f]{1,4})(\/[0-9]{1,3})([ .:/]|$)/\1XXXX:XXXX:XXXX:\5\7/g' '/betty-diagnostics-20250126-1352/config/listen.txt' 2>/dev/null sed -ri 's/^(share(Comment|ReadList|WriteList)=")[^"]+/\1.../' '/betty-diagnostics-20250126-1352/shares/a-a.cfg' 2>/dev/null
-
I am trying to get a diagnostics report whilst i type this, but its got to shares part of the diagnostics report and now continuously loading.
-
hi, i tried to delete a share under the share tab, machine froze. I rebooted, now when i click shares the machines apears to lock up, i remote into ssh and access MC and all fine until i click the user directory and it freezes again.
-
Hi, I have no idea why this has happened, im trying to restore MariDB from a backup.
-
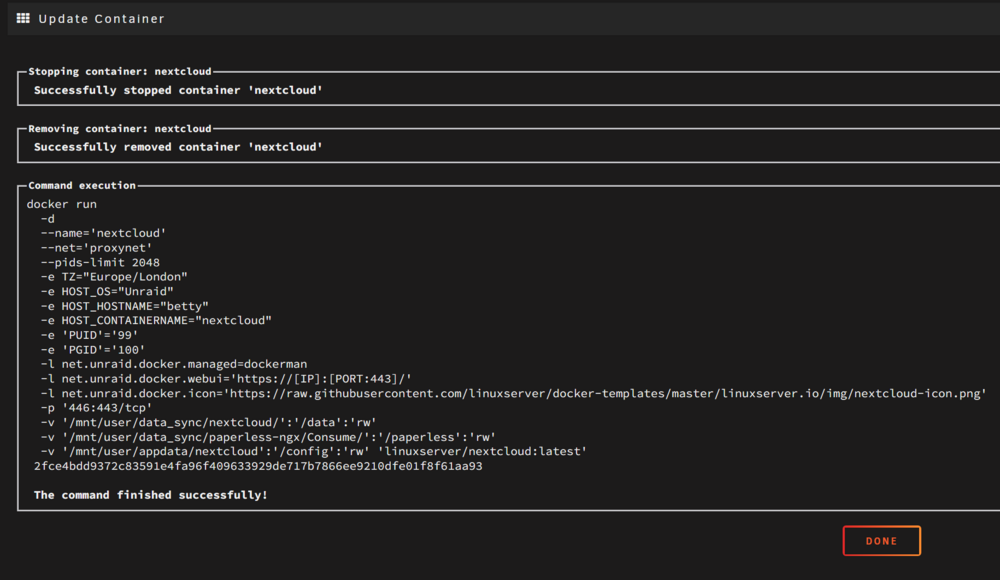
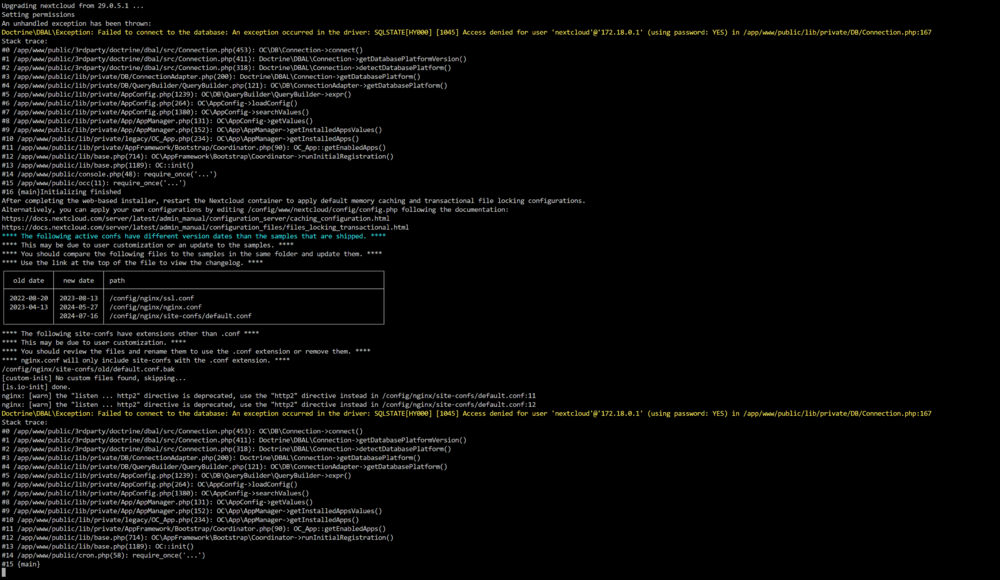
Hey, thnaks for the help. ok ive posted the docker run and the log from nextcloud which shows errors. ive not touched anything to cause this to happen. Reddis running no issues on the docker run.
-
my nexcloud just stopped working... Ive searched and im a little lost, is it reddis causing it, im unsure how to locate the issue.

-
ok sorted the above, the below config shows up no errors if i console into docket and type borgmstic list. I hope this helps someone else. took me a few hours as ive not had to work on borg for a while so was great fun and refresher, I had to add -path: label archive_name_format: 'backup-{now}' -------------------------------------- #location: source_directories: - /mnt/user/data_storage/Photo&Video-Collections repositories: - path: ssh://blarblarblar label: photo_video one_file_system: true files_cache: mtime,size patterns: - '- [Tt]rash' - '- [Cc]ache' exclude_if_present: - .nobackup - .NOBACKUP #storage: encryption_passphrase: "thisisasecret" compression: none ssh_command: ssh -i /root/.ssh/id_ed24419 archive_name_format: 'backup-{now}' #retention: keep_hourly: 2 keep_daily: 7 keep_weekly: 4 keep_monthly: 12 keep_yearly: 10 archive_name_format: 'backup-{now}' #consistency: # checks: # - repository # # - archives # prefix: 'backup-' #hooks: before_backup: - echo "Starting a backup." after_backup: - echo "Finished a backup." on_error: - echo "Error during prune/create/check." #healthchecks: #ping_url: https://hc-ping.com/434343434343
-
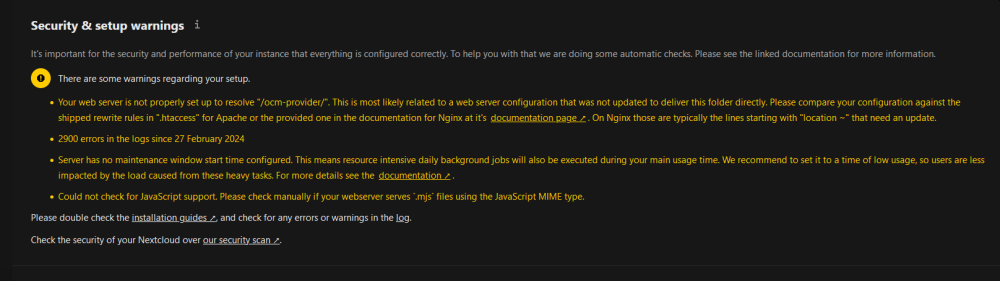
Wow this is great, thank you. I have played about a bit more to clear errors but still have two that i can resolve?

-
Hi sdub, thanks for the reply mate. yes i edited using notepad++ in windows 11. I have dont this with other files and its been ok but it certainly could be the issue. EDIT: How do you edit the yaml files?, ie what software?
-
can someone please paste thier recent working yaml file. im getting lots of errors as things look to have changed in borgmatic itself. ------------------ /etc/borgmatic.d/Photo&Video-Collections.yml: Error parsing configuration file An error occurred while parsing a configuration file at /etc/borgmatic.d/Photo&Video-Collections.yml: did not find expected <document start> in "<unicode string>", line 42, column 1 /etc/borgmatic.d/config_datasync.yml: Error parsing configuration file An error occurred while parsing a configuration file at /etc/borgmatic.d/config_datasync.yml: At the top level: 'repositories' is a required property /etc/borgmatic.d/config_nextcloud.yml: Error parsing configuration file An error occurred while parsing a configuration file at /etc/borgmatic.d/config_nextcloud.yml: did not find expected <document start> in "<unicode string>", line 53, column 1 /etc/borgmatic/config.yaml /etc/borgmatic.d /root/.config/borgmatic/config.yaml /root/.config/borgmatic.d: No valid configuration files found Need some help? https://torsion.org/borgmatic/#issues ------------ /etc/borgmatic.d/Photo&Video-Collections.yml: The checks option now expects a list of key/value pairs. Lists of strings for this option are deprecated and support will be removed from a future release. /etc/borgmatic.d/Photo&Video-Collections.yml: The repositories option now expects a list of key/value pairs. Lists of strings for this option are deprecated and support will be removed from a future release. /etc/borgmatic.d/Photo&Video-Collections.yml: The prefix option is deprecated and support will be removed from a future release. Use archive_name_format or match_archives instead.
-
great guide, helped a lot. Anything else you can update, keep thread alive as things change or you learn new tricks that would be great. thank you
-
thank you, Under /config on the usb drive it shows the name basic.key
-
I have searched, so sorry if this has been asked. I have a USB stick i purchased a license for some years ago, i want to use this stick as a spare unraid machine but i done know what license is on/registered to the stick? How can i check the license on this usb stick without booting it up. Is there a windows way?
-
hey, so my docker filled up today, i located the issue to immich. ive checked my mapings in docker and they all seem fine, any ideas?
-
Thanks Kilrah, I have jumped the gun slightly and installed a second instance of nextcloud. The current nextcloud was installed and running/used dialy by multiple people since 2019 (time flys).
-
Is it worth me installing nextcloud from scratch if im having these errors.
-
Hey itimpi, Spot on, removed it and now working. Thank you
-
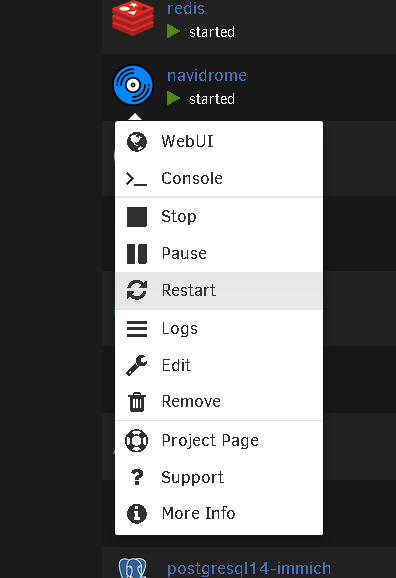
hey, Got a strange issue. I cant restart ANY dockers, it shows the restart button but it doesnt work. I click it any literally nothing happens...
-
This solved my issue, thank you.
-
This and the Dynamix file manager plugin solved the update issue for me. When using the dynamix plug click the nextcloud folder in appdata, goto the options at the bottom and change ownership to nobody. Then it updates fine as per above.
-
Just found this plugin, must have midded it Very happy with it, great work.
-
im trying to resolve this issue aswell as most others., I get this error when i try to do the upgrade Nextcloud or one of the apps require upgrade - only a limited number of commands are available You may use your browser or the occ upgrade command to do the upgrade Cannot write into "apps" directory. This can usually be fixed by giving the web server write access to the apps directory or disabling the App Store in the config file. An unhandled exception has been thrown: Exception: Environment not properly prepared. in /config/www/nextcloud/lib/private/Console/Application.php:167 Stack trace: #0 /config/www/nextcloud/console.php(99): OC\Console\Application->loadCommands() #1 /config/www/nextcloud/occ(11): require_once('...') #2 {main}root@62ccda3b9b50:/config/www/nextcloud# Id appreciate some advice how to resolve, a small step by step if possible please.
-
Has anyone got this working?
-
im trying to get paperless-ngx to work but i keep getting an error. the paperless login comes up, when ienter username and password i get the following error my conf file server { listen 443 ssl; listen [::]:443 ssl; server_name paperless-ngx.*; include /config/nginx/ssl.conf; client_max_body_size 0; # enable for ldap auth, fill in ldap details in ldap.conf #include /config/nginx/ldap.conf; # enable for Authelia include /config/nginx/authelia-server.conf; #Organizr ServerAuth #include /config/nginx/proxy-confs/organizr-auth.subfolder.conf; #auth_request /auth-0; location / { # enable the next two lines for http auth # auth_basic "Restricted"; # auth_basic_user_file /config/nginx/.htpasswd; # enable the next two lines for ldap auth # auth_request /auth; # error_page 401 =200 /ldaplogin; # enable for Authelia # include /config/nginx/authelia-location.conf; include /config/nginx/proxy.conf; resolver 127.0.0.11 valid=30s; set $upstream_app 192.168.10.221; set $upstream_port 8000; set $upstream_proto http; proxy_pass $upstream_proto://$upstream_app:$upstream_port; # REMOVE THIS LINE BEFORE SUBMITTING: Additional proxy settings such as headers go below this line, leave the blank line above. } } EDIT: this post helped fix the issue https://github.com/paperless-ngx/paperless-ngx/issues/712