


LateNight
Members
-
Joined
-
Last visited
Everything posted by LateNight
-
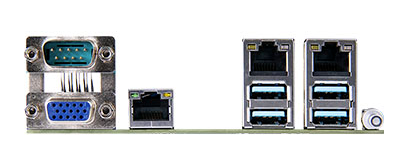
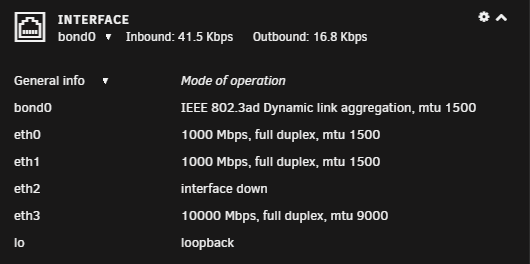
The E3C246D4U has a dedicated LAN port in addition to the two Intel ports. I've also added a 10G card.
-
Yes, I've had it that way since installing it.

-
Going in and saving again, without making changes, fixed the issue. No log entries overnight. Thank you.
-
Just went into settings again and saved (no changes). New parity.check.tuning.cron: # Generated schedules for parity.check.tuning 0 23 * * * /usr/local/emhttp/plugins/parity.check.tuning/parity.check.tuning.php "resume" &> /dev/null 0 7 * * * /usr/local/emhttp/plugins/parity.check.tuning/parity.check.tuning.php "pause" &> /dev/null */7 * * * * /usr/local/emhttp/plugins/parity.check.tuning/parity.check.tuning.php "monitor" &>/dev/null I'm guessing that fixed the issue - will check in the morning.
-
Log: Feb 8 23:04:02 DeathStar crond[2219]: failed parsing crontab for user root: /usr/local/emhttp/plugins/parity.check.tuning/parity.check.tuning.php "resume" &> /dev/null Feb 8 23:04:02 DeathStar crond[2219]: failed parsing crontab for user root: /usr/local/emhttp/plugins/parity.check.tuning/parity.check.tuning.php "pause" &> /dev/null Feb 8 23:19:01 DeathStar crond[2219]: failed parsing crontab for user root: /usr/local/emhttp/plugins/parity.check.tuning/parity.check.tuning.php "resume" &> /dev/null Feb 8 23:19:01 DeathStar crond[2219]: failed parsing crontab for user root: /usr/local/emhttp/plugins/parity.check.tuning/parity.check.tuning.php "pause" &> /dev/null Feb 8 23:34:01 DeathStar crond[2219]: failed parsing crontab for user root: /usr/local/emhttp/plugins/parity.check.tuning/parity.check.tuning.php "resume" &> /dev/null Feb 8 23:34:01 DeathStar crond[2219]: failed parsing crontab for user root: /usr/local/emhttp/plugins/parity.check.tuning/parity.check.tuning.php "pause" &> /dev/null Feb 8 23:48:02 DeathStar crond[2219]: failed parsing crontab for user root: /usr/local/emhttp/plugins/parity.check.tuning/parity.check.tuning.php "resume" &> /dev/null Feb 8 23:48:02 DeathStar crond[2219]: failed parsing crontab for user root: /usr/local/emhttp/plugins/parity.check.tuning/parity.check.tuning.php "pause" &> /dev/null Feb 9 00:03:02 DeathStar crond[2219]: failed parsing crontab for user root: /usr/local/emhttp/plugins/parity.check.tuning/parity.check.tuning.php "resume" &> /dev/null parity.check.tuning.cron # Generated schedules for parity.check.tuning /usr/local/emhttp/plugins/parity.check.tuning/parity.check.tuning.php "resume" &> /dev/null /usr/local/emhttp/plugins/parity.check.tuning/parity.check.tuning.php "pause" &> /dev/null */7 * * * * /usr/local/emhttp/plugins/parity.check.tuning/parity.check.tuning.php "monitor" &>/dev/null parity.tuning.cfg parityTuningIncrements="yes" parityTuningFrequency="daily" parityTuningResumeCustom="" parityTuningResumeHour="23" parityTuningResumeMinute="0" parityTuningPauseCustom="" parityTuningPauseHour="7" parityTuningPauseMinute="0" parityTuningUnscheduled="yes" parityTuningRecon="no" parityTuningClear="no" parityTuningNotify="no" parityTuningHeat="yes" parityTuningHeatHigh="2" parityTuningHeatLow="10" parityTuningHeatNotify="yes" parityTuningDebug="no" parityTuningHeatShutdown="yes" parityTuningHeatCritical="1" parity-checks.log parity.check.tuning.progress.save
-
Now showing every 15 minutes in my log: failed parsing crontab for user root: /usr/local/emhttp/plugins/parity.check.tuning/parity.check.tuning.php "pause" &> /dev/null Unraid Version: 6.8.3
-
Repeated messages in log, every seven minutes: crond[2212]: exit status 126 from user root /usr/local/emhttp/plugins/parity.check.tuning/parity.check.tuning.php "monitor" &>/dev/null
-
I've had Turbo disabled but decided to re-enable it again last night. Server crashed overnight. I wasn't running anything that should stress the server. ¯\_(ツ)_/¯

-
I have the following debug messages every five minutes in my log: I did verify that I have logging disabled. This started after the most recent update - 2020.10.23

-
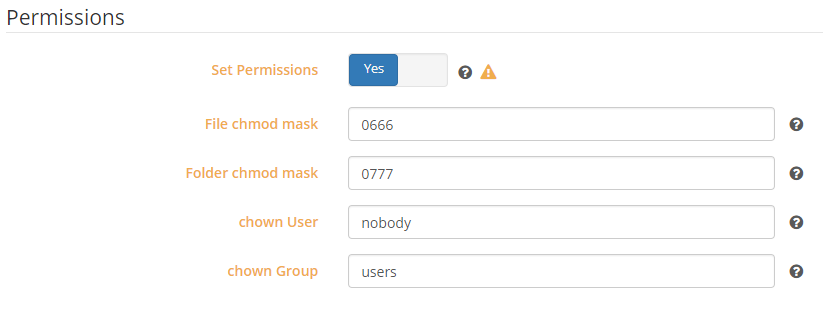
Sorry, should have linked to the second response and not the thread. I was also having permission issues until I enabled the Set Permissions option. I did change the chown User to 99, and chown Group to 100 but it appears either works.
-
@unRAIDuser7 @TexasUnraid have you tried the "Set Permissions" option in Sonarr, as explained at:
-
Had this error occur overnight. I had added a headphones docker. Unfortunately, I turned off my syslog server and the logs weren't saved after reboot.

-
This is listed in the manual: Clear CMOS - 1 (short pin), but I don't see it in their diagram. Pulling the battery should work.
-
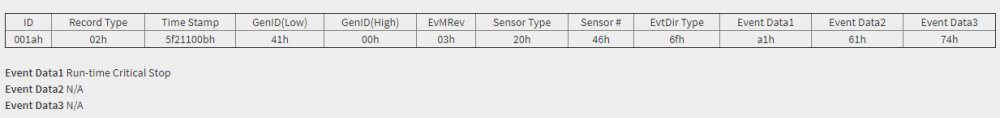
@JM2005 - he asked some clarifying questions, mostly about my BIOS settings, but no word today.Interesting. I have already been in contact with William at ASRock and he's walking me through the steps of eliminating other devices in my system (10GB card and flashed IBM m1015). Are you seeing the same output when clicking on the CU_CATERR event in the log?@JM2005 - when you click on that entry in the IPMI log what does it show? On my system it shows:
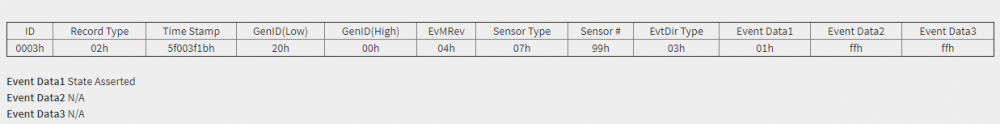 Thank you @Hoopster. I read earlier in the thread that you had disabled Turbo Boost but wrote it off as it seemed it was temperature related. I have not seen anything in my system reach over 40°C (except that MB sensor showing 85°C), and watching most of the parity check the CPU never went above 38°C. However after disabling Turbo Boost, I was able to complete a parity check.Thank you @Hoopster for this deal/thread. I upgraded my almost 9 year old server. I'm running into an odd issue and trying to determine if it's hardware or software. My system runs fine until I start a parity check. During the parity check unRaid freezes but I am still able to reach the IPMI interface. I'm using BMC Firmware 1.80.00 and BIOS Firmware L2.21A. From my IPMI event log it shows CPU_CATERR. 3 | 07/04/2020, 08:34:35 | CPU_CATERR | Processor | State Asserted - Asserted I ran a syslog server but I don't see anything related. <30>Jul 4 02:46:03 DeathStar ool www[17368]: /usr/local/emhttp/plugins/dynamix/scripts/rsyslog_config 192.168.1.5 04/07 02:46:03.013 <46>Jul 4 02:46:06 DeathStar rsyslogd: [origin software="rsyslogd" swVersion="8.1908.0" x-pid="17979" x-info="https://www.rsyslog.com"] start 192.168.1.5 04/07 02:46:05.473 <4>Jul 4 02:46:32 DeathStar kernel: mdcmd (88): spindown 3 192.168.1.5 04/07 02:46:31.123 <4>Jul 4 02:46:32 DeathStar kernel: mdcmd (89): spindown 6 192.168.1.5 04/07 02:46:32.001 <4>Jul 4 02:46:34 DeathStar kernel: mdcmd (90): spindown 4 192.168.1.5 04/07 02:46:33.832 <4>Jul 4 02:46:35 DeathStar kernel: mdcmd (91): spindown 5 192.168.1.5 04/07 02:46:34.483 <4>Jul 4 02:46:45 DeathStar kernel: mdcmd (92): check 192.168.1.5 04/07 02:46:44.087 <4>Jul 4 02:46:45 DeathStar kernel: md: recovery thread: check P ... 192.168.1.5 04/07 02:46:44.087 <13>Jul 4 03:00:01 DeathStar Recycle Bin: Scheduled: Files older than 7 days have been removed 192.168.1.5 04/07 03:00:00.645 <77>Jul 4 03:40:21 DeathStar crond[2295]: exit status 1 from user root /usr/local/sbin/mover &> /dev/null 192.168.1.5 04/07 03:40:20.584 I also downloaded the MCA Log (attached). It looks like the CPU may be defective, but I've never seen anything like it. CPU1 Do not Present!! Get CPU0 MCA Error Source Log failed: CC = 0x81 Get CPU core number failed: CC = 0x81. Default catch 28 cores. Diagnostics also attached, run just after rebooting. Any help is appreciated, and can move this to its own topic if needed. MCALog.txt deathstar-diagnostics-20200704-1144.zipI added a new Path for /etc/localtime but my time is still off. yes, add a new Path for /etc/localtime as shown below:
 The Query Log time is exactly +5 hours from my actual time (EST). Is there a variable I can set to correct for what I think is the incorrect timezone?I had the same problem but changed the Network Type from Bridge mode to Host mode I think so! here's all my configuration (it even shows the URL with the unRAID server IP) thanks a lot!
 Dynamix Local Master: I've got a strange display issue on the plugins page. See attached picture. Chrome inspect shows: Failed to load resource: the server responded with a status of 404 (File not found). The image does show correctly at the top of the page.
 I'm trying to upgrade from 2016.0.01a to 2016.01.02 but receive the following error: plugin: bad file MD5: /boot/config/plugins/dynamix.file.integrity/dynamix.file.integrity.txzFantastic! Thank you.


