





jbartlett
Community Developer
-
Joined
-
Last visited
Everything posted by jbartlett
-
Man, today is NOT my day. I accidentally included an updated version of the hardware scan script intended for version 3. It'll display "optimizing images" and then nothing. If you click on the header, it'll take you to the main screen. Working on fixing that....
-
Thanks for the pastebin, it helped me isolate the issue. Problem happened when a drive was not found in the database but the docker app expected some kind of image (legacy copy-n-paste). It didn't happen to me because all my drives existed. I added an ancient IDE drive, duplicated the error, and fixed it. Please update your Docker if you ran into this issue.
-
Please update the docker and try again. I re-wrote the process which fetches the images so I'm hoping it works for you now. In addition, if you edit a drive image and then submit it, it will restore it on the same UNRAID box. If you get another error, please create a full debug file from the DiskSpeed app and email it to [email protected]
-
Ugh. Something weird is going on. I can't duplicate. Investigating...
-
I found and fixed the issue. You just need to click the "Rescan Controllers" button.
-
That's normal operation. I'm seeing some weird results for your system when fetching the drive images that don't show up for me. Just to verify, when you click on "Purge Everything and Start Over", it scans the controllers and at the end you do NOT see something like this: 11:48:48 Fetching drive images 11:48:49 Drive image found for Western Digital WDS256G1X0C 11:48:49 Drive image found for Western Digital WD6002FFWX 11:48:49 Drive image found for Seagate ST4000DM000 11:48:49 Drive image found for Western Digital WD100EFAX 11:48:49 Drive image found for Seagate ST8000AS0002 11:48:49 Drive image found for Western Digital WD80EFZX 11:48:49 Drive image found for Western Digital WD2002FAEX 11:48:49 Fetching Drive Platter Information 11:48:49 Checking Hard Drive Database for drives 11:48:49 Optimizing images... 11:48:49 Configuration saved
-
The program logs the results it gets back and it shows an HTTP 200 status code but an empty result. I just pushed an update to Docker which will also log the URL it used to check for the drive images. Please update the docker and if it does not automatically scan the hardware, click the "Rescan controllers" button and then send me another small debug file.
-
Does the server have Internet access? That's how the drive images are fetched. If so, can you hit the "Rescan Controllers" button and see what it says towards the bottom where it says "Checking Hard Drive Database for drives"? If it doesn't have access to the internet, adding the image is simple. View the HDDB and download the image for the drive. View any one of the drives on your server in DiskSpeed and click the "Edit Drive" button. From there, you can upload the image for the drive to display.
-
The hard drive benchmark turns out to not be the correct way to test solid state devices. If it accesses an area that has been assigned/written, then you will get back expected/rated results. If it accesses an area that has not been written to, you will get back far higher results since no storage medium is accessed. This method will only properly work with solid state drives that have been completely filled up at least once. As such, different SSD's will give different results even if they're the same model based on previous usage. I'm working on completely redoing how solid state devices are benchmarked and as such benchmarking may not be available to everyone based on how the drive is used. The way I intend to do it is to identify a large file and read it or create a 50GB file and read it back. Solid state devices that exist in a multi-device pool will not be able to be benchmarked when version 3 is released. A future version may allow it by bulk reading the device until it can identify a high/low range of numbers so it can figure out which range represents allocated areas and which range represents unallocated areas.
-
I've determined a way to reliably benchmark SSD's though it won't help in isolating troublesome spots like drives with platters. To test SSD's, I will create a 10GB file with random data and then read that file back bypassing the cache. SSD's must have at least 50GB space available to be tested. This feature will be in version 3 which I'm working on now. Since version 3 will also display partition information, I plan on adding write benchmarking support in a subsequent release on drives with no partitions defined.
-
<emulatorpin cpuset='0,11'/> Set it to a single non-zero CPU or just remove. I've never seen it utilize the HT pair. Free up CPU 0 & it's HT partner from isolation to let UNRAID use it.
-
I missed the word "before" and was only seeing the before pic since I hadn't scrolled far enough before. I was like "uhhhh"
-
Pushed version 2.8.1 which adds support for running benchmarks on drives assigned to non-Cache storage pools in UNRAID 6.9
-
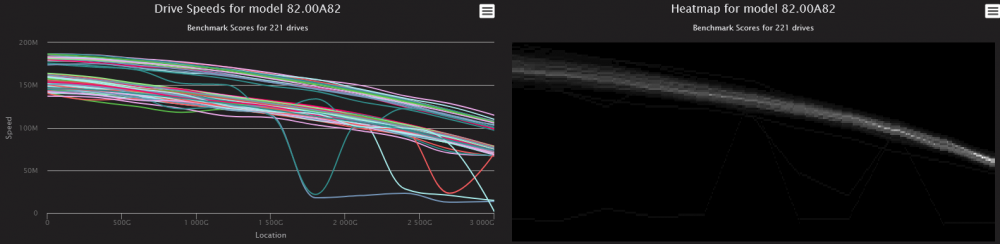
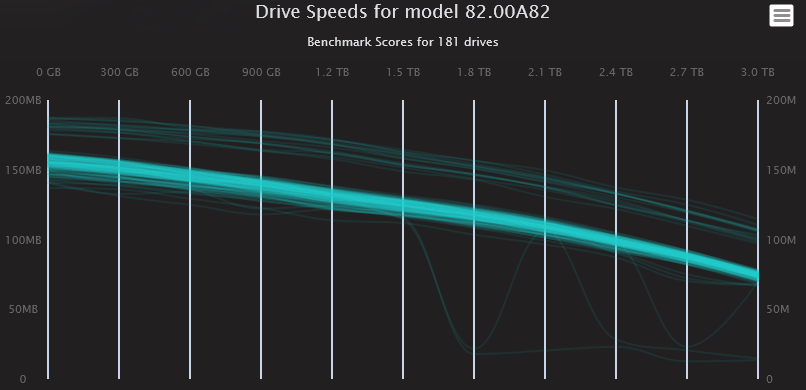
Update to the Hard Drive Database to display a new Heat Map version and remove the original graph which is spammy. Original: New:
-
Is it possible to add more than one GPUID in the "Nvidia Visible Devices" variable? If so, what is the delimiter?
-
Because at one point in time, a video card wouldn't even show up in the VM editor unless it was stubbed out. I missed that this restriction was removed.
-
Tried using pci-stub instead of VFIO but that netted the same result. Looks like if I want to use a graphics card with both Docker and a VM (but of course not at the same time), I'll need to create separate boot configs - one with the graphics card stubbed out for the VM and one without for the Docker.
-
Apologies if it has been covered but I've been over half of the pages and haven't seen anything related. I have two nVidia cards installed on my system. [10de:1c30] 41:00.0 VGA compatible controller: NVIDIA Corporation GP106GL [Quadro P2000] (rev a1) [10de:10f1] 41:00.1 Audio device: NVIDIA Corporation GP106 High Definition Audio Controller (rev a1) [10de:1d01] 42:00.0 VGA compatible controller: NVIDIA Corporation GP108 [GeForce GT 1030] (rev a1) [10de:0fb8] 42:00.1 Audio device: NVIDIA Corporation GP108 High Definition Audio Controller (rev a1) The first card, the Quadro P2000, is bound via VFIO on the System Devices page and is attached to a VM. When the VM is not in use, I'd like to use it in a Folding@Home Docker container. From what I read, it was OK to use a graphics card on a VM or Container, but not at the same time and that at least one card had to NOT be bound to VFIO. The GT 1030 card is the boot card and is seen by this plugin. However, the Quadro P2000 is not. Any advice? root@VM1:~# nvidia-smi Thu Jan 21 22:56:49 2021 +-----------------------------------------------------------------------------+ | NVIDIA-SMI 455.45.01 Driver Version: 455.45.01 CUDA Version: 11.1 | |-------------------------------+----------------------+----------------------+ | GPU Name Persistence-M| Bus-Id Disp.A | Volatile Uncorr. ECC | | Fan Temp Perf Pwr:Usage/Cap| Memory-Usage | GPU-Util Compute M. | | | | MIG M. | |===============================+======================+======================| | 0 GeForce GT 1030 Off | 00000000:42:00.0 Off | N/A | | 42% 34C P0 N/A / 30W | 0MiB / 1999MiB | 0% Default | | | | N/A | +-------------------------------+----------------------+----------------------+ +-----------------------------------------------------------------------------+ | Processes: | | GPU GI CI PID Type Process name GPU Memory | | ID ID Usage | |=============================================================================| | No running processes found | +-----------------------------------------------------------------------------+
-
Look up the drives on the HDDB to see if other people are getting similar speeds. If so, I may need to adjust the bandwidth cap threshold. Note that you can click on the drive labels on the line graphs to hide drives to better show the ones affected.
-
If it's on an individual disk it would be represented by a somewhat flat line on the graph over several test locations. Since the trend is always downward on a spinner, a flat area means the drive is capable of outputting more data than the controller (or downstream) can handle. If it's on a controller benchmark, it means that the controller can't handle the maximum output of all the drives connected to it at the same time and is a bottleneck. Submit graphs to better explain what you are referencing if this doesn't cover it.
-
docker exec -it DiskSpeed bash root@af468d0f3720:/usr/local/tomcat# nvme id-ns /dev/nvme0n1 NVME Identify Namespace 1: nsze : 0x3a386030 ncap : 0x3a386030 nuse : 0x10facc48 nsze: Total size of the name space LBA ncap: Max number of LBA nuse: LBA's allocated to the name space. It looks like if I do a dd read on the device starting at the start not to exceed "nuse" would return data read If nuse is under a given duration/size, a benchmark can not be done. Alternately, if a file is found in excess of a given size that has no unwritten extends reported by "filefrag -e <fn>" on it, it can be read for a given number of seconds. Thoughts?
-
So the correct logic would be to take the lowest speed as the maximum read speed? There will be interface issues on some systems so an average of the lowest speed of every reported SSD of the same make/model/revision would be better representative of the whole.
-
That's a trend across pretty much every SSD and I don't have an answer for you as to why. On the HDDB, I take the peek speed and report that as the transfer speed.
-
Check the SMART report to see if there are pending reallocated sectors, such could explain slow spots because it's trying to do multiple reads of a sector. You can force a check for bad sectors by performing a preclear on it with no pre or post reads. Note that this is only if you would intend to use the drive as long term no update no risk storage. I had a drive with similar slow spots that developed over 20k pending sectors after a preclear.
-
You are correct. I had an empty XFS volume that I copied large files to and when I created a file allocation map, they were NOT located at the start of the drive but spread out in three general areas across the drive.




