


chris smashe
Members
-
Joined
-
Last visited
Everything posted by chris smashe
-
Fixed it. I was running unraid 6.x and my intel 14700K was to new i think. After trying many things i upgraded unraid and it now works.
-
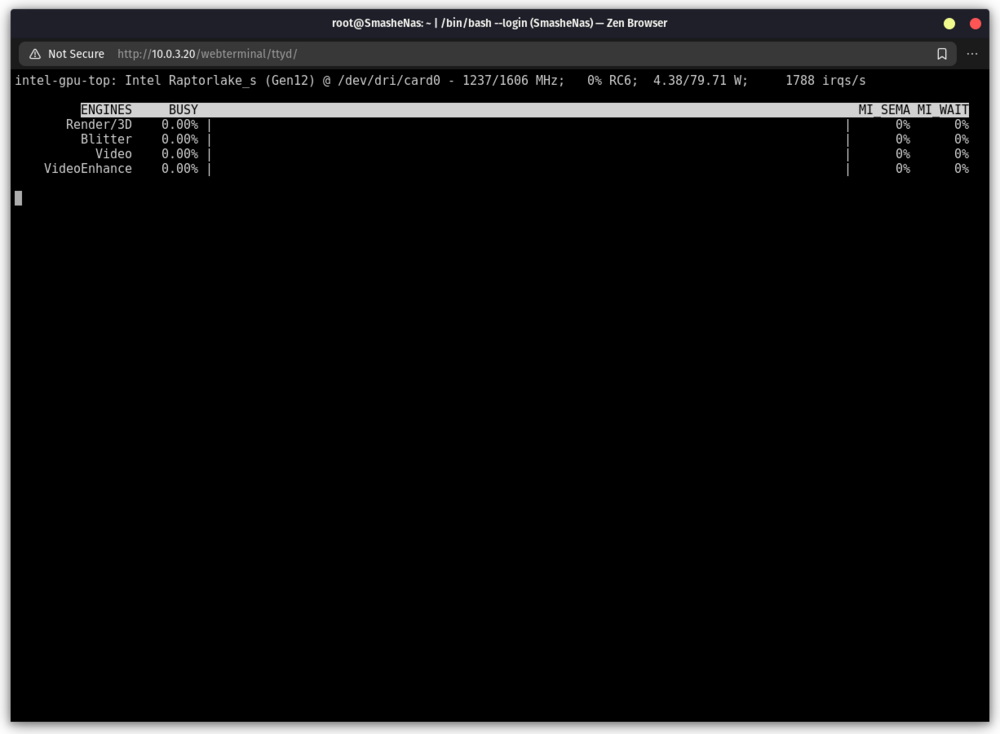
Im not sure if this is working or not. The top shows updates but nothing ever shows in the engines section while trans coding.
-
Thanks. Im back up now.
-
Hello. This stopped working for me so i uninstalled it and reinstalled and i still can not get it to work. I have the following in end of the logs. Let me know if there is anything else that is needed to help. Thanks for your time Unriaid 6.12.9 usage: main.py [-h] [--listen [IP]] [--port PORT] [--tls-keyfile TLS_KEYFILE] [--tls-certfile TLS_CERTFILE] [--enable-cors-header [ORIGIN]] [--max-upload-size MAX_UPLOAD_SIZE] [--extra-model-paths-config PATH [PATH ...]] [--output-directory OUTPUT_DIRECTORY] [--temp-directory TEMP_DIRECTORY] [--input-directory INPUT_DIRECTORY] [--auto-launch] [--disable-auto-launch] [--cuda-device DEVICE_ID] [--cuda-malloc | --disable-cuda-malloc] [--force-fp32 | --force-fp16] [--bf16-unet | --fp16-unet | --fp8_e4m3fn-unet | --fp8_e5m2-unet] [--fp16-vae | --fp32-vae | --bf16-vae] [--cpu-vae] [--fp8_e4m3fn-text-enc | --fp8_e5m2-text-enc | --fp16-text-enc | --fp32-text-enc] [--force-channels-last] [--directml [DIRECTML_DEVICE]] [--disable-ipex-optimize] [--preview-method [none,auto,latent2rgb,taesd]] [--preview-size PREVIEW_SIZE] [--cache-classic | --cache-lru CACHE_LRU] [--use-split-cross-attention | --use-quad-cross-attention | --use-pytorch-cross-attention] [--disable-xformers] [--force-upcast-attention | --dont-upcast-attention] [--gpu-only | --highvram | --normalvram | --lowvram | --novram | --cpu] [--reserve-vram RESERVE_VRAM] [--default-hashing-function {md5,sha1,sha256,sha512}] [--disable-smart-memory] [--deterministic] [--fast] [--dont-print-server] [--quick-test-for-ci] [--windows-standalone-build] [--disable-metadata] [--disable-all-custom-nodes] [--multi-user] [--verbose [{DEBUG,INFO,WARNING,ERROR,CRITICAL}]] [--front-end-version FRONT_END_VERSION] [--front-end-root FRONT_END_ROOT] [--user-directory USER_DIRECTORY] main.py: error: unrecognized arguments: --base-directory /basedir Requirement already satisfied: safetensors>=0.4.1 in /comfy/mnt/venv/lib/python3.10/site-packages (from transformers->-r /basedir/custom_nodes/ComfyUI-Manager/requirements.txt (line 4)) (0.5.2) Requirement already satisfied: tqdm>=4.27 in /comfy/mnt/venv/lib/python3.10/site-packages (from transformers->-r /basedir/custom_nodes/ComfyUI-Manager/requirements.txt (line 4)) (4.67.1) Requirement already satisfied: fsspec>=2023.5.0 in /comfy/mnt/venv/lib/python3.10/site-packages (from huggingface-hub>0.20->-r /basedir/custom_nodes/ComfyUI-Manager/requirements.txt (line 5)) (2025.2.0) Requirement already satisfied: click>=8.0.0 in /comfy/mnt/venv/lib/python3.10/site-packages (from typer->-r /basedir/custom_nodes/ComfyUI-Manager/requirements.txt (line 6)) (8.1.8) Requirement already satisfied: shellingham>=1.3.0 in /comfy/mnt/venv/lib/python3.10/site-packages (from typer->-r /basedir/custom_nodes/ComfyUI-Manager/requirements.txt (line 6)) (1.5.4) Requirement already satisfied: markdown-it-py>=2.2.0 in /comfy/mnt/venv/lib/python3.10/site-packages (from rich->-r /basedir/custom_nodes/ComfyUI-Manager/requirements.txt (line 7)) (3.0.0) Requirement already satisfied: pygments<3.0.0,>=2.13.0 in /comfy/mnt/venv/lib/python3.10/site-packages (from rich->-r /basedir/custom_nodes/ComfyUI-Manager/requirements.txt (line 7)) (2.19.1) Requirement already satisfied: smmap<6,>=3.0.1 in /comfy/mnt/venv/lib/python3.10/site-packages (from gitdb<5,>=4.0.1->GitPython->-r /basedir/custom_nodes/ComfyUI-Manager/requirements.txt (line 1)) (5.0.2) Requirement already satisfied: mdurl~=0.1 in /comfy/mnt/venv/lib/python3.10/site-packages (from markdown-it-py>=2.2.0->rich->-r /basedir/custom_nodes/ComfyUI-Manager/requirements.txt (line 7)) (0.1.2) Requirement already satisfied: cryptography>=3.4.0 in /comfy/mnt/venv/lib/python3.10/site-packages (from pyjwt[crypto]>=2.4.0->PyGithub->-r /basedir/custom_nodes/ComfyUI-Manager/requirements.txt (line 2)) (44.0.1) Requirement already satisfied: cffi>=1.4.1 in /comfy/mnt/venv/lib/python3.10/site-packages (from pynacl>=1.4.0->PyGithub->-r /basedir/custom_nodes/ComfyUI-Manager/requirements.txt (line 2)) (1.17.1) Requirement already satisfied: charset-normalizer<4,>=2 in /comfy/mnt/venv/lib/python3.10/site-packages (from requests~=2.22->matrix-client==0.4.0->-r /basedir/custom_nodes/ComfyUI-Manager/requirements.txt (line 3)) (3.4.1) Requirement already satisfied: idna<4,>=2.5 in /comfy/mnt/venv/lib/python3.10/site-packages (from requests~=2.22->matrix-client==0.4.0->-r /basedir/custom_nodes/ComfyUI-Manager/requirements.txt (line 3)) (3.10) Requirement already satisfied: certifi>=2017.4.17 in /comfy/mnt/venv/lib/python3.10/site-packages (from requests~=2.22->matrix-client==0.4.0->-r /basedir/custom_nodes/ComfyUI-Manager/requirements.txt (line 3)) (2025.1.31) Requirement already satisfied: wrapt<2,>=1.10 in /comfy/mnt/venv/lib/python3.10/site-packages (from Deprecated->PyGithub->-r /basedir/custom_nodes/ComfyUI-Manager/requirements.txt (line 2)) (1.17.2) Requirement already satisfied: pycparser in /comfy/mnt/venv/lib/python3.10/site-packages (from cffi>=1.4.1->pynacl>=1.4.0->PyGithub->-r /basedir/custom_nodes/ComfyUI-Manager/requirements.txt (line 2)) (2.22) == ComfyUI-Manager /comfy/mnt/ComfyUI/custom_nodes/ComfyUI-Manager/config.ini file missing, script potentially never run before. You will need to run ComfyUI-Manager a first time for the configuration file to be generated, we can not attempt to update its security level yet -- if this keeps occurring, please let the developer know so he can investigate. Thank you == Skipping ComfyUI-Manager CLI fix as we are re-using the same venv as the last execution -- If you are experiencing issues with custom nodes, use 'Manager -> Custom Nodes Manager -> Filter: Import Failed -> Try Fix' from the WebUI == Setting base_directory: /basedir ++ Logic to move content from ComfyUI directories to the new base_directory -- /comfy/mnt/ComfyUI/models not found, /basedir/models exists, skipping -- Both /comfy/mnt/ComfyUI/input (in) and /basedir/input (out) exist, skipping move. FYI attempting to list files in 'in' that are not in 'out' (empty means no differences): -- /comfy/mnt/ComfyUI/output not found, /basedir/output exists, skipping -- /comfy/mnt/ComfyUI/temp not found, /basedir/temp exists, skipping -- /comfy/mnt/ComfyUI/user not found, /basedir/user exists, skipping -- /comfy/mnt/ComfyUI/custom_nodes not found, /basedir/custom_nodes exists, skipping == Checking models directory -- /basedir/models/checkpoints already exists, skipping -- /basedir/models/loras already exists, skipping -- /basedir/models/vae already exists, skipping -- /basedir/models/configs already exists, skipping -- /basedir/models/clip_vision already exists, skipping -- /basedir/models/style_models already exists, skipping -- /basedir/models/diffusers already exists, skipping -- /basedir/models/vae_approx already exists, skipping -- /basedir/models/gligen already exists, skipping -- /basedir/models/upscale_models already exists, skipping -- /basedir/models/embeddings already exists, skipping -- /basedir/models/hypernetworks already exists, skipping -- /basedir/models/photomaker already exists, skipping -- /basedir/models/classifiers already exists, skipping !! COMFY_CMDLINE_EXTRA extended, make sure to use it in user script (if any): --base-directory /basedir == Container directory: /comfy/mnt/ComfyUI == Checking for user script: /comfy/mnt/user_script.bash =================== == Running ComfyUI -- Command line run: python3 ./main.py --listen 0.0.0.0 --disable-auto-launch --base-directory /basedir !! ERROR: ComfyUI failed or exited with an error !! Exiting script (ID: 1) ** Press ANY KEY to close this window **
-
Hello, I am having trouble booting the vm after trying to pass through the 3090. I updated tools > System Devices and checked the VGA and audio device and rebooted. VFIO-PCI log Loading config from /boot/config/vfio-pci.cfg BIND=0000:01:00.0|10de:2204 0000:01:00.1|10de:1aef--- Processing 0000:01:00.0 10de:2204 Vendor:Device 10de:2204 found at 0000:01:00.0 IOMMU group members (sans bridges): /sys/bus/pci/devices/0000:01:00.0/iommu_group/devices/0000:01:00.0 /sys/bus/pci/devices/0000:01:00.0/iommu_group/devices/0000:01:00.1 Binding... success... Device 10de:2204 at 0000:01:00.0 bound to vfio-pci --- Processing 0000:01:00.1 10de:1aef Vendor:Device 10de:1aef found at 0000:01:00.1 IOMMU group members (sans bridges): /sys/bus/pci/devices/0000:01:00.1/iommu_group/devices/0000:01:00.0 /sys/bus/pci/devices/0000:01:00.1/iommu_group/devices/0000:01:00.1 Binding... 0000:01:00.0 already bound to vfio-pci 0000:01:00.1 already bound to vfio-pci success... Device 10de:1aef at 0000:01:00.1 bound to vfio-pci --- Devices listed in /sys/bus/pci/drivers/vfio-pci: lrwxrwxrwx 1 root root 0 Dec 13 12:37 0000:01:00.0 -> ../../../../devices/pci0000:00/0000:00:01.0/0000:01:00.0 lrwxrwxrwx 1 root root 0 Dec 13 12:37 0000:01:00.1 -> ../../../../devices/pci0000:00/0000:00:01.0/0000:01:00.1 vfio-pci binding complete I created the server using virtual graphics card and it boots. Here is the xml <?xml version='1.0' encoding='UTF-8'?> <domain type='kvm'> <name>Ubuntu AI</name> <uuid>b1a727ab-9cc2-5802-7412-4db99d350cef</uuid> <metadata> <vmtemplate xmlns="unraid" name="Ubuntu" icon="ubuntu.png" os="ubuntu"/> </metadata> <memory unit='KiB'>16777216</memory> <currentMemory unit='KiB'>16777216</currentMemory> <memoryBacking> <nosharepages/> </memoryBacking> <vcpu placement='static'>7</vcpu> <cputune> <vcpupin vcpu='0' cpuset='12'/> <vcpupin vcpu='1' cpuset='13'/> <vcpupin vcpu='2' cpuset='14'/> <vcpupin vcpu='3' cpuset='16'/> <vcpupin vcpu='4' cpuset='17'/> <vcpupin vcpu='5' cpuset='18'/> <vcpupin vcpu='6' cpuset='19'/> </cputune> <os> <type arch='x86_64' machine='pc-q35-7.2'>hvm</type> <loader readonly='yes' type='pflash'>/usr/share/qemu/ovmf-x64/OVMF_CODE-pure-efi.fd</loader> <nvram>/etc/libvirt/qemu/nvram/b1a727ab-9cc2-5802-7412-4db99d350cef_VARS-pure-efi.fd</nvram> </os> <features> <acpi/> <apic/> </features> <cpu mode='host-passthrough' check='none' migratable='on'> <topology sockets='1' dies='1' cores='7' threads='1'/> <cache mode='passthrough'/> </cpu> <clock offset='utc'> <timer name='rtc' tickpolicy='catchup'/> <timer name='pit' tickpolicy='delay'/> <timer name='hpet' present='no'/> </clock> <on_poweroff>destroy</on_poweroff> <on_reboot>restart</on_reboot> <on_crash>restart</on_crash> <devices> <emulator>/usr/local/sbin/qemu</emulator> <disk type='file' device='disk'> <driver name='qemu' type='raw' cache='writeback'/> <source file='/mnt/user/domains/Ubuntu/vdisk1.img'/> <target dev='hdc' bus='virtio'/> <serial>vdisk1</serial> <boot order='1'/> <address type='pci' domain='0x0000' bus='0x03' slot='0x00' function='0x0'/> </disk> <controller type='sata' index='0'> <address type='pci' domain='0x0000' bus='0x00' slot='0x1f' function='0x2'/> </controller> <controller type='pci' index='0' model='pcie-root'/> <controller type='pci' index='1' model='pcie-root-port'> <model name='pcie-root-port'/> <target chassis='1' port='0x10'/> <address type='pci' domain='0x0000' bus='0x00' slot='0x02' function='0x0' multifunction='on'/> </controller> <controller type='pci' index='2' model='pcie-root-port'> <model name='pcie-root-port'/> <target chassis='2' port='0x11'/> <address type='pci' domain='0x0000' bus='0x00' slot='0x02' function='0x1'/> </controller> <controller type='pci' index='3' model='pcie-root-port'> <model name='pcie-root-port'/> <target chassis='3' port='0x12'/> <address type='pci' domain='0x0000' bus='0x00' slot='0x02' function='0x2'/> </controller> <controller type='pci' index='4' model='pcie-root-port'> <model name='pcie-root-port'/> <target chassis='4' port='0x13'/> <address type='pci' domain='0x0000' bus='0x00' slot='0x02' function='0x3'/> </controller> <controller type='pci' index='5' model='pcie-root-port'> <model name='pcie-root-port'/> <target chassis='5' port='0x14'/> <address type='pci' domain='0x0000' bus='0x00' slot='0x02' function='0x4'/> </controller> <controller type='virtio-serial' index='0'> <address type='pci' domain='0x0000' bus='0x02' slot='0x00' function='0x0'/> </controller> <controller type='usb' index='0' model='ich9-ehci1'> <address type='pci' domain='0x0000' bus='0x00' slot='0x07' function='0x7'/> </controller> <controller type='usb' index='0' model='ich9-uhci1'> <master startport='0'/> <address type='pci' domain='0x0000' bus='0x00' slot='0x07' function='0x0' multifunction='on'/> </controller> <controller type='usb' index='0' model='ich9-uhci2'> <master startport='2'/> <address type='pci' domain='0x0000' bus='0x00' slot='0x07' function='0x1'/> </controller> <controller type='usb' index='0' model='ich9-uhci3'> <master startport='4'/> <address type='pci' domain='0x0000' bus='0x00' slot='0x07' function='0x2'/> </controller> <interface type='bridge'> <mac address='52:54:00:84:c5:84'/> <source bridge='br0'/> <model type='virtio-net'/> <address type='pci' domain='0x0000' bus='0x01' slot='0x00' function='0x0'/> </interface> <serial type='pty'> <target type='isa-serial' port='0'> <model name='isa-serial'/> </target> </serial> <console type='pty'> <target type='serial' port='0'/> </console> <channel type='unix'> <target type='virtio' name='org.qemu.guest_agent.0'/> <address type='virtio-serial' controller='0' bus='0' port='1'/> </channel> <input type='tablet' bus='usb'> <address type='usb' bus='0' port='1'/> </input> <input type='mouse' bus='ps2'/> <input type='keyboard' bus='ps2'/> <graphics type='vnc' port='-1' autoport='yes' websocket='-1' listen='0.0.0.0' keymap='en-us'> <listen type='address' address='0.0.0.0'/> </graphics> <audio id='1' type='none'/> <video> <model type='qxl' ram='65536' vram='65536' vgamem='16384' heads='1' primary='yes'/> <address type='pci' domain='0x0000' bus='0x00' slot='0x01' function='0x0'/> </video> <memballoon model='virtio'> <address type='pci' domain='0x0000' bus='0x04' slot='0x00' function='0x0'/> </memballoon> </devices> </domain> I then changed the graphics card and sound card to the 3090. I start it and wait a bit for it to start and then try to ssh into it and it times out. Here is the xml <?xml version='1.0' encoding='UTF-8'?> <domain type='kvm' id='25'> <name>Ubuntu AI</name> <uuid>b1a727ab-9cc2-5802-7412-4db99d350cef</uuid> <metadata> <vmtemplate xmlns="unraid" name="Ubuntu" icon="ubuntu.png" os="ubuntu"/> </metadata> <memory unit='KiB'>16777216</memory> <currentMemory unit='KiB'>16777216</currentMemory> <memoryBacking> <nosharepages/> </memoryBacking> <vcpu placement='static'>7</vcpu> <cputune> <vcpupin vcpu='0' cpuset='12'/> <vcpupin vcpu='1' cpuset='13'/> <vcpupin vcpu='2' cpuset='14'/> <vcpupin vcpu='3' cpuset='16'/> <vcpupin vcpu='4' cpuset='17'/> <vcpupin vcpu='5' cpuset='18'/> <vcpupin vcpu='6' cpuset='19'/> </cputune> <resource> <partition>/machine</partition> </resource> <os> <type arch='x86_64' machine='pc-q35-7.2'>hvm</type> <loader readonly='yes' type='pflash'>/usr/share/qemu/ovmf-x64/OVMF_CODE-pure-efi.fd</loader> <nvram>/etc/libvirt/qemu/nvram/b1a727ab-9cc2-5802-7412-4db99d350cef_VARS-pure-efi.fd</nvram> </os> <features> <acpi/> <apic/> </features> <cpu mode='host-passthrough' check='none' migratable='on'> <topology sockets='1' dies='1' cores='7' threads='1'/> <cache mode='passthrough'/> </cpu> <clock offset='utc'> <timer name='rtc' tickpolicy='catchup'/> <timer name='pit' tickpolicy='delay'/> <timer name='hpet' present='no'/> </clock> <on_poweroff>destroy</on_poweroff> <on_reboot>restart</on_reboot> <on_crash>restart</on_crash> <devices> <emulator>/usr/local/sbin/qemu</emulator> <disk type='file' device='disk'> <driver name='qemu' type='raw' cache='writeback'/> <source file='/mnt/user/domains/Ubuntu/vdisk1.img' index='1'/> <backingStore/> <target dev='hdc' bus='virtio'/> <serial>vdisk1</serial> <boot order='1'/> <alias name='virtio-disk2'/> <address type='pci' domain='0x0000' bus='0x03' slot='0x00' function='0x0'/> </disk> <controller type='usb' index='0' model='ich9-ehci1'> <alias name='usb'/> <address type='pci' domain='0x0000' bus='0x00' slot='0x07' function='0x7'/> </controller> <controller type='usb' index='0' model='ich9-uhci1'> <alias name='usb'/> <master startport='0'/> <address type='pci' domain='0x0000' bus='0x00' slot='0x07' function='0x0' multifunction='on'/> </controller> <controller type='usb' index='0' model='ich9-uhci2'> <alias name='usb'/> <master startport='2'/> <address type='pci' domain='0x0000' bus='0x00' slot='0x07' function='0x1' multifunction='on'/> </controller> <controller type='usb' index='0' model='ich9-uhci3'> <alias name='usb'/> <master startport='4'/> <address type='pci' domain='0x0000' bus='0x00' slot='0x07' function='0x2'/> </controller> <controller type='pci' index='3' model='pcie-root-port'> <model name='pcie-root-port'/> <target chassis='3' port='0x12'/> <alias name='pci.3'/> <address type='pci' domain='0x0000' bus='0x00' slot='0x02' function='0x2'/> </controller> <controller type='pci' index='4' model='pcie-root-port'> <model name='pcie-root-port'/> <target chassis='4' port='0x13'/> <alias name='pci.4'/> <address type='pci' domain='0x0000' bus='0x00' slot='0x02' function='0x3'/> </controller> <controller type='pci' index='5' model='pcie-root-port'> <model name='pcie-root-port'/> <target chassis='5' port='0x14'/> <alias name='pci.5'/> <address type='pci' domain='0x0000' bus='0x00' slot='0x02' function='0x4'/> </controller> <controller type='virtio-serial' index='0'> <alias name='virtio-serial0'/> <address type='pci' domain='0x0000' bus='0x02' slot='0x00' function='0x0'/> </controller> <controller type='sata' index='0'> <alias name='ide'/> <address type='pci' domain='0x0000' bus='0x00' slot='0x1f' function='0x2'/> </controller> <controller type='pci' index='0' model='pcie-root'> <alias name='pcie.0'/> </controller> <controller type='pci' index='1' model='pcie-root-port'> <model name='pcie-root-port'/> <target chassis='1' port='0x8'/> <alias name='pci.1'/> <address type='pci' domain='0x0000' bus='0x00' slot='0x01' function='0x0' multifunction='on'/> </controller> <controller type='pci' index='2' model='pcie-root-port'> <model name='pcie-root-port'/> <target chassis='2' port='0x9'/> <alias name='pci.2'/> <address type='pci' domain='0x0000' bus='0x00' slot='0x01' function='0x1'/> </controller> <interface type='bridge'> <mac address='52:54:00:84:c5:84'/> <source bridge='br0'/> <target dev='vnet24'/> <model type='virtio-net'/> <alias name='net0'/> <address type='pci' domain='0x0000' bus='0x01' slot='0x00' function='0x0'/> </interface> <serial type='pty'> <source path='/dev/pts/1'/> <target type='isa-serial' port='0'> <model name='isa-serial'/> </target> <alias name='serial0'/> </serial> <console type='pty' tty='/dev/pts/1'> <source path='/dev/pts/1'/> <target type='serial' port='0'/> <alias name='serial0'/> </console> <channel type='unix'> <source mode='bind' path='/var/lib/libvirt/qemu/channel/target/domain-25-Ubuntu AI/org.qemu.guest_agent.0'/> <target type='virtio' name='org.qemu.guest_agent.0' state='disconnected'/> <alias name='channel0'/> <address type='virtio-serial' controller='0' bus='0' port='1'/> </channel> <input type='tablet' bus='usb'> <alias name='input0'/> <address type='usb' bus='0' port='1'/> </input> <input type='mouse' bus='ps2'> <alias name='input1'/> </input> <input type='keyboard' bus='ps2'> <alias name='input2'/> </input> <audio id='1' type='none'/> <hostdev mode='subsystem' type='pci' managed='yes'> <driver name='vfio'/> <source> <address domain='0x0000' bus='0x01' slot='0x00' function='0x0'/> </source> <alias name='hostdev0'/> <address type='pci' domain='0x0000' bus='0x04' slot='0x00' function='0x0'/> </hostdev> <hostdev mode='subsystem' type='pci' managed='yes'> <driver name='vfio'/> <source> <address domain='0x0000' bus='0x01' slot='0x00' function='0x1'/> </source> <alias name='hostdev1'/> <address type='pci' domain='0x0000' bus='0x05' slot='0x00' function='0x0'/> </hostdev> <memballoon model='none'/> </devices> <seclabel type='dynamic' model='dac' relabel='yes'> <label>+0:+100</label> <imagelabel>+0:+100</imagelabel> </seclabel> </domain> I then force stop the server and remove the gpu and go back to the virtual and start with vnc. It says "Guest has not initialize the display (yet). and does not change. I waited 5 minutes. Here is the xml <?xml version='1.0' encoding='UTF-8'?> <domain type='kvm' id='26'> <name>Ubuntu AI</name> <uuid>b1a727ab-9cc2-5802-7412-4db99d350cef</uuid> <metadata> <vmtemplate xmlns="unraid" name="Ubuntu" icon="ubuntu.png" os="ubuntu"/> </metadata> <memory unit='KiB'>16777216</memory> <currentMemory unit='KiB'>16777216</currentMemory> <memoryBacking> <nosharepages/> </memoryBacking> <vcpu placement='static'>7</vcpu> <cputune> <vcpupin vcpu='0' cpuset='12'/> <vcpupin vcpu='1' cpuset='13'/> <vcpupin vcpu='2' cpuset='14'/> <vcpupin vcpu='3' cpuset='16'/> <vcpupin vcpu='4' cpuset='17'/> <vcpupin vcpu='5' cpuset='18'/> <vcpupin vcpu='6' cpuset='19'/> </cputune> <resource> <partition>/machine</partition> </resource> <os> <type arch='x86_64' machine='pc-q35-7.2'>hvm</type> <loader readonly='yes' type='pflash'>/usr/share/qemu/ovmf-x64/OVMF_CODE-pure-efi.fd</loader> <nvram>/etc/libvirt/qemu/nvram/b1a727ab-9cc2-5802-7412-4db99d350cef_VARS-pure-efi.fd</nvram> </os> <features> <acpi/> <apic/> </features> <cpu mode='host-passthrough' check='none' migratable='on'> <topology sockets='1' dies='1' cores='7' threads='1'/> <cache mode='passthrough'/> </cpu> <clock offset='utc'> <timer name='rtc' tickpolicy='catchup'/> <timer name='pit' tickpolicy='delay'/> <timer name='hpet' present='no'/> </clock> <on_poweroff>destroy</on_poweroff> <on_reboot>restart</on_reboot> <on_crash>restart</on_crash> <devices> <emulator>/usr/local/sbin/qemu</emulator> <disk type='file' device='disk'> <driver name='qemu' type='raw' cache='writeback'/> <source file='/mnt/user/domains/Ubuntu/vdisk1.img' index='1'/> <backingStore/> <target dev='hdc' bus='virtio'/> <serial>vdisk1</serial> <boot order='1'/> <alias name='virtio-disk2'/> <address type='pci' domain='0x0000' bus='0x04' slot='0x00' function='0x0'/> </disk> <controller type='pci' index='0' model='pcie-root'> <alias name='pcie.0'/> </controller> <controller type='pci' index='1' model='pcie-root-port'> <model name='pcie-root-port'/> <target chassis='1' port='0x8'/> <alias name='pci.1'/> <address type='pci' domain='0x0000' bus='0x00' slot='0x01' function='0x0' multifunction='on'/> </controller> <controller type='pci' index='2' model='pcie-root-port'> <model name='pcie-root-port'/> <target chassis='2' port='0x9'/> <alias name='pci.2'/> <address type='pci' domain='0x0000' bus='0x00' slot='0x01' function='0x1'/> </controller> <controller type='pci' index='3' model='pcie-root-port'> <model name='pcie-root-port'/> <target chassis='3' port='0x12'/> <alias name='pci.3'/> <address type='pci' domain='0x0000' bus='0x00' slot='0x02' function='0x2'/> </controller> <controller type='pci' index='4' model='pcie-root-port'> <model name='pcie-root-port'/> <target chassis='4' port='0x13'/> <alias name='pci.4'/> <address type='pci' domain='0x0000' bus='0x00' slot='0x02' function='0x3'/> </controller> <controller type='pci' index='5' model='pcie-root-port'> <model name='pcie-root-port'/> <target chassis='5' port='0x14'/> <alias name='pci.5'/> <address type='pci' domain='0x0000' bus='0x00' slot='0x02' function='0x4'/> </controller> <controller type='virtio-serial' index='0'> <alias name='virtio-serial0'/> <address type='pci' domain='0x0000' bus='0x02' slot='0x00' function='0x0'/> </controller> <controller type='sata' index='0'> <alias name='ide'/> <address type='pci' domain='0x0000' bus='0x00' slot='0x1f' function='0x2'/> </controller> <controller type='usb' index='0' model='ich9-ehci1'> <alias name='usb'/> <address type='pci' domain='0x0000' bus='0x00' slot='0x07' function='0x7'/> </controller> <controller type='usb' index='0' model='ich9-uhci1'> <alias name='usb'/> <master startport='0'/> <address type='pci' domain='0x0000' bus='0x00' slot='0x07' function='0x0' multifunction='on'/> </controller> <controller type='usb' index='0' model='ich9-uhci2'> <alias name='usb'/> <master startport='2'/> <address type='pci' domain='0x0000' bus='0x00' slot='0x07' function='0x1'/> </controller> <controller type='usb' index='0' model='ich9-uhci3'> <alias name='usb'/> <master startport='4'/> <address type='pci' domain='0x0000' bus='0x00' slot='0x07' function='0x2'/> </controller> <controller type='pci' index='6' model='pcie-root-port'> <model name='pcie-root-port'/> <target chassis='6' port='0xa'/> <alias name='pci.6'/> <address type='pci' domain='0x0000' bus='0x00' slot='0x01' function='0x2'/> </controller> <controller type='pci' index='7' model='pcie-to-pci-bridge'> <model name='pcie-pci-bridge'/> <alias name='pci.7'/> <address type='pci' domain='0x0000' bus='0x01' slot='0x00' function='0x0'/> </controller> <interface type='bridge'> <mac address='52:54:00:84:c5:84'/> <source bridge='br0'/> <target dev='vnet25'/> <model type='virtio-net'/> <alias name='net0'/> <address type='pci' domain='0x0000' bus='0x03' slot='0x00' function='0x0'/> </interface> <serial type='pty'> <source path='/dev/pts/1'/> <target type='isa-serial' port='0'> <model name='isa-serial'/> </target> <alias name='serial0'/> </serial> <console type='pty' tty='/dev/pts/1'> <source path='/dev/pts/1'/> <target type='serial' port='0'/> <alias name='serial0'/> </console> <channel type='unix'> <source mode='bind' path='/var/lib/libvirt/qemu/channel/target/domain-26-Ubuntu AI/org.qemu.guest_agent.0'/> <target type='virtio' name='org.qemu.guest_agent.0' state='disconnected'/> <alias name='channel0'/> <address type='virtio-serial' controller='0' bus='0' port='1'/> </channel> <input type='tablet' bus='usb'> <alias name='input0'/> <address type='usb' bus='0' port='1'/> </input> <input type='mouse' bus='ps2'> <alias name='input1'/> </input> <input type='keyboard' bus='ps2'> <alias name='input2'/> </input> <graphics type='vnc' port='5901' autoport='yes' websocket='5701' listen='0.0.0.0' keymap='en-us'> <listen type='address' address='0.0.0.0'/> </graphics> <audio id='1' type='none'/> <video> <model type='qxl' ram='65536' vram='65536' vgamem='16384' heads='1' primary='yes'/> <alias name='video0'/> <address type='pci' domain='0x0000' bus='0x07' slot='0x01' function='0x0'/> </video> <memballoon model='virtio'> <alias name='balloon0'/> <address type='pci' domain='0x0000' bus='0x05' slot='0x00' function='0x0'/> </memballoon> </devices> <seclabel type='dynamic' model='dac' relabel='yes'> <label>+0:+100</label> <imagelabel>+0:+100</imagelabel> </seclabel> </domain> If i then stop the vm and go back to the original xml the vm boots without issue. Any ideas.
-
@ich777 I reset the card and re plugged in the power cable. So far so good. I have had it running for over an hour trans-coding a couple videos with no issue. The only thing i have now is the gpu stats is no longer showing the power consumption but as long as its not crashing Im good to go.
-
I have not I will try that Corsair RM850x Yes i can move it to my windows machine if reseating it does not work Will let you know the results. Thanks
-
Just happened again. Attached are the diagnostics smashenas-diagnostics-20230707-2045.zip
-
OS: 6.11.4 Driver Version: Latest: v535.54.03 I have been using the same set up for a long time without an issue. The past 3 days i have had an issue twice where my GPU (1070) fans start going at full blast. I look at the server and the gpu is no longer visible. I looked at the logs and it showed that it crashed. I i thought i saved a copy of the system log but i did not, but i do have the gpu logs which i will attach. The fist time I had used the gpu to trans-code a tv show earlier in the night. Today the GPU was doing nothing and had not done anything for a couple of days (since the last time this happened.). I have to reboot to get it to fix. I have space invader ones nvidia power save and nvidia power save hourly script installed. The last time it it happened it happened around x:45 so if the every hour is on the hour this would not have ran. They have been installed since i set up the server. nvidia-bug-report.log.gz
-
Is there a way to tie a vm to an IP for VNC connections so instead of using serverip:portnumber you would just use an ip address. I would like to do this for local dns records/firewall rules. Thanks
-
Apps > NerdTools After that is installed Settings > nerdtools you can install it from there.
-
Ya my tv and player supports DV (lg oled/apple tv 4k) but plex is having an issue with it (some licensing thing i guess). This is one issue that i guess my tester that i was looking for would not fix since the file is valid but plex is not playing it. If there is a tester to validate videos it would still be nice to have. It might not fix this issue but it would be good to test all downloaded videos to make sure that they are not corrupted. Thanks for your time.
-
I did not because what i am looking for would have nothing to do with plex. It would be between radar and plex.
-
I have an HDR 4ktv
-
Is there an app that can validate a show/movie after it is downloaded so that it will be known to play? I am getting color space is not supported from plex sometimes (along with other unable to play issues) and am looking for a solution to know that this is going to happen before it happens for a user. Its not a huge deal if it happens to me but is a problem when it happens for someone else.
-
I had it set to 70% so it would start moving before it was full to account for that. I have since changed out my cache drive for a bigger one today so it won't be such an issue, but it would be a nice feature and one that I thought the plugin already did.
-
Ok. I must have misunderstood what it did. I was trying to have something that would start the mover if i went crazy with the downloads and the cache drive filled up before the scheduled task fired. that would be very helpful if it could be added. Thanks for your help
-
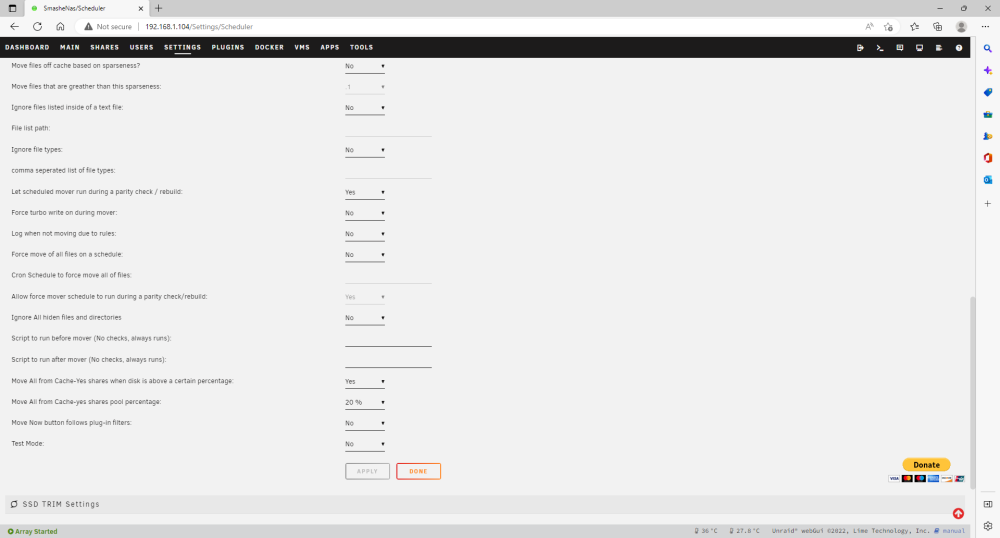
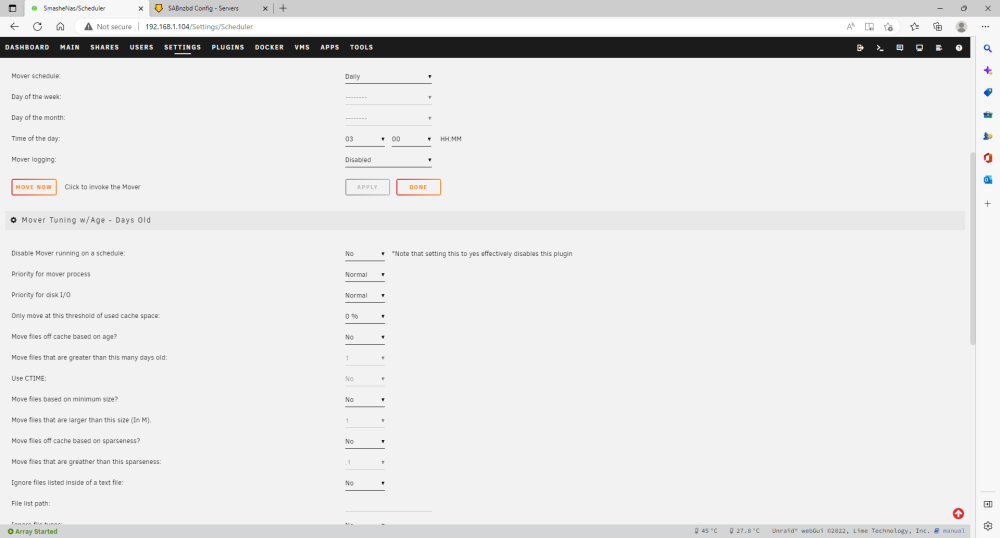
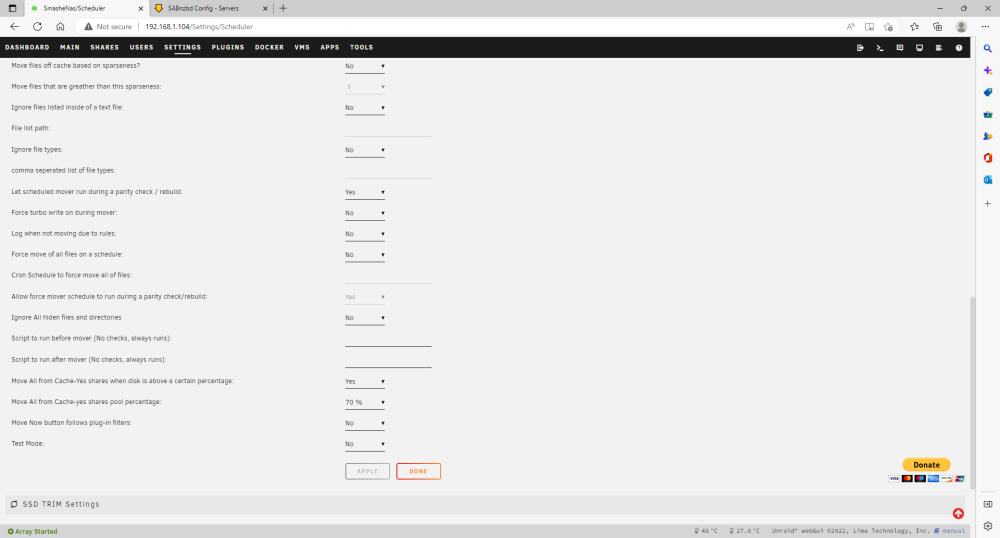
@hugenbddwhat is the Move All from Cache-yes shares pool percentage for then? Does it not start the mover once the drive gets to a certain percentage full?
-
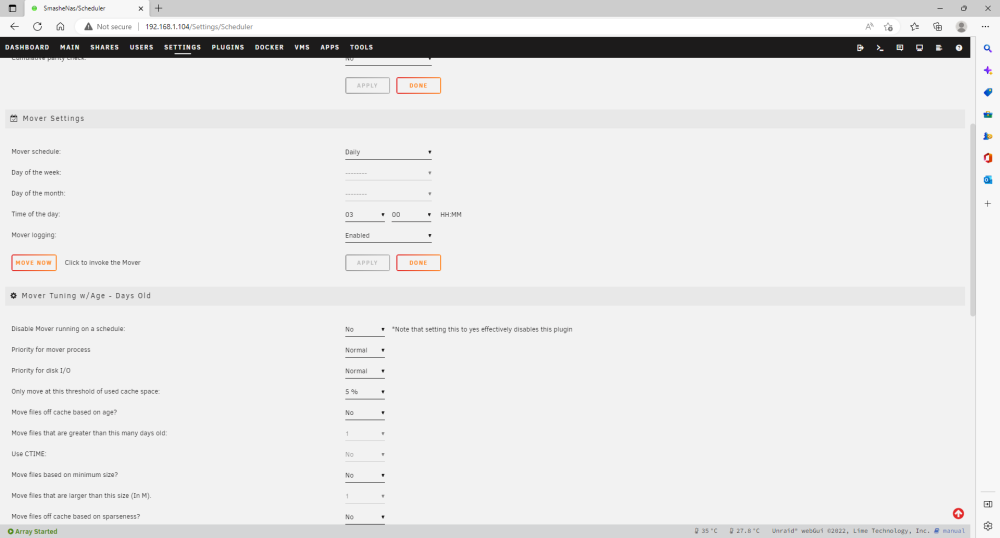
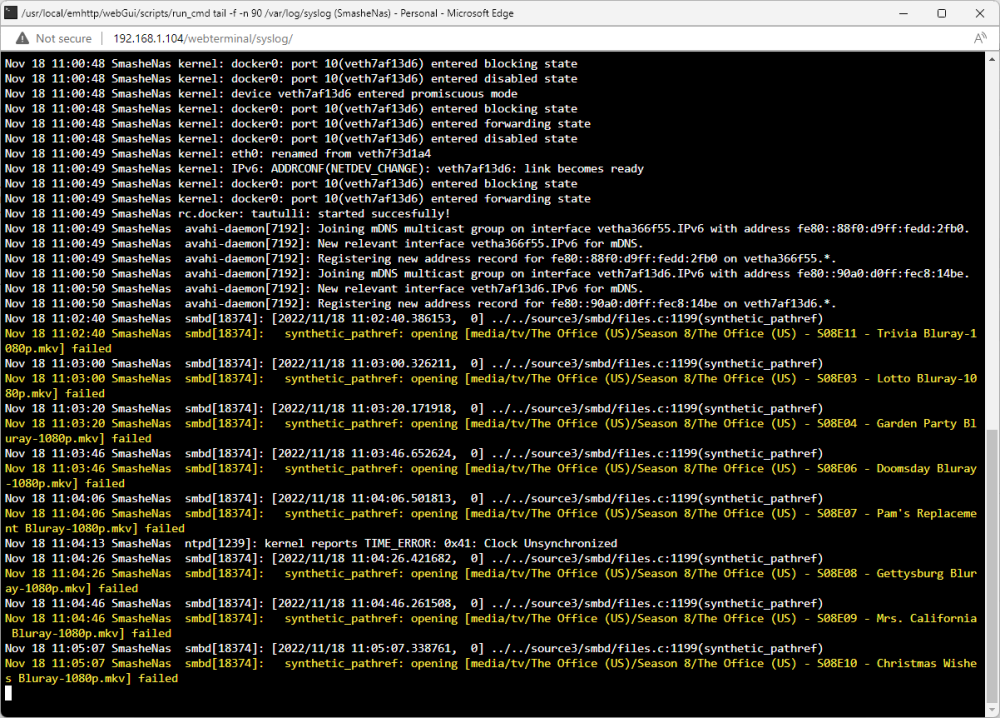
@hugenbdd I updated the only move threshold to 5% and the move all from cache percentage to 20% so it will run faster. I also turned on the logs. It still does not run and nothing about the mover is shown in the logs.
-
Thanks @hugenbdd. I clicked the mover button by accident. Once this is done running, I will try your suggestions and let you know.
-
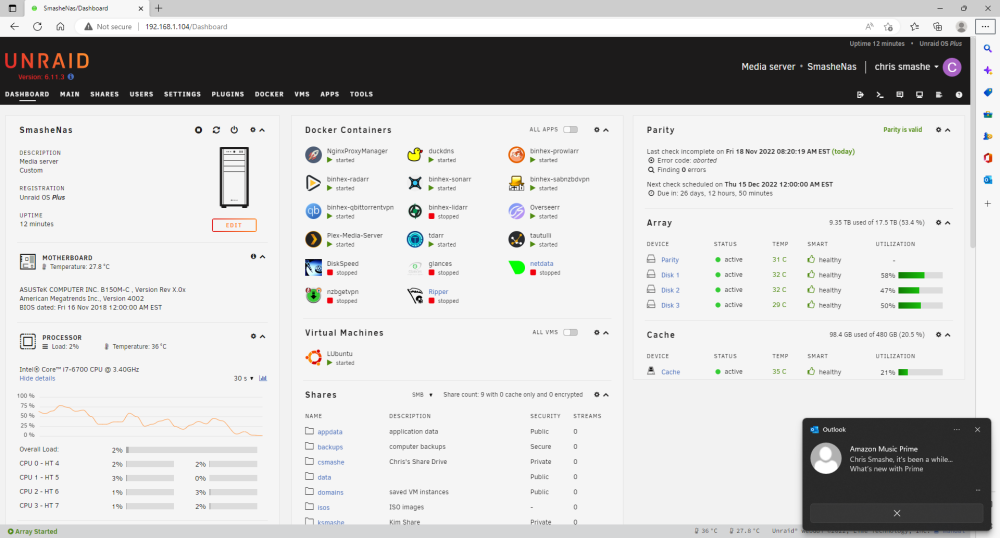
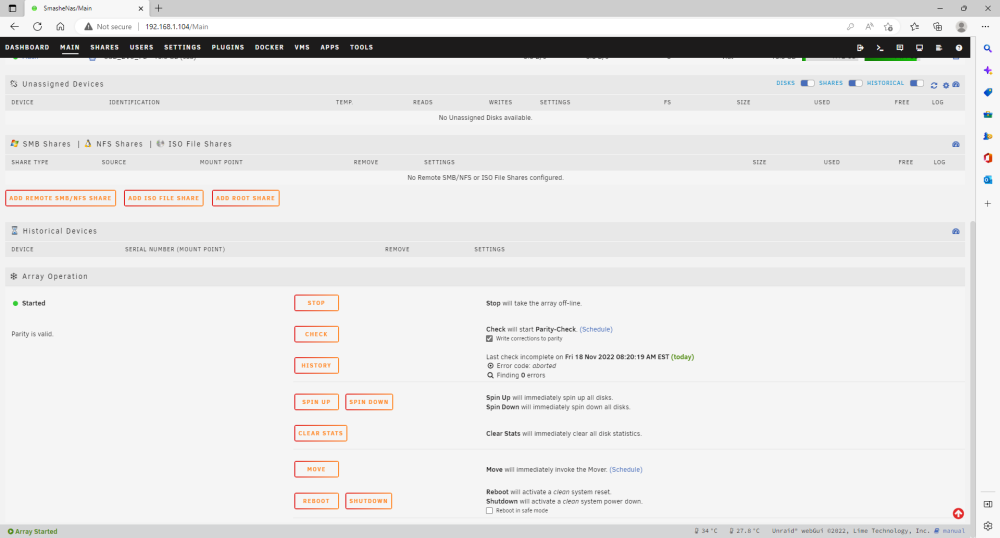
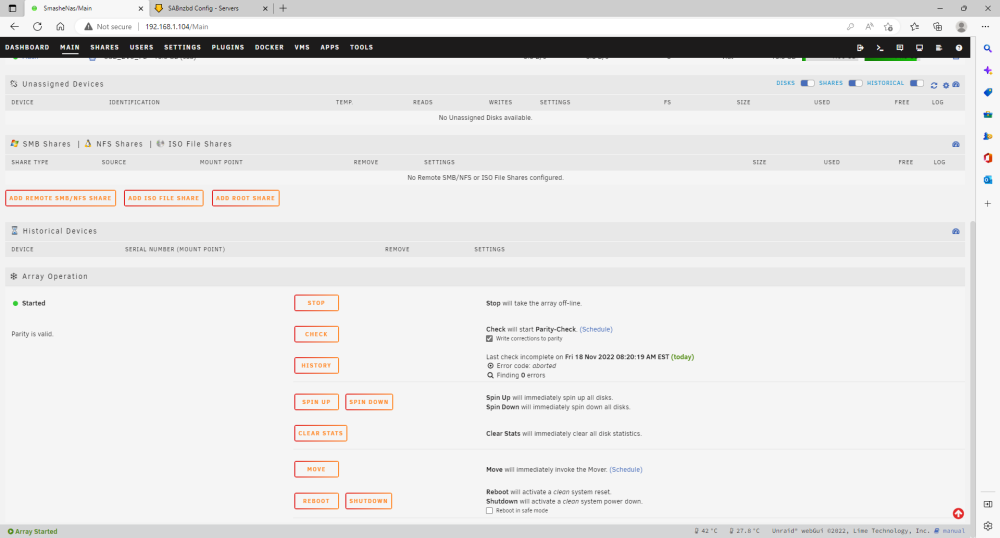
My move when the drive gets to a certain percentage is no longer working. I am pretty sure it used to work but now i am unable to get it to fire. My settings are below I have it set so when it gets to 70% run mover but I am at 70% (and i have tried higher) and mover does not start Any ideas? Thanks
-
open up a terminal and type cd /mnt/cache then du | sort -n the largest files/folders should be at the bottom. With that you can make a better determination what is taking up all of your space.
-
You're comparing apples to oranges. To lower power to the same as your examples of low power machines you need to Get rid of most of your ram. The mini has 8gb, the nas has 4. Remove most of your hard drives. The mini has one ssd and the nas most likely does not take the hard drives into account for their numbers since it does not come with the drives. Remove your sas controller. Neither of your examples have one. And lastly remove your 10gb nic and go back to using the one built into your mother board. 10gb is going to use more power than 1gb and you are most likely still powering your onboard one. You can get less power use but you will have to remove items and/or replace them with more power efficient items. You're probably best to only power on the server when you are going to use it or look into adding renewable energy sources to your house if you can. If you are going to start replacing hardware you need to figure out how long of paying less in power bills it will take to offset what it cost you to buy the new hardware if that is the only reason you are getting the new hardware.
-
I still have some 30% io wait but its no longer hanging my machine. I hope it helps you figure it out.
-
You could have an iowait issue like i had.


