


Sabot
Members
-
Joined
-
Last visited
-
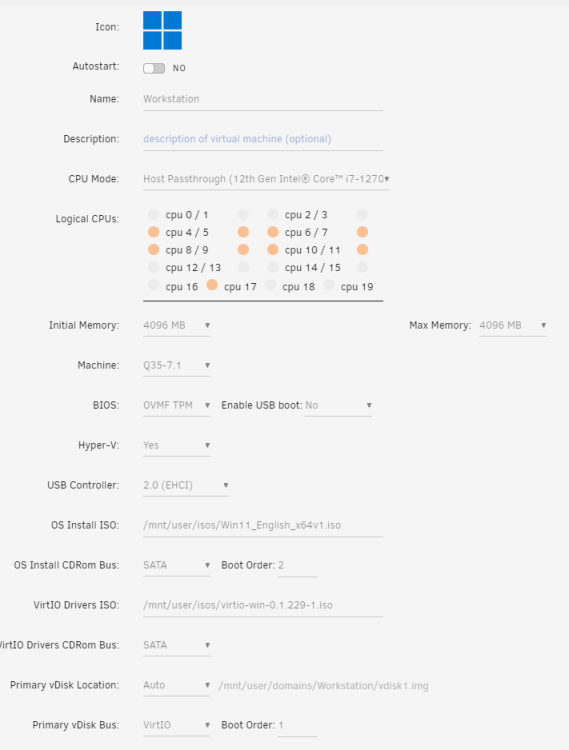
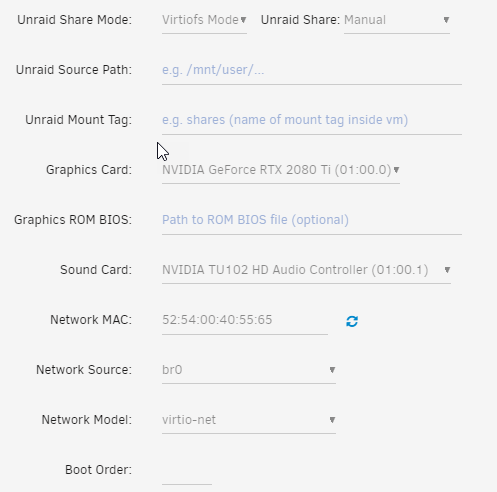
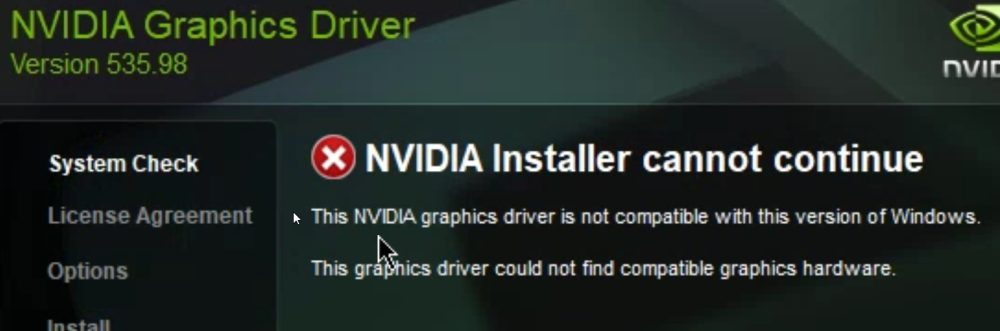
Good day, Thank you for your time! I would like to use a monitor with my VM. I have been trying to figure out how to pass through my old GPU 2080TI. The test VM is called workstation. I am able to remote in to the VM but windows acts very strange. I can repeat the issue when I right click on the desktop and click display nothing happens. The popup box stays on top until I restart the VM. On occassion I can't open anything. I restart the VM and server. I uninstall the VM and reinstall. The VM runs fine when I don't try to pass through the GPU. One I select the GPU, the VM goes crazy. After many installs, I am at least able to try to install the graphic driver but it fails. "driver is not compatible". I am getting close. On my blueiris VM, I changed the graphic setting to my GPU. It will start but I can't remote into it. I know that windows is not running for I have the blueiris setup to run as a service and it is not sending notificaitons. When I return the graphic setting back to VNC, I still can't remote into it. I included my VM edit to show my CPU pinning and settings. The system log is also attached. Any suggestions? unraid-diagnostics-20230611-1015.zip
-
That fixed it! Many thanks.
-
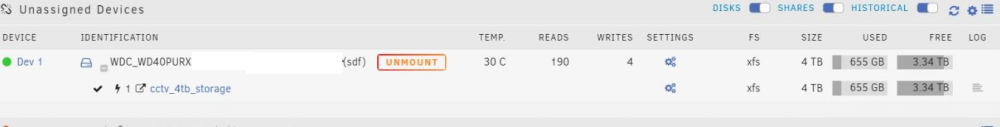
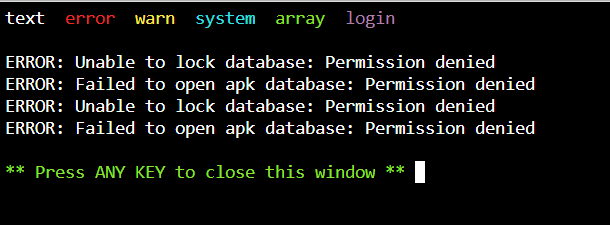
unraid-diagnostics-20230608-1108.zipGreetings all! Thank you for taking your time to read my post. I noticed a few days ago that my Windows 11 VM lost connection with a shared drive that I have on my UnRaid server. I have not touched the server or the VM for the last three months. Here is what I did so far: - Restarted the Windows VM - On another computer, checked to see if the shared disk is visable. (It was not) - Check the Drive SMART report (No issues) - Applied updates to the UnRaid server - Restarted the UnRaid server - Unmounted and Mounted the disk in question - Restarted the Windows VM - I can access the drive from the Unraid Main tab (/disk/(the shared disk in question) Here is the disk log from the drive in question. I don't know if it can be of any help: Disk Log Info Jun 7 17:04:23 Unraid kernel: ata13: SATA max UDMA/133 abar m8192@0x48082000 port 0x48082280 irq 189 Jun 7 17:04:23 Unraid kernel: ata13: SATA link up 6.0 Gbps (SStatus 133 SControl 300) Jun 7 17:04:23 Unraid kernel: ata13.00: ATA-10: WDC WD40PURX-64N96Y0, 80.00A80, max UDMA/133 Jun 7 17:04:23 Unraid kernel: ata13.00: 7814037168 sectors, multi 16: LBA48 NCQ (depth 32), AA Jun 7 17:04:23 Unraid kernel: ata13.00: configured for UDMA/133 Jun 7 17:04:23 Unraid kernel: sd 13:0:0:0: [sdf] 7814037168 512-byte logical blocks: (4.00 TB/3.64 TiB) Jun 7 17:04:23 Unraid kernel: sd 13:0:0:0: [sdf] 4096-byte physical blocks Jun 7 17:04:23 Unraid kernel: sd 13:0:0:0: [sdf] Write Protect is off Jun 7 17:04:23 Unraid kernel: sd 13:0:0:0: [sdf] Mode Sense: 00 3a 00 00 Jun 7 17:04:23 Unraid kernel: sd 13:0:0:0: [sdf] Write cache: enabled, read cache: enabled, doesn't support DPO or FUA Jun 7 17:04:23 Unraid kernel: sd 13:0:0:0: [sdf] Preferred minimum I/O size 4096 bytes Jun 7 17:04:23 Unraid kernel: sdf: sdf1 Jun 7 17:04:23 Unraid kernel: sd 13:0:0:0: [sdf] Attached SCSI disk Jun 7 17:04:52 Unraid emhttpd: WDC_WD40PURX-64N96Y0_WD-WCC7K5XY1J58 (sdf) 512 7814037168 Jun 7 17:04:53 Unraid emhttpd: read SMART /dev/sdf Jun 7 17:05:06 Unraid unassigned.devices: Mounting partition 'sdf1' at mountpoint '/mnt/disks/cctv_4tb_storage'... Jun 7 17:05:06 Unraid unassigned.devices: Mount cmd: /sbin/mount -t 'xfs' -o rw,noatime,nodiratime '/dev/sdf1' '/mnt/disks/cctv_4tb_storage' Jun 7 17:05:06 Unraid kernel: XFS (sdf1): Mounting V5 Filesystem Jun 7 17:05:06 Unraid kernel: XFS (sdf1): Ending clean mount Jun 7 17:05:06 Unraid unassigned.devices: Successfully mounted 'sdf1' on '/mnt/disks/cctv_4tb_storage'. ** Press ANY KEY to close this window ** Suggestions? Thank you for your time! Mike unraid-diagnostics-20230608-1108.zip

-
Greetings all! Thank you for taking your time to read my post. I noticed a few days ago that my Windows 11 VM lost connection with a shared drive that I have on my UnRaid server. I have not touched the server or the VM for the last three months. Here is what I did so far: - Restarted the Windows VM - On another computer, checked to see if the shared disk is visable. (It was not) - Check the Drive SMART report (No issues) - Applied updates to the UnRaid server - Restarted the UnRaid server - Unmounted and Mounted the disk in question - Restarted the Windows VM - I can access the drive from the Unraid Main tab (/disk/(the shared disk in question) Suggestions? Thank you for your time! Mike


-
Figures... right after posting I find this thread... Posting it here just in case someone stumbles across this thread:
-
I am looking to replace my old UPS and would like one that would communicate with my Unraid server. I am looking at APC for just this reason. Question, is there a docker or app that will allow me to run the APC software from Unraid?
-
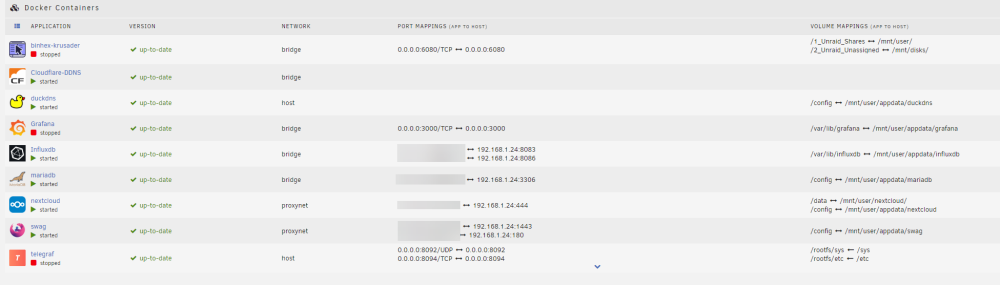
Solved the InfluxDB. Status Code: 401 by changing the repository: influxdb:1.8.4-alpine What a journey this has been... Key is not to give up. Keep searching this thread, and Reddit for clues. A big thank you for the gents who created this and the gents who did the guides.
-
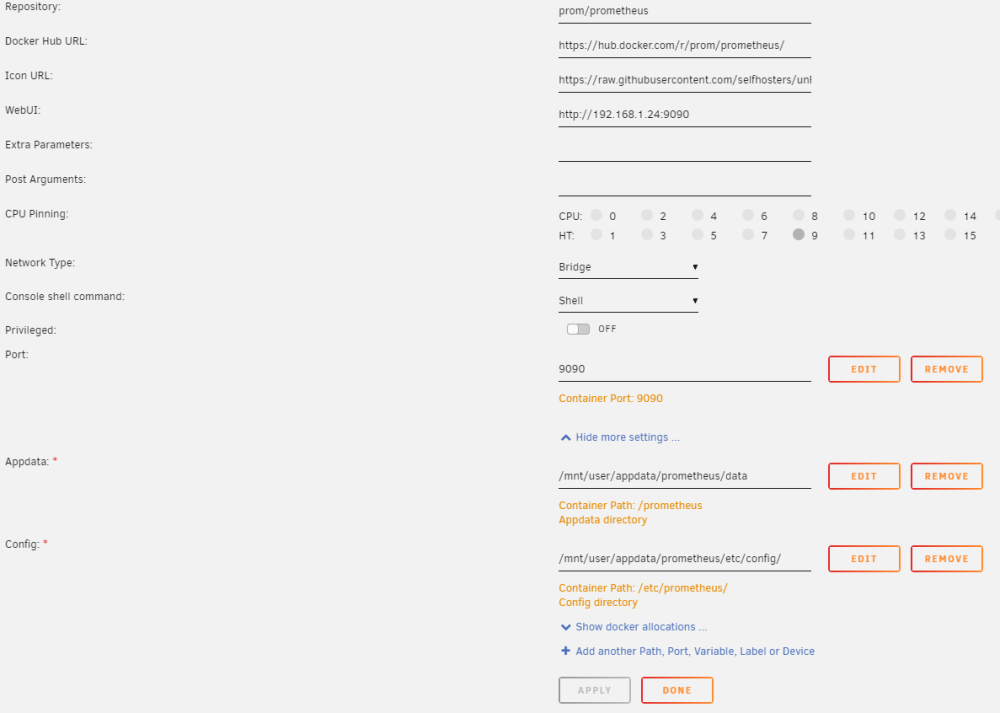
Greetings all, I installed the Prometheus docker today. I can't get it to start. Any suggestions? Did I setup the container correctly? How does the .yml file look? I put the .yml file in the /etc/config folder. Is there anything else that I may have missed? I created a prometheus.yml file by using a valid example file can be found here:https://github.com/prometheus/prometheus/blob/release-2.38/config/testdata/conf.good.yml Log file: goroutine 1 [running]: github.com/prometheus/prometheus/promql.NewActiveQueryTracker({0x7ffcd6c41ead, 0xb}, 0x14, {0x3958c60, 0xc000e86370}) /app/promql/query_logger.go:121 +0x3d5 main.main() /app/cmd/prometheus/main.go:597 +0x64df ts=2022-09-26T00:31:35.390Z caller=main.go:491 level=info msg="No time or size retention was set so using the default time retention" duration=15d ts=2022-09-26T00:31:35.390Z caller=main.go:535 level=info msg="Starting Prometheus Server" mode=server version="(version=2.37.1, branch=HEAD, revision=1ce2197e7f9e95089bfb95cb61762b5a89a8c0da)" ts=2022-09-26T00:31:35.390Z caller=main.go:540 level=info build_context="(go=go1.18.6, user=root@3caaaea7ba87, date=20220912-12:42:39)" ts=2022-09-26T00:31:35.390Z caller=main.go:541 level=info host_details="(Linux 5.19.9-Unraid #1 SMP PREEMPT_DYNAMIC Fri Sep 23 07:24:37 PDT 2022 x86_64 36bee1b7b985 (none))" ts=2022-09-26T00:31:35.390Z caller=main.go:542 level=info fd_limits="(soft=40960, hard=40960)" ts=2022-09-26T00:31:35.390Z caller=main.go:543 level=info vm_limits="(soft=unlimited, hard=unlimited)" ts=2022-09-26T00:31:35.390Z caller=query_logger.go:91 level=error component=activeQueryTracker msg="Error opening query log file" file=/prometheus/queries.active err="open /prometheus/queries.active: permission denied" panic: Unable to create mmap-ed active query log goroutine 1 [running]: github.com/prometheus/prometheus/promql.NewActiveQueryTracker({0x7ffdc5ae4ead, 0xb}, 0x14, {0x3958c60, 0xc000c83950}) /app/promql/query_logger.go:121 +0x3d5 main.main() /app/cmd/prometheus/main.go:597 +0x64df prometheus.yml
-
I found another example of the config file skaterpunk which allows the Telegraf to stay up and running. https://github.com/skaterpunk/UUD A new issue when trying to setup Grafana's Influxdb: error reading InfluxDB. Status Code: 401 Quick search states this is a permission issue.
-
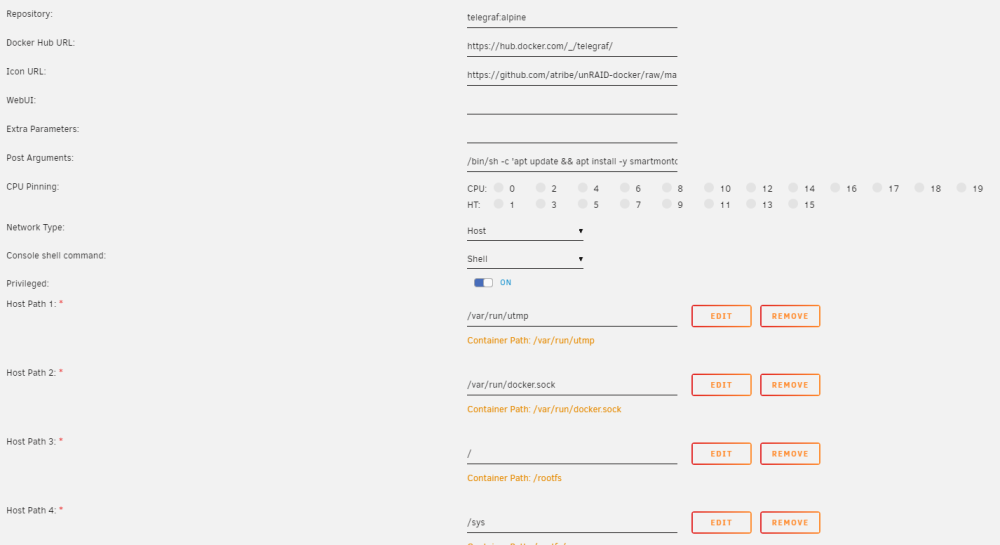
Well..well.. found it quickly... By changed the Repository: telegraf:1.20.2 The guides are a little off...
-
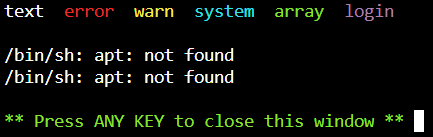
Greetings all, I'm a newbie here. Is this the correct place to ask for community support for this docker? I have been trying to get the UUD up and running all day today and now I am crossed eyed! My current issue is getting grafana to start. Searching the forum and trying various things. I have uninstalled and reinstalled Grafana mulitple times with no success. I am not getting error message. I do see in the logs /bin/sh: apt: not found. I'm trying to figure this out at this time. I followed the following guides: https://technicalramblings.com/blog/how-to-setup-grafana-influxdb-and-telegraf-to-monitor-your-unraid-system/ https://github.com/HStep20/Ultimate-Unraid-Dashboard-Guide

-
Sabot changed their profile photo
-
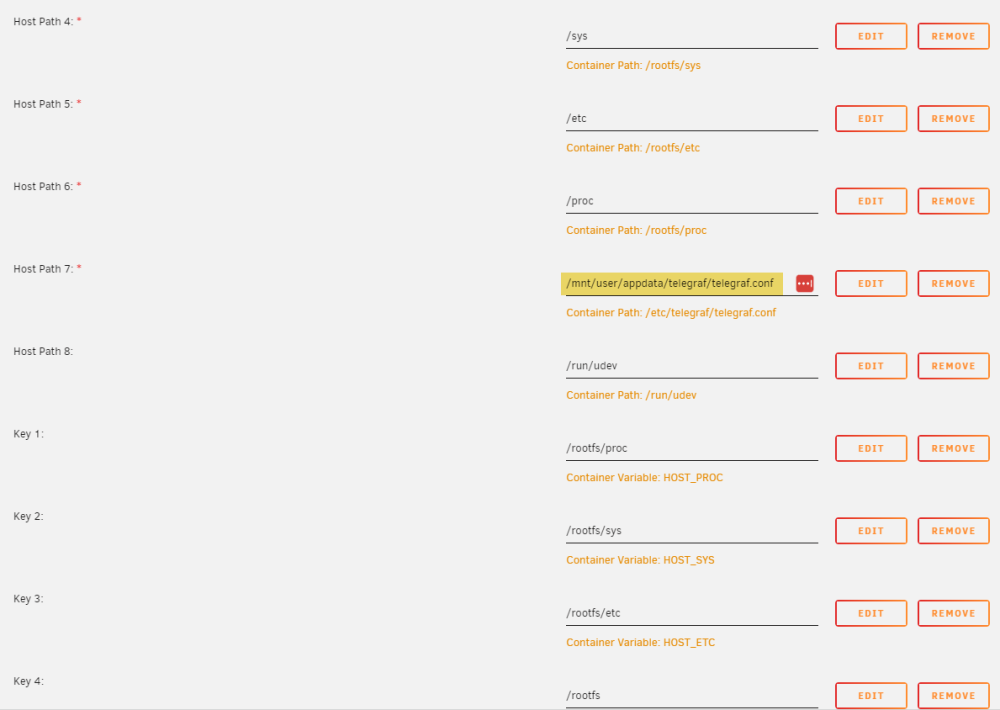
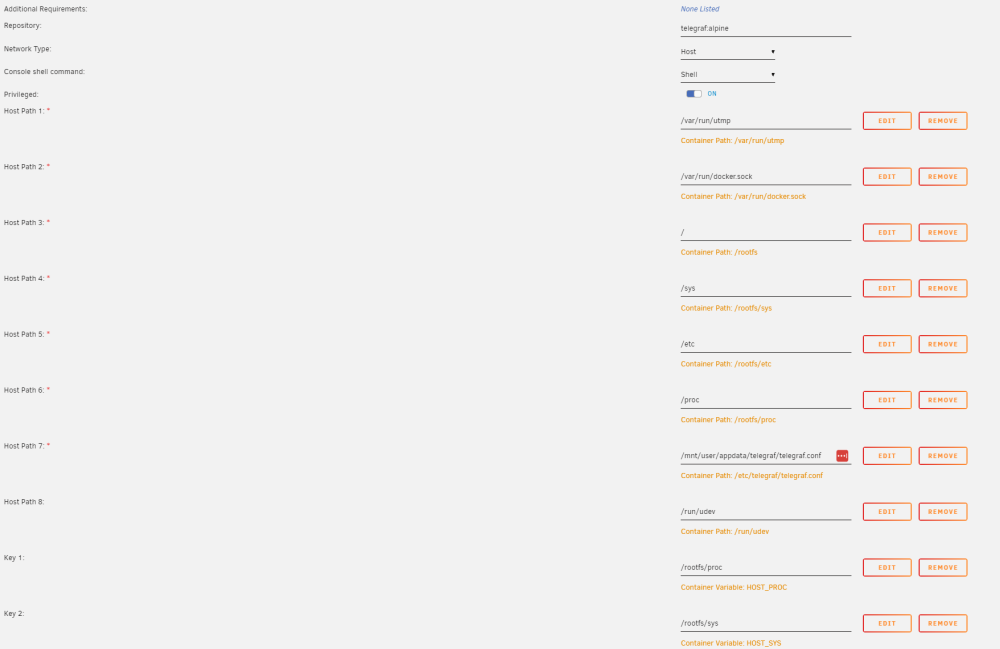
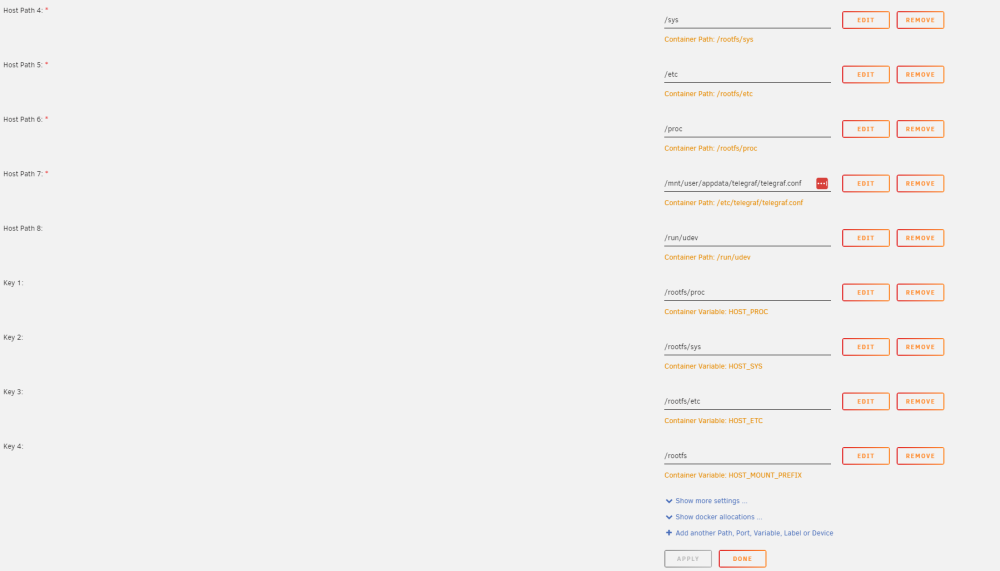
Greetings, I am new and I spent this morning trying to get this running. InfluxDB is running. When I try to start telefgraf, it won't start. I revisited the config file many times and even deleted it and uploaded a fresh one. It appears that it is not reading the config file. Im stuck. I must be missing the obvious. I followed these: https://technicalramblings.com/blog/how-to-setup-grafana-influxdb-and-telegraf-to-monitor-your-unraid-system/#installing-telegraf and telegraf.conf

-
Good day Simon and thank you for this plugin and all of your hardwork. Do you happen to have a manual for it? Thank you for your time! Have a wonderful day.
-
Thank you kind sir! Deleting the hostdev allowed me to start up the VM.
-
Good day all, I just installed a new motherboard and CPU which resulted on my VM Execution error "Internal error: Did not find USB device 2109:8817" Any suggestions? Thank you! Mike unraid-diagnostics-20220921-1727.zip


