


therapist
Members
-
Joined
-
Last visited
Everything posted by therapist
-
Ive recently upgraded my server with a few NVME drives, one of which replaced a VHD for a VM. I have been passing whole disks through to VMs for quite some time like this: <disk type='block' device='disk'> <driver name='qemu' type='raw' cache='none' discard='unmap'/> <source dev='/dev/disk/by-id/nvme-Samsung_SSD_970_EVO_Plus_1TB_XXXXXXXXXX'/> <target dev='hdf' bus='scsi'/> <boot order='2'/> <alias name='scsi0-0-0-3'/> <address type='drive' controller='0' bus='0' target='0' unit='3'/> </disk> After doing some reading I learned that NVME drives can be passed through directly to show as an actual NVME drive (as opposed to thin provisioned) <hostdev mode='subsystem' type='pci' managed='yes'> <driver name='vfio'/> <source> <address domain='0x0000' bus='0x41' slot='0x00' function='0x0'/> </source> <alias name='hostdev2'/> <address type='pci' domain='0x0000' bus='0x00' slot='0x04' function='0x0'/> </hostdev> Is there any actual functional difference in passing devices one or the other way? Any performance benefit? ALSO I learned that VHDs can be passed through as NVME devices <qemu:commandline> <qemu:arg value='-drive'/> <qemu:arg value='file=/mnt/cnvme/VMS/VHD_BULK/GEIST/GEIST_Z.img,format=raw,if=none,id=NVME1'/> <qemu:arg value='-device'/> <qemu:arg value='nvme,drive=NVME1,serial=nvme-1'/> </qemu:commandline>
-
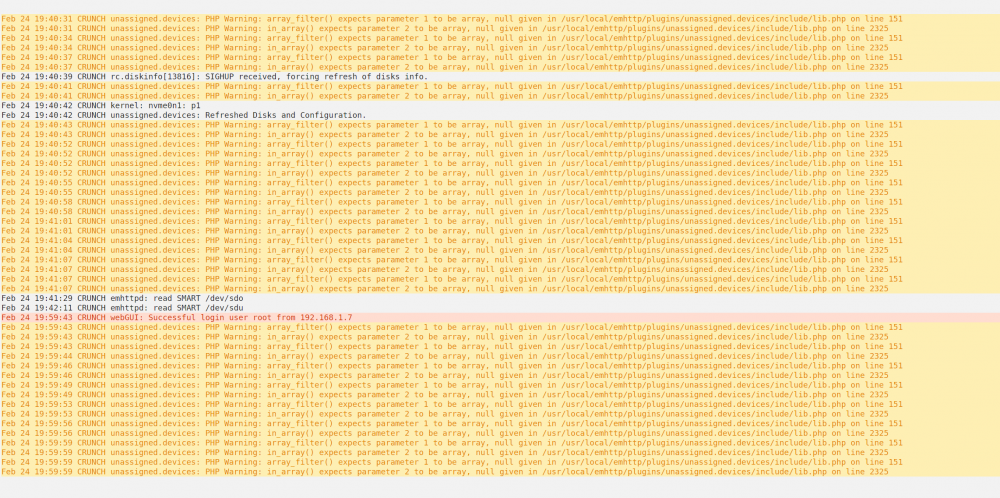
all was back to normalcy until 2022.02.24 operations all working, but getting a lot of php errors in log:
-
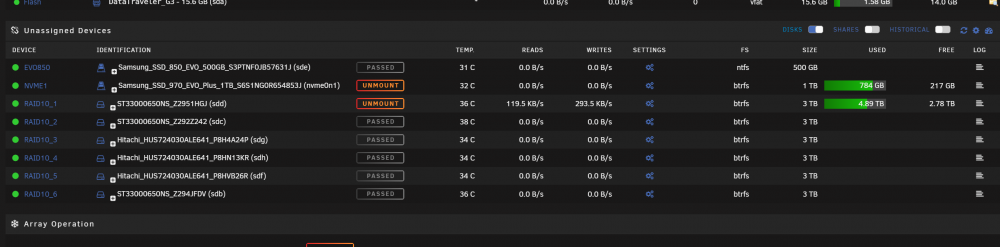
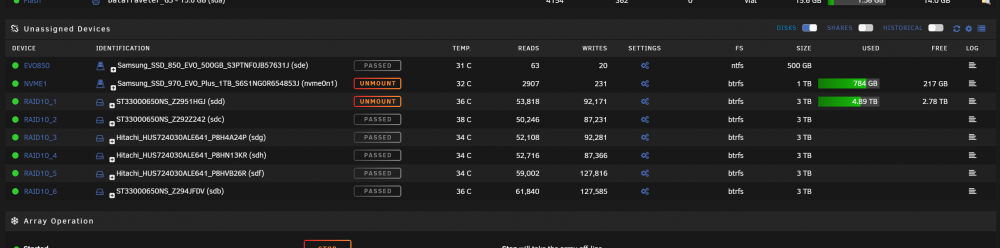
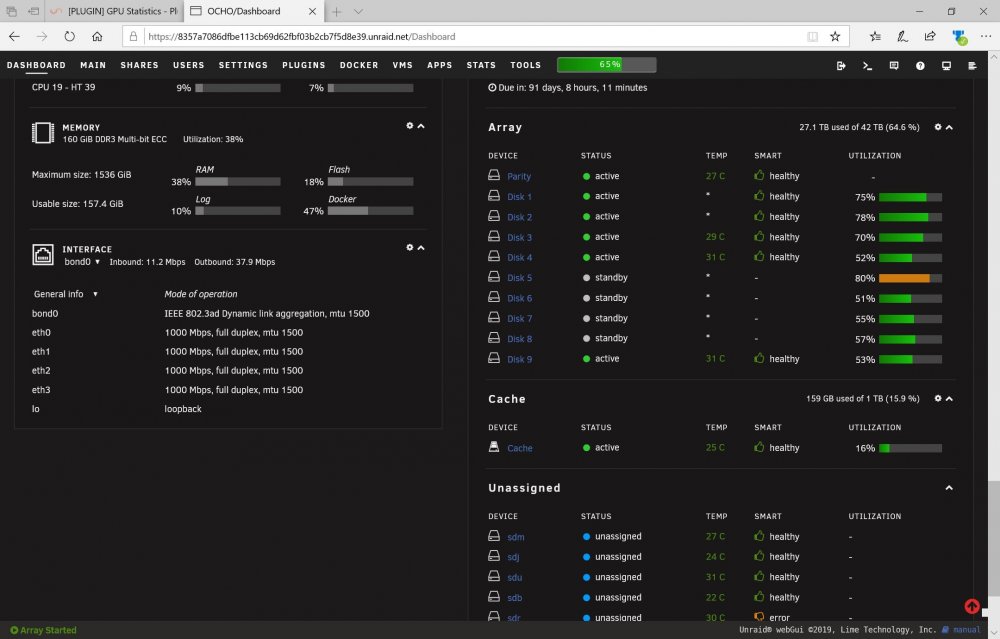
Having an issue with the latest few releases where my device activity is not showing on any of the "passed through" devices. Only the mountpoint disk for my raid 10 array is showing activity but there are definitely reads and writes being registered just not disk speed
-
PM'd
-
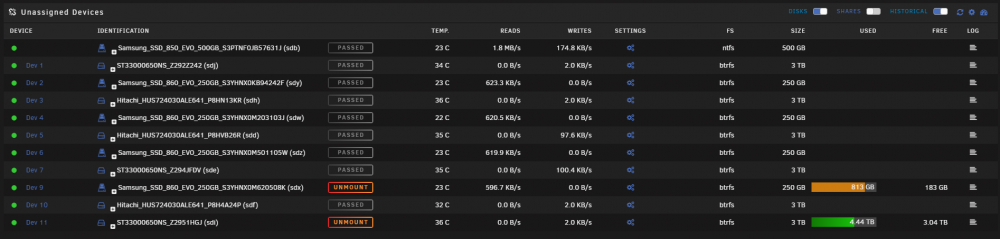
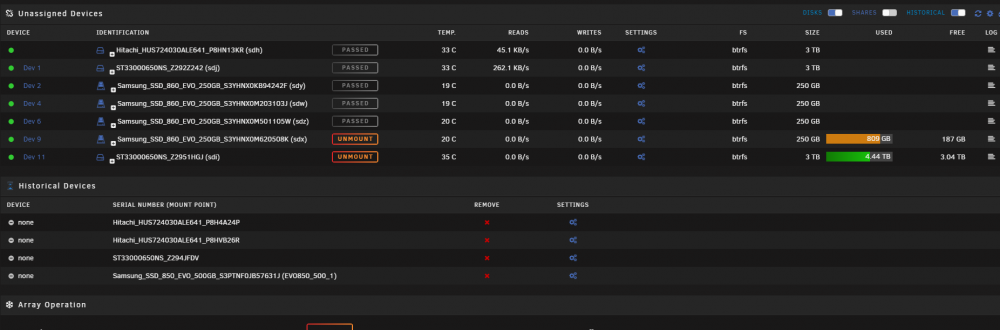
Devices are all now in UD but first device is blank When changing name it reverts to blank
-
the name field is blank, yes there arent any duplicate entries -- the drives still in historical include 3/6 drives in a RAID10 array and a passed-thru VM boot disk. all settings have name field blank
-
Having an issue this morning w/ version 2022.01.19a on unRAID 6.9.1 Upon upgrade ALL of my unassigned devices went into the Historical Devices section w/ pool/drive function seemingly unaffected. I stopped array as per previous recommendation -- items remained historical. I rebooted server (which greatly pained me after several months of uptime) and ONE device came back to UD w/ no device tag. I went into the settings for each drive and clicked done and some of the drives have returned to UD. See screenshot: That is currently where I stand -- I tried changing the device ID for one of the returned drives and it always reverts to dev (dev9) and there is still a device that has blank ID. Other drives are physically still in system and are functioning (EVO_850_1 is a VM boot disk and I am typing this message through that machine). Please advise
-
its not just you the easiest solution is to install a "custom" kernel with updated drivers -- super easy
-
@b3rs3rk I took the plunge & upgraded to 6.8.3 -- all is well Thanks
-
2020/03/08 10:13:45 [error] 17316#17316: *5876683 FastCGI sent in stderr: "Primary script unknown" while reading response header from upstream, client: 192.168.1.4, server: , request: "GET /usr/local/emhttp/plugins/gpustat/gpustatus.php HTTP/2.0", upstream: "fastcgi://unix:/var/run/php5-fpm.sock:", host: "8357a7086dfbe113cb69d62fbf03b2cb7f5d8e39.unraid.net", referrer: "https://8357a7086dfbe113cb69d62fbf03b2cb7f5d8e39.unraid.net/Dashboard" 2020/03/08 10:14:58 [error] 17316#17316: *5876683 FastCGI sent in stderr: "Primary script unknown" while reading response header from upstream, client: 192.168.1.4, server: , request: "GET /usr/local/emhttp/plugins/gpustat/gpustatus.php HTTP/2.0", upstream: "fastcgi://unix:/var/run/php5-fpm.sock:", host: "8357a7086dfbe113cb69d62fbf03b2cb7f5d8e39.unraid.net", referrer: "https://8357a7086dfbe113cb69d62fbf03b2cb7f5d8e39.unraid.net/gpustatus" page source.txt
-
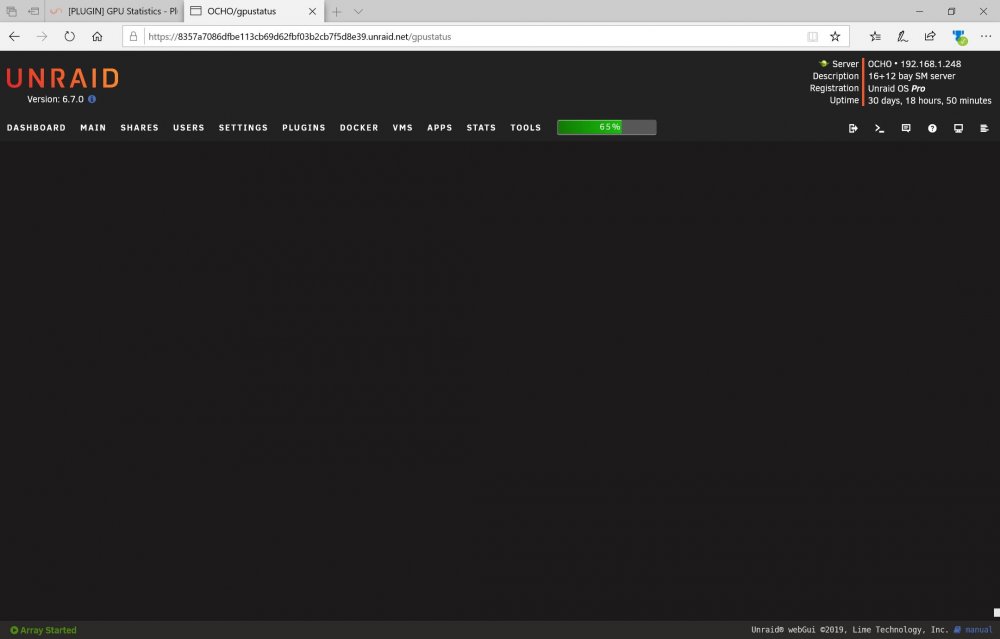
My NUT & IPMI summary dash show up, but no GPU Immediately under those are the default widgets
-
that the funny thing --- it doesnt show up on my dash its in the page map, but when i click there its literally a blank page
-
root@OCHO:~# nvidia-smi -q -x <?xml version="1.0" ?> <!DOCTYPE nvidia_smi_log SYSTEM "nvsmi_device_v10.dtd"> <nvidia_smi_log> <timestamp>Sun Mar 8 10:00:09 2020</timestamp> <driver_version>418.56</driver_version> <cuda_version>10.1</cuda_version> <attached_gpus>1</attached_gpus> <gpu id="00000000:03:00.0"> <product_name>GeForce GTX 1050 Ti</product_name> <product_brand>GeForce</product_brand> <display_mode>Disabled</display_mode> <display_active>Disabled</display_active> <persistence_mode>Disabled</persistence_mode> <accounting_mode>Disabled</accounting_mode> <accounting_mode_buffer_size>4000</accounting_mode_buffer_size> <driver_model> <current_dm>N/A</current_dm> <pending_dm>N/A</pending_dm> </driver_model> <serial>N/A</serial> <uuid>GPU-44ed723b-7f9c-07da-236b-347ab81deddf</uuid> <minor_number>0</minor_number> <vbios_version>86.07.39.00.30</vbios_version> <multigpu_board>No</multigpu_board> <board_id>0x300</board_id> <gpu_part_number>N/A</gpu_part_number> <inforom_version> <img_version>G001.0000.01.04</img_version> <oem_object>1.1</oem_object> <ecc_object>N/A</ecc_object> <pwr_object>N/A</pwr_object> </inforom_version> <gpu_operation_mode> <current_gom>N/A</current_gom> <pending_gom>N/A</pending_gom> </gpu_operation_mode> <gpu_virtualization_mode> <virtualization_mode>None</virtualization_mode> </gpu_virtualization_mode> <ibmnpu> <relaxed_ordering_mode>N/A</relaxed_ordering_mode> </ibmnpu> <pci> <pci_bus>03</pci_bus> <pci_device>00</pci_device> <pci_domain>0000</pci_domain> <pci_device_id>1C8210DE</pci_device_id> <pci_bus_id>00000000:03:00.0</pci_bus_id> <pci_sub_system_id>A45419DA</pci_sub_system_id> <pci_gpu_link_info> <pcie_gen> <max_link_gen>3</max_link_gen> <current_link_gen>3</current_link_gen> </pcie_gen> <link_widths> <max_link_width>16x</max_link_width> <current_link_width>16x</current_link_width> </link_widths> </pci_gpu_link_info> <pci_bridge_chip> <bridge_chip_type>N/A</bridge_chip_type> <bridge_chip_fw>N/A</bridge_chip_fw> </pci_bridge_chip> <replay_counter>0</replay_counter> <replay_rollover_counter>0</replay_rollover_counter> <tx_util>0 KB/s</tx_util> <rx_util>12000 KB/s</rx_util> </pci> <fan_speed>51 %</fan_speed> <performance_state>P0</performance_state> <clocks_throttle_reasons> <clocks_throttle_reason_gpu_idle>Not Active</clocks_throttle_reason_gpu_idle> <clocks_throttle_reason_applications_clocks_setting>Not Active</clocks_throttle_reason_applications_clocks_setting> <clocks_throttle_reason_sw_power_cap>Not Active</clocks_throttle_reason_sw_power_cap> <clocks_throttle_reason_hw_slowdown>Not Active</clocks_throttle_reason_hw_slowdown> <clocks_throttle_reason_hw_thermal_slowdown>Not Active</clocks_throttle_reason_hw_thermal_slowdown> <clocks_throttle_reason_hw_power_brake_slowdown>Not Active</clocks_throttle_reason_hw_power_brake_slowdown> <clocks_throttle_reason_sync_boost>Not Active</clocks_throttle_reason_sync_boost> <clocks_throttle_reason_sw_thermal_slowdown>Not Active</clocks_throttle_reason_sw_thermal_slowdown> <clocks_throttle_reason_display_clocks_setting>Not Active</clocks_throttle_reason_display_clocks_setting> </clocks_throttle_reasons> <fb_memory_usage> <total>4040 MiB</total> <used>286 MiB</used> <free>3754 MiB</free> </fb_memory_usage> <bar1_memory_usage> <total>256 MiB</total> <used>2 MiB</used> <free>254 MiB</free> </bar1_memory_usage> <compute_mode>Default</compute_mode> <utilization> <gpu_util>0 %</gpu_util> <memory_util>0 %</memory_util> <encoder_util>0 %</encoder_util> <decoder_util>2 %</decoder_util> </utilization> <encoder_stats> <session_count>0</session_count> <average_fps>0</average_fps> <average_latency>0</average_latency> </encoder_stats> <fbc_stats> <session_count>0</session_count> <average_fps>0</average_fps> <average_latency>0</average_latency> </fbc_stats> <ecc_mode> <current_ecc>N/A</current_ecc> <pending_ecc>N/A</pending_ecc> </ecc_mode> <ecc_errors> <volatile> <single_bit> <device_memory>N/A</device_memory> <register_file>N/A</register_file> <l1_cache>N/A</l1_cache> <l2_cache>N/A</l2_cache> <texture_memory>N/A</texture_memory> <texture_shm>N/A</texture_shm> <cbu>N/A</cbu> <total>N/A</total> </single_bit> <double_bit> <device_memory>N/A</device_memory> <register_file>N/A</register_file> <l1_cache>N/A</l1_cache> <l2_cache>N/A</l2_cache> <texture_memory>N/A</texture_memory> <texture_shm>N/A</texture_shm> <cbu>N/A</cbu> <total>N/A</total> </double_bit> </volatile> <aggregate> <single_bit> <device_memory>N/A</device_memory> <register_file>N/A</register_file> <l1_cache>N/A</l1_cache> <l2_cache>N/A</l2_cache> <texture_memory>N/A</texture_memory> <texture_shm>N/A</texture_shm> <cbu>N/A</cbu> <total>N/A</total> </single_bit> <double_bit> <device_memory>N/A</device_memory> <register_file>N/A</register_file> <l1_cache>N/A</l1_cache> <l2_cache>N/A</l2_cache> <texture_memory>N/A</texture_memory> <texture_shm>N/A</texture_shm> <cbu>N/A</cbu> <total>N/A</total> </double_bit> </aggregate> </ecc_errors> <retired_pages> <multiple_single_bit_retirement> <retired_count>N/A</retired_count> <retired_pagelist>N/A</retired_pagelist> </multiple_single_bit_retirement> <double_bit_retirement> <retired_count>N/A</retired_count> <retired_pagelist>N/A</retired_pagelist> </double_bit_retirement> <pending_retirement>N/A</pending_retirement> </retired_pages> <temperature> <gpu_temp>45 C</gpu_temp> <gpu_temp_max_threshold>102 C</gpu_temp_max_threshold> <gpu_temp_slow_threshold>99 C</gpu_temp_slow_threshold> <gpu_temp_max_gpu_threshold>N/A</gpu_temp_max_gpu_threshold> <memory_temp>N/A</memory_temp> <gpu_temp_max_mem_threshold>N/A</gpu_temp_max_mem_threshold> </temperature> <power_readings> <power_state>P0</power_state> <power_management>Supported</power_management> <power_draw>N/A</power_draw> <power_limit>75.00 W</power_limit> <default_power_limit>75.00 W</default_power_limit> <enforced_power_limit>75.00 W</enforced_power_limit> <min_power_limit>52.50 W</min_power_limit> <max_power_limit>75.00 W</max_power_limit> </power_readings> <clocks> <graphics_clock>1746 MHz</graphics_clock> <sm_clock>1746 MHz</sm_clock> <mem_clock>3504 MHz</mem_clock> <video_clock>1569 MHz</video_clock> </clocks> <applications_clocks> <graphics_clock>N/A</graphics_clock> <mem_clock>N/A</mem_clock> </applications_clocks> <default_applications_clocks> <graphics_clock>N/A</graphics_clock> <mem_clock>N/A</mem_clock> </default_applications_clocks> <max_clocks> <graphics_clock>1923 MHz</graphics_clock> <sm_clock>1923 MHz</sm_clock> <mem_clock>3504 MHz</mem_clock> <video_clock>1708 MHz</video_clock> </max_clocks> <max_customer_boost_clocks> <graphics_clock>N/A</graphics_clock> </max_customer_boost_clocks> <clock_policy> <auto_boost>N/A</auto_boost> <auto_boost_default>N/A</auto_boost_default> </clock_policy> <supported_clocks>N/A</supported_clocks> <processes> <process_info> <pid>10067</pid> <type>C</type> <process_name>/usr/lib/plexmediaserver/Plex Transcoder</process_name> <used_memory>276 MiB</used_memory> </process_info> </processes> <accounted_processes> </accounted_processes> </gpu> </nvidia_smi_log> root@OCHO:~# root@OCHO:~# cd /usr/local/emhttp/plugins/gpustat root@OCHO:/usr/local/emhttp/plugins/gpustat# php ./gpustat.php Could not open input file: ./gpustat.php root@OCHO:/usr/local/emhttp/plugins/gpustat# ls GPUStatSettings.page gpustatus.page icons/ license/ README.md gpustatus.php images/ root@OCHO:/usr/local/emhttp/plugins/gpustat# php ./gpustatus.php {"name":"GeForce GTX 1050 Ti","util":"0%","memutil":"0%","temp":"43C","fan":"51%","power":"N\/A","encoders":1,"vendor":"nVidia"}root@OCHO:/usr/local/emhttp/plugins/gpustat# I think you may have a typo somewhere which is causing my issue?
-
is there a minimum driver or unraid version for this plugin? i am on 6.7.0 and have been using a 1050 to hw transcode for quite some time -- but after installing this plugin it doesnt seem to do anything, nothing appears on the dashboard? ps i can confirm that my 1050 reports N/A / 75w i think the lower end cards dont report power usage as my VM utilized 1070 reports fine
-
Ive switched to a 9300-8i and have had no TRIM issues since. I tried various other LSI card previously -- 9207 / 9201 / 9211 -- and they all have issues with the latest MP2SAS/MP3SAS software. Id recommend upgrading your HBA card or running off motherboard ports if you really want TRIM. Prior to my upgrade I had run without TRIM for almost a year with regular operation (.5-1 TBw/d) and no performance issues with my 860s
-
any update on getting the latest git pull @atribe? this package still wont start: Connecting to InfluxDB host:192.168.1.248, DB:nut Connected successfully to InfluxDB Connecting to NUT host 192.168.1.248:3493 Connected successfully to NUT Traceback (most recent call last): File "/src/nut-influxdb-exporter.py", line 107, in <module> json_body = construct_object(ups_data, remove_keys, tag_keys) File "/src/nut-influxdb-exporter.py", line 85, in construct_object fields['watts'] = watts * 0.01 * fields['ups.load'] TypeError: can't multiply sequence by non-int of type 'float'
-
I am having this issue as well Looks like there was a github update to address ~4days ago -- container needs to be updated to latest
-
unRAID (as when I started with it) helped me get away from the off the shelf NAS products into a much more robust environment. Originally starting with an 8-disk rack server, I quickly added additional DAS devices for more storage...swapped hardware for more VM performance...and now host a media streaming server for 20ish daily users. The server also runs my home LAN dockers, and my daily driver gaming VM....could have done it a million other ways, but unRAID made everything cohesive & simple!
-
Use the SuperMicro IPMICFG tool to create a new user, then login and change password Tool available here: https://www.supermicro.com/solutions/SMS_IPMI.cfm Copy linux package to accessible dir and use via putty Follow guide here: https://www.servethehome.com/reset-supermicro-ipmi-password-default-lost-login/
-
I primarily use the NUT plugin for UPS control, and leave the baked in UPS monitor alone, however have had two instances now where I wake up to emails/errors about UPS lost communication. System was last started up/reset on 4/6/19 and first saw the issue on 4/14: Apr 14 04:40:04 OCHO apcupsd[547]: apcupsd 3.14.14 (31 May 2016) slackware startup succeeded Apr 14 04:40:04 OCHO apcupsd[547]: NIS server startup succeeded Apr 14 04:40:04 OCHO kernel: usb 2-1.1: usbfs: interface 0 claimed by usbfs while 'apcupsd' sets config #1 Apr 14 04:40:09 OCHO kernel: usb 2-1.1: usbfs: interface 0 claimed by usbfs while 'apcupsd' sets config #1 Apr 14 04:40:14 OCHO kernel: usb 2-1.1: usbfs: interface 0 claimed by usbfs while 'apcupsd' sets config #1 Apr 14 04:40:19 OCHO kernel: usb 2-1.1: usbfs: interface 0 claimed by usbfs while 'apcupsd' sets config #1 Apr 14 04:40:24 OCHO kernel: usb 2-1.1: usbfs: interface 0 claimed by usbfs while 'apcupsd' sets config #1 Apr 14 04:40:29 OCHO kernel: usb 2-1.1: usbfs: interface 0 claimed by usbfs while 'apcupsd' sets config #1 Apr 14 04:40:34 OCHO kernel: usb 2-1.1: usbfs: interface 0 claimed by usbfs while 'apcupsd' sets config #1 Apr 14 04:40:39 OCHO kernel: usb 2-1.1: usbfs: interface 0 claimed by usbfs while 'apcupsd' sets config #1 Apr 14 04:40:44 OCHO kernel: usb 2-1.1: usbfs: interface 0 claimed by usbfs while 'apcupsd' sets config #1 Apr 14 04:40:49 OCHO kernel: usb 2-1.1: usbfs: interface 0 claimed by usbfs while 'apcupsd' sets config #1 Apr 14 04:40:54 OCHO kernel: usb 2-1.1: usbfs: interface 0 claimed by usbfs while 'apcupsd' sets config #1 Apr 14 04:40:59 OCHO kernel: usb 2-1.1: usbfs: interface 0 claimed by usbfs while 'apcupsd' sets config #1 Apr 14 04:41:04 OCHO apcupsd[547]: Communications with UPS lost. The usbfs error continues on w/ the communications lost notification until I addressed the issue. Found my dashboard had the UPS plugin running, went into settings and found it started w/ gui setting set to off. a quick toggle of the settings and all was well again & dashboard panel went away. Now again last night (4/21/19) Apr 21 04:40:04 OCHO apcupsd[2116]: apcupsd 3.14.14 (31 May 2016) slackware startup succeeded Apr 21 04:40:04 OCHO apcupsd[2116]: NIS server startup succeeded Apr 21 04:40:04 OCHO kernel: usb 2-1.1: usbfs: interface 0 claimed by usbfs while 'apcupsd' sets config #1 Apr 21 04:40:09 OCHO kernel: usb 2-1.1: usbfs: interface 0 claimed by usbfs while 'apcupsd' sets config #1 Apr 21 04:40:14 OCHO kernel: usb 2-1.1: usbfs: interface 0 claimed by usbfs while 'apcupsd' sets config #1 Apr 21 04:40:19 OCHO kernel: usb 2-1.1: usbfs: interface 0 claimed by usbfs while 'apcupsd' sets config #1 Apr 21 04:40:24 OCHO kernel: usb 2-1.1: usbfs: interface 0 claimed by usbfs while 'apcupsd' sets config #1 Apr 21 04:40:29 OCHO kernel: usb 2-1.1: usbfs: interface 0 claimed by usbfs while 'apcupsd' sets config #1 Apr 21 04:40:34 OCHO kernel: usb 2-1.1: usbfs: interface 0 claimed by usbfs while 'apcupsd' sets config #1 Apr 21 04:40:39 OCHO kernel: usb 2-1.1: usbfs: interface 0 claimed by usbfs while 'apcupsd' sets config #1 Apr 21 04:40:44 OCHO kernel: usb 2-1.1: usbfs: interface 0 claimed by usbfs while 'apcupsd' sets config #1 Apr 21 04:40:49 OCHO kernel: usb 2-1.1: usbfs: interface 0 claimed by usbfs while 'apcupsd' sets config #1 Apr 21 04:40:54 OCHO kernel: usb 2-1.1: usbfs: interface 0 claimed by usbfs while 'apcupsd' sets config #1 Apr 21 04:40:59 OCHO kernel: usb 2-1.1: usbfs: interface 0 claimed by usbfs while 'apcupsd' sets config #1 Apr 21 04:41:04 OCHO apcupsd[2116]: Communications with UPS lost. Exactly 7 days to the second, we get another myster startup. I dont have any user scripts running that would call apcupsd, but i do see my "fixed schedules" set to run daily scripts at 440a. But apcupsd doesnt start up daily, only weekly which is set to run at 430a on Sundays.
-
Version: 6.7.0-rc7 Seeing random segfaults related to musl recently: Apr 8 23:59:32 OCHO kernel: python[34253]: segfault at 6e6f68747988 ip 000014ed29501411 sp 000014ed226c2d38 error 6 in ld-musl-x86_64.so.1[14ed294f4000+45000] Apr 8 23:59:32 OCHO kernel: Code: 48 8b 47 10 48 39 47 18 75 14 89 f1 48 c7 c0 fe ff ff ff 48 d3 c0 f0 48 21 05 1b b6 06 00 48 8b 57 18 48 8b 47 10 48 89 42 10 <48> 89 50 18 48 8b 47 08 48 89 c2 48 83 e0 fe 48 83 ca 01 48 89 57 Apr 9 00:12:33 OCHO kernel: python[2565]: segfault at 561700000090 ip 000014ed2950140d sp 000014ed226c2f08 error 6 in ld-musl-x86_64.so.1[14ed294f4000+45000] Apr 9 00:12:33 OCHO kernel: Code: 83 c0 10 c3 48 8b 47 10 48 39 47 18 75 14 89 f1 48 c7 c0 fe ff ff ff 48 d3 c0 f0 48 21 05 1b b6 06 00 48 8b 57 18 48 8b 47 10 <48> 89 42 10 48 89 50 18 48 8b 47 08 48 89 c2 48 83 e0 fe 48 83 ca have unifi-controller / ombi / nextcloud / resilio-sync / tautulli / duplicati installed from linuxserver repo how do I go about identifying the culprit container? Its not like its happening with any kind of frequency ocho-diagnostics-20190409-1212.zip
-
@johnnie.black I have a UD RAID0 array currently & have been considering changing to RAID5 Can btrfs balance -dconvert be done on the fly w/ data existing or must the disks be cleared beforehand?
-
my apologies, misread that!
-
I tried again with an Intel PRO 2500 SSD w/ the same results on a 9207-8e w/ expander & a 9211-8i w/ passthrough backplane
-
That's a nice find I just verified my 860 EVO also supports DRAT Also got my hands on a few Intel Pro 2300 SSDs which also support DRAT Do you have your 860s going through a backplane or expander @Trunkz


