





mlapaglia
Members
-
Joined
-
Last visited
Everything posted by mlapaglia
-
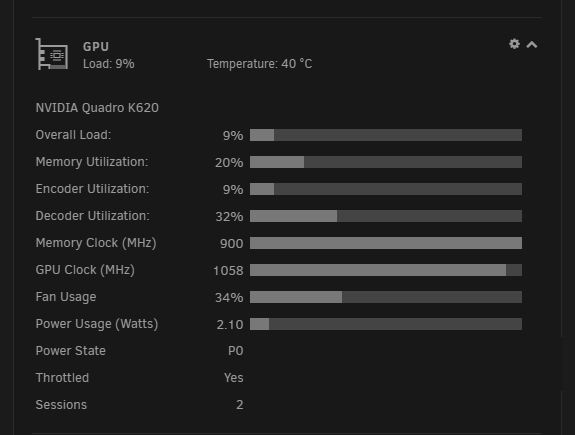
I'm not sure, I just modified it to make it look like the other dashboard, not sure how the back side works. i realized it's missing a memory utilization bar. in the nvidia smi output i see two values. the utilization field for memory doesn't seem to reflect when plex is running transcodes. using the fb_memory_usage value works well though: edit: found it https://docs.nvidia.com/deploy/nvml-api/structnvmlUtilization__t.html#structnvmlUtilization__t_19789def365e5aa382ac222db9c60a400 The utilization field for memory is: so for my purposes i'd just want to know how much memory is being used, just making the bar show the % used memory
-
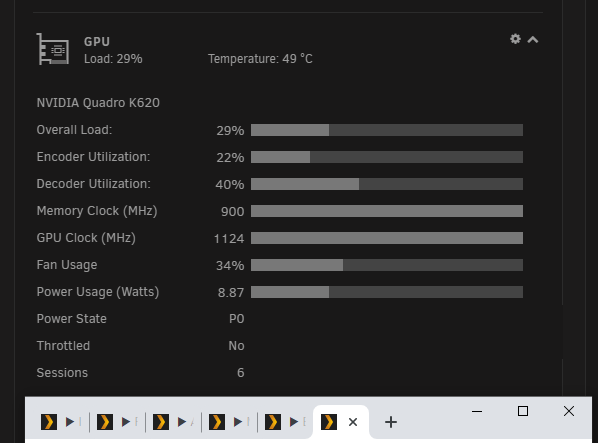
thanks for this plugin! I have an old quadro k620 in my box I decided to try this on. A $50 card from 2014 can handle at least 6 plex transcodes at the same time, using less than 10 watts lol!
-
thanks for this plugin. very simple to install, followed instructions and had plex DVR enabled in 10 minutes.
-
I know it's really stupid, but maybe this typo correction will help someone else. I copy/pasted the config volume instructions from the first post instructions and couldn't figure out why it wouldn't map the file into the container:
-
ok i added the optional display preferences back in, on my machine whenever i try to save my preferences they go back to default, does that happen on yours?
-
thanks! i couldn't find much information online about developing plugins so i was making wild stabs in the dark lol
-
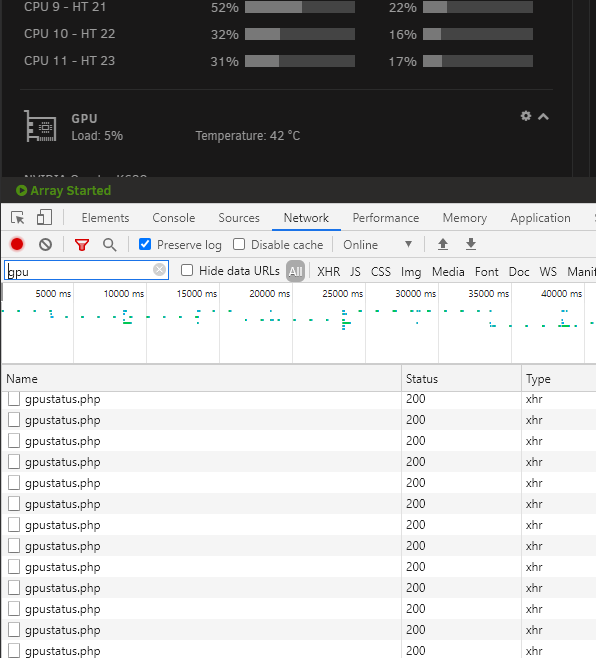
Ya I don't have that part wired up yet. I'm also curious why the plugin has to hit an endpoint every second to get information, while CPU usage in the unraid CPU sidebar doesn't make a http call to get information.
-
If you want to give mine a try first uninstall the existing plugin then manually install my PR https://raw.githubusercontent.com/mlapaglia/gpustat-unraid/master/gpustat.plg
-
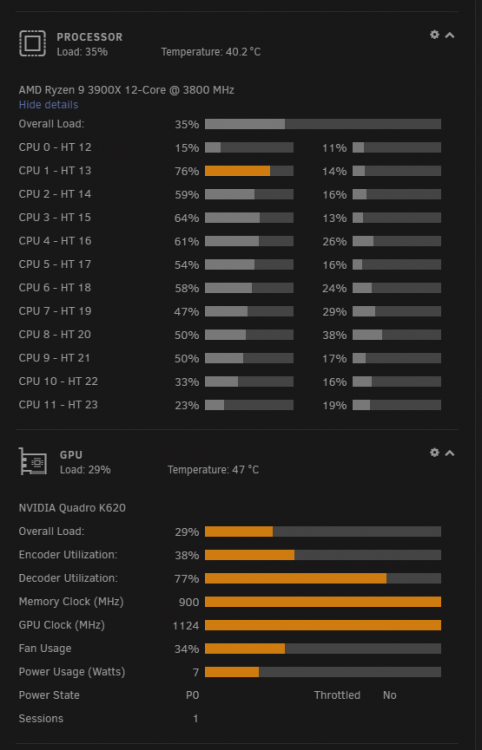
I did some more work to get it to look like the CPU sidebar that comes with unraid
-
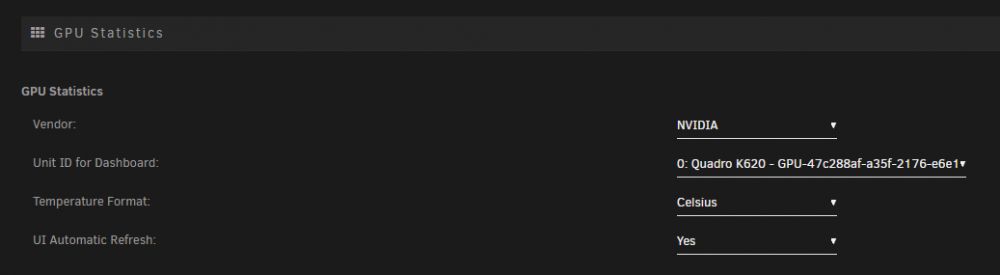
I tried cloning the repo and making modifications but i couldn't get my plugin to work.. i modified the existing plugin while it was installed and got this: Here's the PR: https://github.com/b3rs3rk/gpustat-unraid/pull/6 I need some help creating the pkg file for the pr.
-
I can help troubleshoot the UI refresh in 6.9.0. When I look at the page source I don't see the `setTimeout` listed, where does `$update` get set, i'm guessing this is false? when I call the `setTimeout` command manually in the console the UI does refresh. <?if ($update):?> setTimeout(gpustat_status, <?=max(abs($display['refresh']),2000)?>); <?endif;?>
-
after i uninstalled wireguard it didn't remove the network settings it created during installation. the next time the server restarted the leftover network configuration broke the internet connection.
-
i guess wireguard doesn't do a cleanup if you uninstall it: ip link delete wg0 deleting this wg0 made everything start working again
-
i can't get unraid to connect to the internet, installing docker containers etc fails, viewing the app store fails. when i try to ping google.com i see that it resolves the DNS correctly, but it can't reach it: root@Tower:~# ping google.com PING google.com (172.217.6.14) 56(84) bytes of data. From 10.253.0.1 (10.253.0.1) icmp_seq=1 Destination Host Unreachable ping: sendmsg: Destination address required ^CFrom 10.253.0.1 icmp_seq=2 Destination Host Unreachable ping: sendmsg: Destination address required --- google.com ping statistics --- 2 packets transmitted, 0 received, +2 errors, 100% packet loss, time 5018ms pinging the router, or other devices on the network works fine: root@Tower:~# ping 192.168.1.1 PING 192.168.1.1 (192.168.1.1) 56(84) bytes of data. 64 bytes from 192.168.1.1: icmp_seq=1 ttl=64 time=0.240 ms ^C --- 192.168.1.1 ping statistics --- 1 packets transmitted, 1 received, 0% packet loss, time 0ms rtt min/avg/max/mdev = 0.240/0.240/0.240/0.000 ms this morning i installed the wireguard plugin, could that have broken something? i have since uninstalled it. tower-diagnostics-20201020-2338.zip
-
i think installing wireguard messed with my network settings, is anyone else seeing errors when looking at apps?

-
Same is happening to me
-
Has anyone had issues with using both nvme slots for their cache? When I use either one separately the cache works but once I try to use both at once I get IO errors.
-
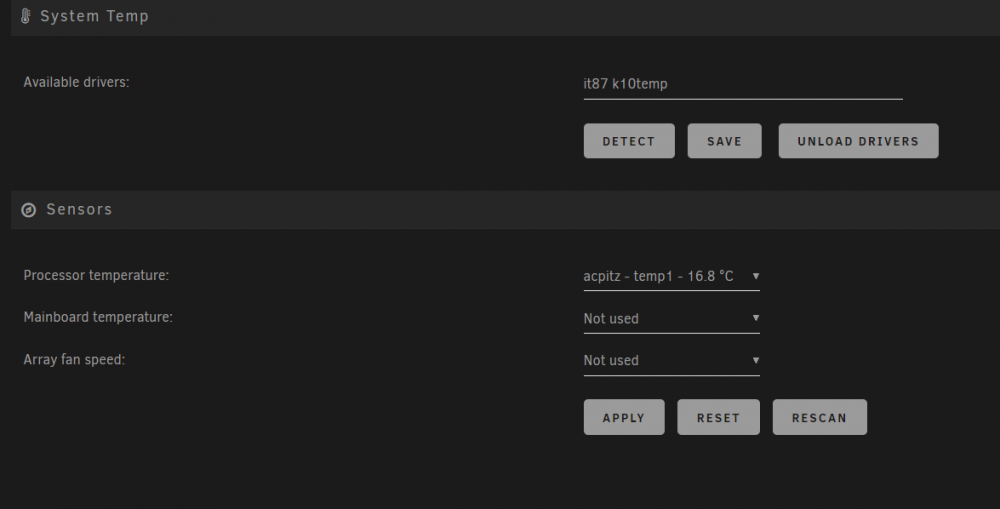
I just got the 3900x and x570 pro running, i'm only able to get one temperature reading to show up, any ideas?
-
@Derek_ that is SLICK! Is it only for synology? https://roll.urown.net/NAS/borg-backup-server.html# , maybe not their website is vague http://www.borgbackupserver.com/
-
Has anyone found a decent front end for restic? I'd like the ability to see scheduled backups etc.
-
How can I troubleshoot intermittent high CPU usage? Happens every minute or so for 30 seconds.





