jbartlett
Community Developer
-
Joined
-
Last visited
Everything posted by jbartlett
-
1. I don't think there would be any difference in speeds regardless of file system in reading of existing files. The creation & deletion of files, the file system can play an impact in the speed of the operations but that is also highly variable such as tree depth, number of files in a directory, even drive utilization percentage. I haven't thought about trying to benchmark that, not sure if there's enough value to the results to warrant it. 2. I've thought about it but I don't think many people would truly test such logic with their data, even if the write is writing what was already there back onto it. If I were to implement it, it might be only on an unpartitioned drive.
-
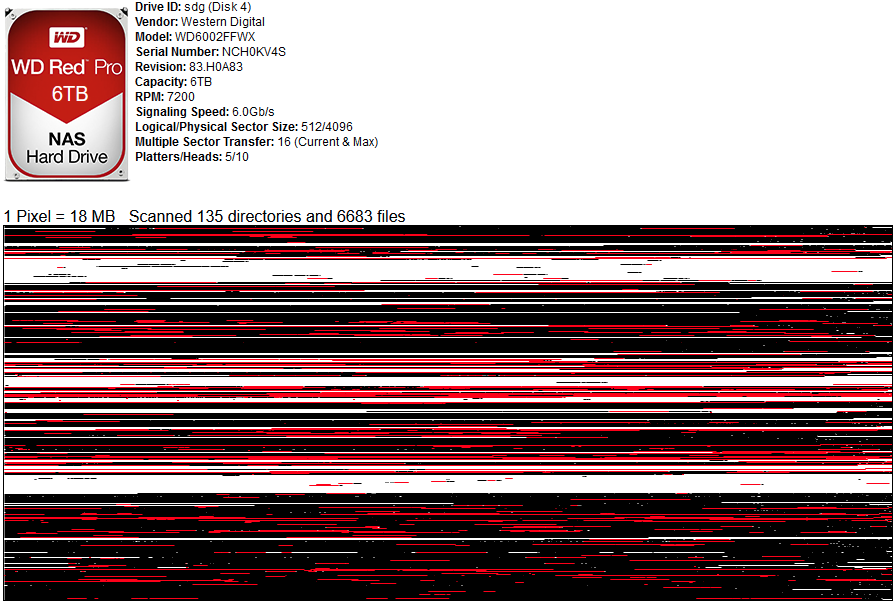
I just noticed a trend in the file fragmentation. It seems the OS has the tendency to break the file up into chunks of a set size. I found this really strange because, well, why do it at all? Noticing the trend of 32768, I did some research and some file systems (like ex4) have a maximum number of blocks that can fit in one extent and then the OS has to create a new extent to continue, thus creating a forced fragmentation chain by design. But it's interesting that in some extents break this barrier (btrfs in this case), typically on the last two extents but not always. I had designed my app to display fragments in red but I think I'll just default everything to black with the option of display fragmented files in red after the scan. File size of 10,000 BC.m4v is 2995331020 (731282 blocks of 4096 bytes) ext: logical_offset: physical_offset: length: expected: flags: 0: 0.. 32767: 793856.. 826623: 32768: 1: 32768.. 65535: 848352.. 881119: 32768: 826624: 2: 65536.. 98303: 913888.. 946655: 32768: 881120: 3: 98304.. 131071: 979424.. 1012191: 32768: 946656: 4: 131072.. 163839: 1056000.. 1088767: 32768: 1012192: 5: 163840.. 196607: 1121536.. 1154303: 32768: 1088768: 6: 196608.. 327679: 1165152.. 1296223: 131072: 1154304: 7: 327680.. 731281: 1318144.. 1721745: 403602: 1296224: last,eof 10,000 BC.m4v: 8 extents found Also adding a "Directory Hog" feature to show you where your drive space is going.
-
Feature in progress - file fragmentation & allocation map. One thing I've learned is that for some reason, the underlaying OS likes to split up files all over the drive. This is from a drive on my backup NAS, files are just copied there but I see that large files are broken up all over the drive in most cases. Black = Allocated, non fragmented Red = Allocated, fragmented White = Unallocated
-
The first IP is the IP of the Docker and it's fine. The 2nd set after the arrow should have the IP of your unraid box plus :18888. Mine is "172.17.0.2:8888/TCP <--> 192.168.1.7:18888". I also have Network Type set to "Bridge", Console Shell Command set to "Shell", and Privileged set to ON. Try this: Edit the Docker and change the name to something other than "DiskSpeed" to change the local cached version's name and then delete the docker. Install DiskSpeed via the AppStore or from the XML file on the 1st post on this thread. If nothing works, you may want to post in the 6.8.1 general support thread or 6.9.0 beta thread depending on which version of unraid you're running that the Web UI link isn't being displayed. -John
-
View the advanced settings and check that the "WebUI" setting has "http://[IP]:[PORT:18888]/". If it does, it sounds like a bug not related to my Docker.
-
I'm also getting exponential results, both positive & negative like "5.8e-10%". A transform rule to change a range of -99-0 to 0 would fix the negative ones but not sure how to do the positive ones. Maybe the math needs an "int" formula.
-
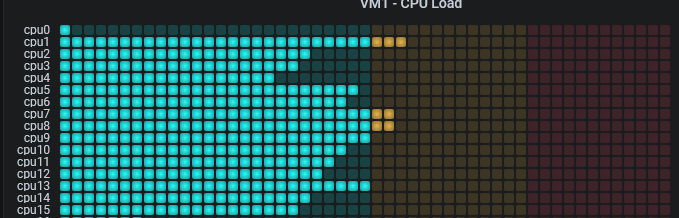
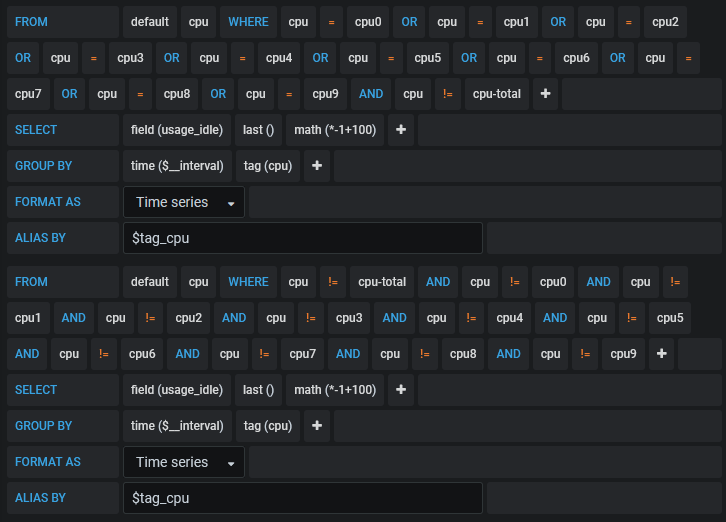
I updated the CPU panel list to show CPU's 0-9 first followed by CPU's 10+ to resolve it sorting like cpu0, cpu1, cpu10, cpu11, etc. The same logic should be able to be added to the CPU graph panel. It was done by updating the first query to only return results for CPU0-9 and then added a second query that returned results for all values except CPU0-9 & cpu-total. { "cacheTimeout": null, "datasource": "$telegrafdatasource", "fieldConfig": { "defaults": { "custom": { "align": null }, "unit": "percent", "min": 0, "max": 100, "thresholds": { "mode": "absolute", "steps": [ { "color": "rgb(0, 255, 255)", "value": null }, { "color": "#EAB839", "value": 50 }, { "color": "red", "value": 75 } ] }, "mappings": [] }, "overrides": [] }, "gridPos": { "h": 12, "w": 11, "x": 13, "y": 18 }, "hideTimeOverride": true, "id": 130, "interval": "$interval", "links": [], "options": { "reduceOptions": { "values": false, "calcs": [ "lastNotNull" ], "fields": "" }, "orientation": "horizontal", "displayMode": "lcd", "showUnfilled": true }, "pluginVersion": "7.3.3", "targets": [ { "alias": "$tag_cpu", "dsType": "influxdb", "groupBy": [ { "params": [ "$__interval" ], "type": "time" }, { "params": [ "cpu" ], "type": "tag" } ], "hide": false, "measurement": "cpu", "orderByTime": "ASC", "policy": "default", "refId": "A", "resultFormat": "time_series", "select": [ [ { "params": [ "usage_idle" ], "type": "field" }, { "params": [], "type": "last" }, { "params": [ "*-1+100" ], "type": "math" } ] ], "tags": [ { "key": "cpu", "operator": "=", "value": "cpu0" }, { "condition": "OR", "key": "cpu", "operator": "=", "value": "cpu1" }, { "condition": "OR", "key": "cpu", "operator": "=", "value": "cpu2" }, { "condition": "OR", "key": "cpu", "operator": "=", "value": "cpu3" }, { "condition": "OR", "key": "cpu", "operator": "=", "value": "cpu4" }, { "condition": "OR", "key": "cpu", "operator": "=", "value": "cpu5" }, { "condition": "OR", "key": "cpu", "operator": "=", "value": "cpu6" }, { "condition": "OR", "key": "cpu", "operator": "=", "value": "cpu7" }, { "condition": "OR", "key": "cpu", "operator": "=", "value": "cpu8" }, { "condition": "OR", "key": "cpu", "operator": "=", "value": "cpu9" }, { "condition": "AND", "key": "cpu", "operator": "!=", "value": "cpu-total" } ] }, { "alias": "$tag_cpu", "groupBy": [ { "params": [ "$__interval" ], "type": "time" }, { "params": [ "cpu" ], "type": "tag" } ], "measurement": "cpu", "orderByTime": "ASC", "policy": "default", "refId": "B", "resultFormat": "time_series", "select": [ [ { "params": [ "usage_idle" ], "type": "field" }, { "params": [], "type": "last" }, { "params": [ "*-1+100" ], "type": "math" } ] ], "tags": [ { "key": "cpu", "operator": "!=", "value": "cpu-total" }, { "condition": "AND", "key": "cpu", "operator": "!=", "value": "cpu0" }, { "condition": "AND", "key": "cpu", "operator": "!=", "value": "cpu1" }, { "condition": "AND", "key": "cpu", "operator": "!=", "value": "cpu2" }, { "condition": "AND", "key": "cpu", "operator": "!=", "value": "cpu3" }, { "condition": "AND", "key": "cpu", "operator": "!=", "value": "cpu4" }, { "condition": "AND", "key": "cpu", "operator": "!=", "value": "cpu5" }, { "condition": "AND", "key": "cpu", "operator": "!=", "value": "cpu6" }, { "condition": "AND", "key": "cpu", "operator": "!=", "value": "cpu7" }, { "condition": "AND", "key": "cpu", "operator": "!=", "value": "cpu8" }, { "condition": "AND", "key": "cpu", "operator": "!=", "value": "cpu9" } ] } ], "timeFrom": null, "timeShift": null, "title": "$host - CPU Load", "type": "bargauge" }
-
Edit the settings and verify that "Web Port" has a value. It defaults to "18888".
-
I did some checking on the model number. It's a White Label drive which means it's likely a specific drive built for a specific purpose and rebranded. It looks a Western Digital drive. Personally, I kinda cringed when I saw it was a WL. Here's a long tread about the drives for your perusal. I only read the 1st page. https://forums.servethehome.com/index.php?threads/review-of-white-label-4tb-drives.3559/
-
Nothing looks wrong with the drive from these reports. A future update will add heat map support where the entire drive is read and the read speeds are represented in a color range. This might help see hidden trouble spots. That update is probably a couple months away though. Right now, I'm working on adding drive allocation & fragmentation maps which the heat maps will use to locate which files are contained in found bad spots. One thing you can try is to run a benchmark as given above but test the drive every 1%.
-
Click on the Benchmark button on the main page and uncheck "Check all drives", set the checkbox for Disk 3, and set the checkbox for "Disable Speed Gap detection". If you frequently get a "retrying" on a spot, its because the min/max speeds at that spot were over a certain threshold and it is retrying that spot again after increasing that threshold by 5mb. Setting the Disable Speed Gap button disables this retry feature. This gap between the min/max speeds is typically caused by some other process accessing the drive at the same time but it can also be caused by a bad spot. I plan on adding a cap to the number of retries. The newest version of this app also displays the SMART information for the drive which by default displays only catastrophic drive health values. Take a screen shot of that and post it. If it's not displaying it, then there's something wrong with the smart report as it gets it from UNRAID and UNRAID isn't saving it. View the drive info on the unraid Main tab to get the smart values.
-
As per the nvidia plugin install instructions, I disabled docker but when I tried to enable it, the "Default appdata storage location:" setting turns red and the change does not apply. The path exists. Rebooting does not allow it to enable. nasbackup-diagnostics-20201118-1114.zip
-
I stumbled across this thread and promptly had a nerdgasm. Loving the Dashboard! Only change I've made so far is to add an Y axis cap of 100 so the CPU graphs don't scale to 125% after a core hits 100%.
-
In a new VM configuration (as well as older ones), whenever I try to change from VNC to my P2000 and save, it assigns it as a 2nd graphics card instead and leaves the VNC as the primary. vm1-diagnostics-20201109-1923.zip
-
I'll look into it but you can ignore it. It's a lucee extension that I'm not using but it's trying to load.
-
Highcharts.com renders the charts and I'm passing in a large number and that's how it's translating the number. I can override the suffix but then it outputs the entire number. Highcharts understands numbers, it doesn't understand drive capacity numbers. That said, if you hover over a point where I do specify the value to display, it says MB and GB.
-
Try installing it with one core but after the first reboot during the install, update the core count before Windows locks things down.
-
That's a Win2008 Server issue and unrelated to KVM. Try reinstalling with the desired number of cores or try to re-register.
-
On UNRAID's Tools page, run "New Permissions" against the lancache share. You'll need to repeat this process if any new files are created by the app. Alternately, you can telnet in and run MC.
-
I just ran an Windows Update and it connected & downloaded. (Win10)
-
@opticon - Go ahead and update the Docker and see if it fixes the issue
-
I see the issue, it's a typo. It's passing a numeric position to the ListFirst function at the end of the line which doesn't take a numeric position. It's too late for me to push a fix tonight but I'll take care of it tomorrow.
-
If you use Plex on unraid, the Plex phone app has this ability.
-
If you notice how the drives have a flat line? That's what the program looks for to determining if bandwidth was capped - or if it seems the drive can output data faster than the drive controller or connection can handle. As per tee-tee jorge's comment, run a pre-clear on those drives and you should get graphs that match the trend on the Hard Drive Database
-
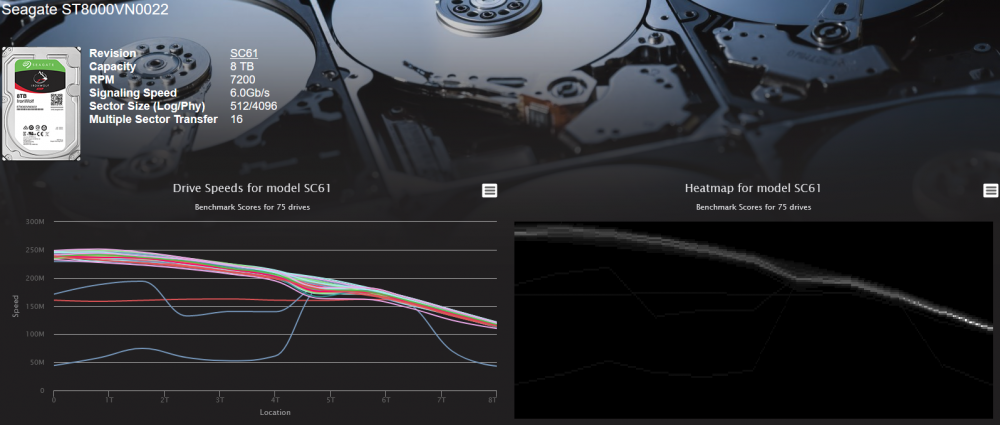
Heatmap data has been added to the Hard Drive Database and is displayed for any drive model that has more than 25 drives benchmarked & uploaded. The 9th most popular drive based on uploaded benchmarks is the 8TB Seagate ST8000VN0022. Looking at the graph shows and odd dip at the 4.8GB mark but there are enough seemingly normal scans that you'd think that it might be a fluke but the heatmap scan shows the majority of the drives do have a dip at this point. http://strangejourney.net/hddb/