





johnsanc
Members
-
Joined
-
Last visited
Everything posted by johnsanc
-
Is it possible to somehow surface the disk number where a file resides through a user share, perhaps as a file attribute? I ask because I don't follow a very structured storage approach and I have similar types of files scattered across drives. There are situations where I need to hash files that reside on my user shares, but I can only use one hasher so I don't thrash disks. It would be nice if I could read what disk a file resides on before determining what to do with it. The only way I can think to do this is not use user shares and instead access disk shares directly which is not ideal. Anyways, just a thought and was wondering if this was possible, perhaps with a user script to write an attribute that is accessible via SMB. I'm no expert though.
-
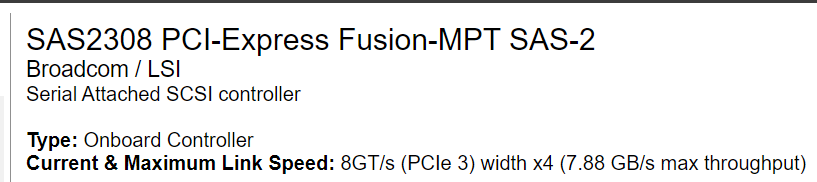
@jbartlett - Thanks i updated but I see the same thing basically: Current & Maximum Link Speed: 8GT/s (PCIe 3) width x8 (7.88 GB/s max throughput) Current & Maximum Link Speed: 8GT/s (PCIe 3) width x4 (7.88 GB/s max throughput) How can x4 and x8 on PCIe 3 have the same throughput? Not sure if it matters, but these are PCIe 4 slots, but the cards in them are PCIe 3. My comment about the link speed was comparing what diskspeed says vs the Identity tab on a particular disk. I see diskspeed always says 6GB/s, but the Identity tab also shows the "current" speed like this:

-
Quick update: 0-8 TB: ~90-95 MB/s 8-10 TB: ~95-105 MB/s 10-12 TB: ~105-110 MB/s 12-14 TB: ~110-115 MB/s I am currently in the 12-14 TB range with 10 data disks in scope. Overall as you can see speed is increasing to a more respectable rate given the disk position as certain disk size thresholds are passed.
-
That’s what I suspected as well, but I don’t see any crazy cpu utilization on any specific thread so I wasn’t sure. Once my parity sync is complete in a couple days I’ll run a few more tests
-
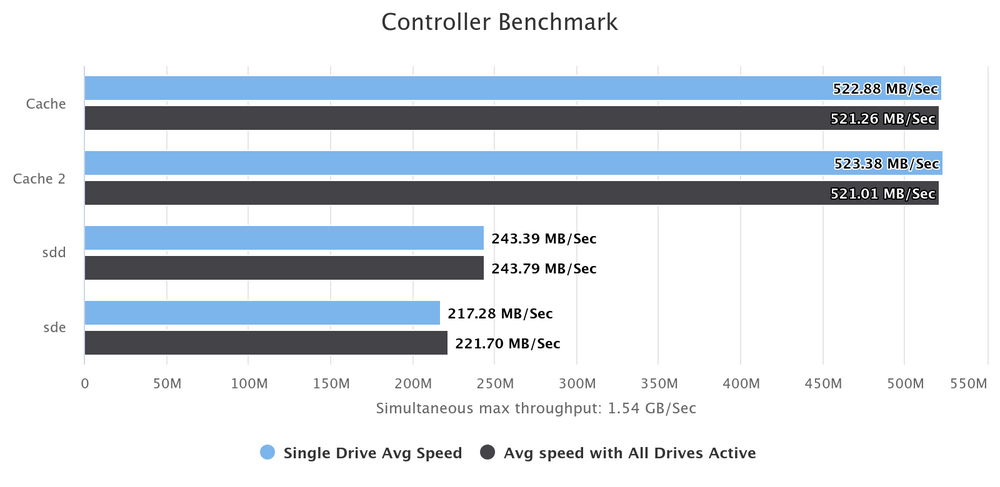
Here are the benchmarks i took immediately before starting parity sync. No drives were moved from these locations on the controllers.
.thumb.png.d600bd4082c12fc571a0028aabf51b2f.png)
.thumb.png.d17634c900c3f61d33ae133def1a597b.png)
-
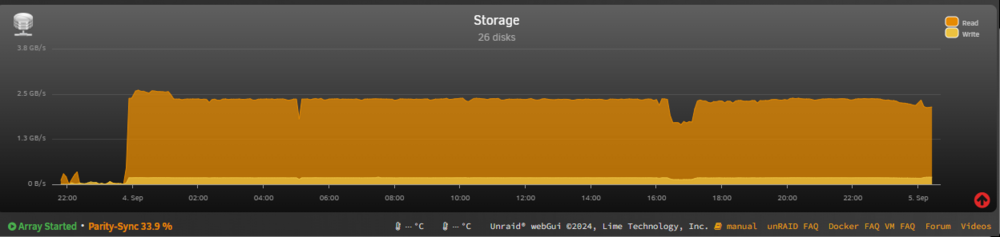
I am in the process of upgrading my parity drives to 2x 24TB drives. I am currently running a parity sync on both drives at the same time. I am noticing that my speeds are lackluster compared to the speeds I get when benchmarking with the diskspeed app. My parity sync speeds are consistently between 90-100MB/s. However, my individual benchmarked speeds are fairly close to what I would expect as shown in the graph below. Also my controller benchmarks are generally 5-10% lower than the sum of the individual speed benchmarks, which is still much faster than the parity sync speeds I am getting. (Graph taken with 5% increment benchmarks, diskspeed default is 10%) I am aware that parity syncs and checks are bottlenecked by the slowest drive, but even if that's the case I would only expect the 90-100 MB/s speeds toward the end of the 8, 10, 12, and 14TB disks. So my question is, why would my parity syncs hit a ceiling early on? I expected to see a gradual slowdown as the 8TB disks were processed, but instead it stayed steady at ~2.5 GB/s nearly the entire time. (Parity sync, 8 TB disks ended near the end of graph, at the small bump. Dip earlier on was due to a short stint of disk reads) Any ideas what could be bottlenecking and how I might diagnose? tower-diagnostics-20240905-0039.zip
.thumb.png.6276859e26e730b6d874944f2bec89f0.png)
-
I don't know how I overlooked this app for so many years but its great! I used it to identify a few optimizations to my setup. I did have a couple questions / comments though: I didn't see a way to test all controllers concurrently, or a way to test combinations of drives concurrently. Do you think this is feasible to implement? It would be very useful for triaging bottlenecks. I don't see the negotiated speed anywhere in the UI. I know all my disks are 6GB/s but some are negotiated at current speed of 3GB/s I don't think some of the throughput calculations are correct. For example I have a 9207-8e on an 8x connection and it says: "8GT/s width x8 (7.88 GB/s max throughput)". I also have a 9207-8i on a 4x PCIe connection and it says: "8GT/s width x4 (7.88 GB/s max throughput)". How can these both have the same max throughput? Thanks, and I also submitted a new disk to your database I'm curious what other people get for this one since it appears to be a 24TB HAMR drive, got em from serverpartsdeals. Not impressed with speed, but I do like the density. https://www.strangejourney.net/hddb/ModelDatabase.cfm?Vendor=Seagate&Model=ST24000NM000C
-
Just to follow up and close the loop on this. I believe there may have been a few issues at play. I had EPC enabled for these disks. I followed the instructions here. I used openSeaChest to check the features that were enabled on each of the drives and updated accordingly. This was the first time I used openSeaChest. Its a great tool and it would be nice if some of its functions were integrated into unraid, perhaps Fix Common Problems. The LSI card with these disks had outdated firmware. I updated this to the most recent. These Dell EMC disks also had outdated firmware. I updated from PAL7 to PAL9 because I noticed there was a fix for command timeouts, which I have observed before on these disks
-
I used the Parity Problems Assistant today. It worked great for checking a problematic area of a disk that keeps getting disabled only when i stop the array, as outlined here: However, I noticed when you choose a sector range to check, it seems to check beyond the area specified. I was trying to limit this to isolate the ending sector of the problematic area because the syslog caps at 100 sync errors. Also, not sure if its within scope of this sorta plugin, but it would be awesome to integrate this: This was very useful for me to isolate exactly what file may have an issue.
-
I was preparing to upgrade again to 6.12.13 and this happened again with disk6. I've attached my diagnostics hopefully something stands out. Here is what I did: changed disk1 and disk6 to never spin down manually spun up disk1 and disk6 on the main page shut down my vms stopped all dockers stopped array - disk6 marked as disabled after stopping array saved diagnostics (attached) Once the array shut down I went to check the main page, I see its marked as disabled again. The disks rebuild perfectly fine every time, I've had no other errors whatsoever as far as I am aware except for during array shutdown. Few questions: What exactly is unraid during while stopping the array that could cause this issue? It looks like it does reads and writes to a few sectors according to the log. For this particular disabled event, is it relatively safe to do a New Config, preserve all slots, select parity is valid, and restart the array without needing to rebuild? I really don't want to keep rebuilding disks everytime I need to upgrade or restart the array for any reason. I know you say it may be an issue with the LSI card and disk combo, but this really sounds like there should be some additional checks or something before shutting down the array and declaring disks disabled. EDIT: One more update. I did a new config with valid parity and started a parity check and it immediately found 2 sync errors but nothing else so far: Aug 24 11:18:23 Tower kernel: mdcmd (38): check correct Aug 24 11:18:23 Tower kernel: md: recovery thread: check P Q ... Aug 24 11:18:23 Tower kernel: md: recovery thread: PQ corrected, sector=0 Aug 24 11:18:23 Tower kernel: md: recovery thread: PQ corrected, sector=64 I also tried a non-correcting parity check for the the range 3910376000 to 3910377000 since the syslog showed a read/write error for 3910376504. Here are the results: 514 sync errors detected as shown on the array main page Syslog shows exactly 100 lines of errors starting at 3910376504 through 3910377296 Each error in the log is exactly 8 sectors apart I was curious if maybe the log was capped at a certain number of error details, so i tried a shorter range. For some reason even with shorter ranges, the parity problems assistant plugin seems to check beyond the endpoint I specify, for example: Aug 24 12:04:17 Tower kernel: md: recovery thread: PQ incorrect, sector=3910377296 Aug 24 12:04:17 Tower kernel: md: recovery thread: stopped logging Aug 24 12:04:23 Tower Parity Problem Assistant: Send notification: Partial parity check (Non-Correcting): Range: Sectors 3910376500-3910376550 (type=normal link=/Settings/Scheduler) EDIT2: I decided to do some investigative work to see if the data was correct or if parity was correct. I found what file occupies the offending area. It was a zip archive. I extracted the archive and lo and behold it is perfectly fine. So I believe this means parity was incorrect. If this is the case, then a parity rebuild would have reconstructed bad data, overwriting good data that was there previously. If thats the case, that is a scary thought since I have rebuilt disks before and always assumed the parity was correct... but in situations like this I think the opposite occurred. For now I'm exporting the File Integrity results and checking the exports for both disk1 and disk6 since they have both been rebuilt in the past for this array shutdown issue assuming parity was correct. I will report back in a day or two once the check has completed. Could someone smarter than me weigh in on this? @JorgeB perhaps? tower-diagnostics-20240824-1041.zip
-
I cant seem to reproduce the issue now. Maybe it was an issue with how the computer booted after a power outage. Weird. However... now once again when i shutdown my array theres like a 50% chance I will get a disabled disk. This just happened again... Sigh.
-
Ever since I upgraded to Unraid 6.12.11 my server will not boot unless I manually intervene. The boot selection screen shows up and it says my selection will automatically boot in 5 seconds, but it doesnt. It just sits there and does nothing. A keyboard is plugged in and I can manually select the option to boot. Any ideas what the issue could be? This was never an issue before this latest build.
-
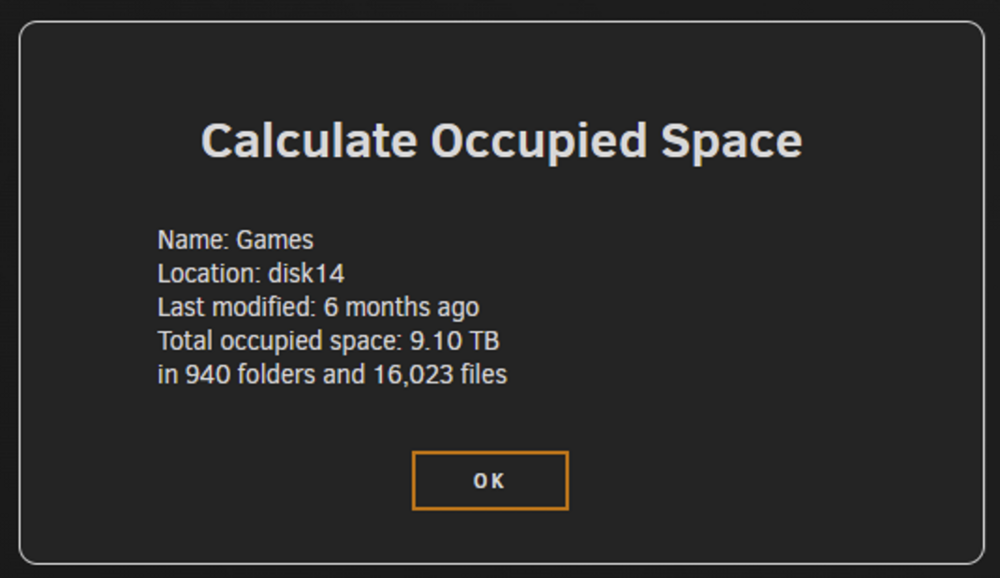
Well this is interesting... I am transferring some of the temp files manually from disk 14 to disk 16 and I can see in midnight commander I have transferred over 100 GiB so far, but the unraid UI only has disk usage decreased by about 10 GiB... I opened some of the files in a hex editor and confirmed they are mostly zeroes. I would have expected the disk usage to decrease, but it sounds like unraid's disk space calculation is NOT including the zeroed space of sparse files. Edit: Yeah this is a problem... This is only an 8 TB disk but it says 9+ TB occupied. Apparently committed sparse space is NOT considered in unraids calculations for free space. IMO, unraid's disk allocations should be changed to use the space metrics as shown here since it’s more impactful for allocation purposes than whatever is shown on the main page. @JorgeB - Welcome your thoughts on this one!
-
Written to disk 15 which is correct. I think I see what the issue is though... during a very large transfer, a ton of temp files were created before their full filesize was allocated. So most of the temp files were written to disk 14 initially then grew as the transfer was going. So yes what you originally said was correct, but I guess I should always pre-allocate disk space to avoid this issue.
-
Nope thats not the case, these are all brand new files.
-
I just noticed this topic and reported something similar here with 6.12.11. For the life of me I cannot see what I did wrong or why unraid is allocating this way.
-
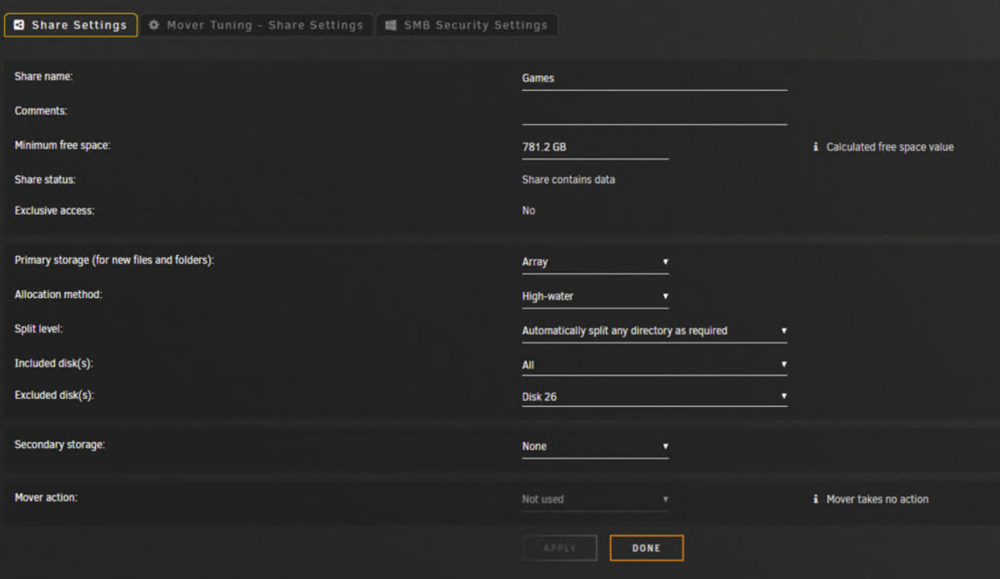
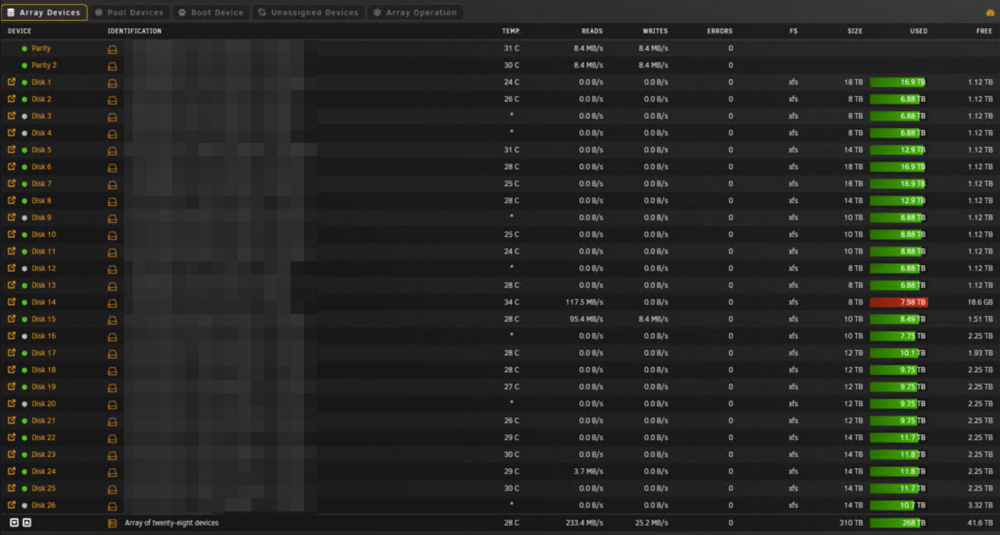
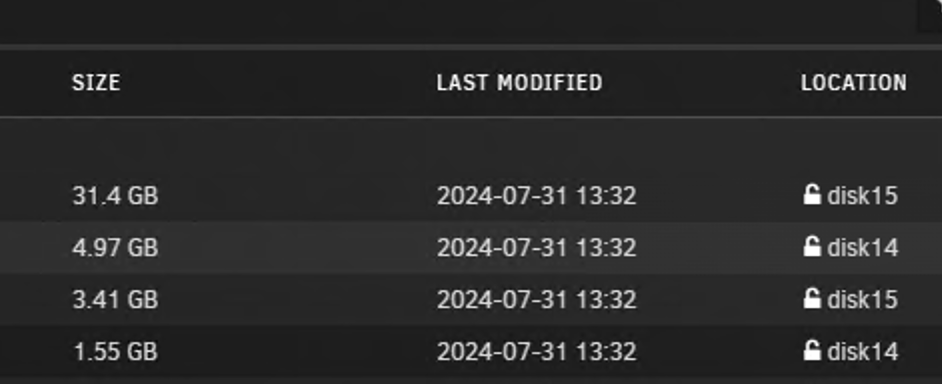
I have an issue where one of my drives keeps filling up. It looks like the min free space setting is not being obeyed. Anyone know what I'm doing wrong or is this a bug? I also confirmed that there are directories on most other disks that it could write to, but for some reason its prioritizing disk 14 which doesn't have enough space for the largest files I would be writing. Note: As you can see from the screenshot, everything is pretty balanced except disk 14. The only change I made recently was upgrading to 6.12.11 from 6.12.9 a few days ago. Diagnostics attached. Edit: Based on the description of High Water: "Choose the lowest numbered disk with free space still above the current high water mark. The high water mark is initialized with the size of the largest Data disk divided by 2. If no disk has free space above the current high water mark, divide the high water mark by 2 and choose again." So that would mean... 18 / 2 = 9 TiB 9 / 2 = 4.5 TiB 4.5 / 2 = 2.25 TiB 2.25 / 2 = 1.125 TiB (currently here) Ok so its filling up the lowest numbered disk that had at least 1.125 TiB of free space... but then what? I can see its writing to both disk 14 and disk 15, but I would NOT expect any writes to disk 14 since its has far below the min free space. tower-diagnostics-20240731-1344.zip
-
According to YanVugenfirer, it looks like they know what the issue is but not a priority to fix. I guess maybe AMD users are out of luck until they get a chance to look at this. SMB it is for me for now. GitHub Issue: https://github.com/virtio-win/kvm-guest-drivers-windows/issues/1039#issuecomment-2171441245
-
Yes that is exactly what happens on my machine. Slow transfers and a single CPU hits 100% during the process. I had a feeling it wasn’t something specific to my machine. Good to know another AMD user has the same issue.
-
Diagnostics attached. Thanks again! tower-diagnostics-20240520-0905.zip
-
Well this exact same thing happened again, but this time with a different disk. Is there anything I can do to prevent this? May 19 13:07:09 Tower emhttpd: shcmd (6720903): umount /mnt/disk6 May 19 13:07:09 Tower kernel: XFS (md6p1): Unmounting Filesystem May 19 13:07:10 Tower kernel: md: disk6 read error, sector=3910242856 May 19 13:07:18 Tower kernel: md: disk6 write error, sector=3910242856 May 19 13:07:18 Tower kernel: md: disk6 read error, sector=0 May 19 13:07:19 Tower kernel: md: disk6 write error, sector=0 May 19 13:07:19 Tower emhttpd: shcmd (6720904): rmdir /mnt/disk6
-
I'm not sure if that setting did the trick or not, but either way it sounds like those defaults were not appropriate for my use case. I tried making the changes you listed and let it sit several hours. I started my Windows 10 VM and it hung at the boot screen... so no noticeable change. I have 128GB of RAM and I originally allocated 96GB to my Windows 11 VM (with memorybacking), and 8GB to a Windows 10 VM. I dropped my Win11 VM down to 64GB and now Win10 boots without any issues. So I guess even though I had plenty of memory to go around, something wasn't playing nice. Not sure if maybe I needed to reboot my Win11 VM after changing the two settings you mentioned for it to take effect. Maybe I'll try out a few other memory combinations tomorrow to see if I can reproduce the hanging behavior of my Win10 VM.
-
Wow. Nice find. that perfectly explains the behavior I was seeing as well with my VMs. My attempt to create a Windows 10 VM would just sit on a blank screen randomly most of the time. Lo and behold, memory backing on my other VM was the culprit. Considering I don't use virtiofs due to my unexplained performance issues, I'm just going to remove the memory backing config altogether. Does more harm than good unless you need it it seems.
-
Thanks. I'll just let this disk rebuild and keep an eye out to see if happens again. Wish there was an easy way to see what file is associated with that sector to diagnose what might have happened. Do you know if there is a good way to do this that I can check after the disk rebuilds?
-
Hmm interesting. That's what I thought as well. Shouldn't Unraid control this though and ensure all other services are stopped before unmounting? What is the best practice for an array shutdown? Do I need to manually stop all docker containers first? I cannot think of anything else that would have been running during unmount except maybe the file integrity plugin for hashing.


.png.ddd864c2ab756e9f160fac6b3094d914.png)
.png.107c4abdcab3b10a07be246cfb34e473.png)
.png.581c55200d97cf254e88cccab7936067.png)





