


chris_netsmart
Members
-
Joined
-
Last visited
Everything posted by chris_netsmart
-
I just tried to submit a ticket but it looks like there page is down. what a surprise.
-
Which opn files did you download. Fourth version ?
-
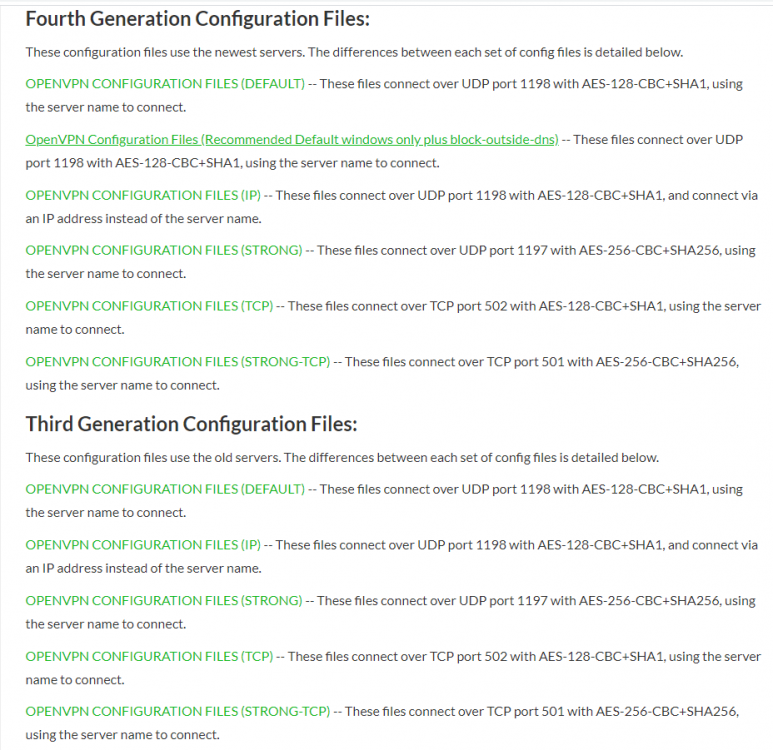
I have just gone to download the lastest files but I got confused. which one do I need to download ? form https://www.privateinternetaccess.com/helpdesk/kb/articles/where-can-i-find-your-ovpn-files
-
I have gone through the list with port forwarding and none of then are working, is there any update on the openVPN files
-
I have just tried 2 different hard drivers and they are all doing the same thing, they sping up with no issues, but none of them are spinning down. Aug 31 11:03:32 Tower unassigned.devices: Successfully mounted '/dev/sdk1' on '/mnt/disks/test'. Aug 31 11:03:32 Tower unassigned.devices: Issue spin down timer for device '/dev/sdk'. FUJITSU_MHV2120BH_PL_NW9XT7136T1D ntfs Aug 31 12:41:18 Tower unassigned.devices: Issue spin down timer for device '/dev/sdl'. Aug 31 12:41:18 Tower unassigned.devices: Issue spin down timer for device '/dev/sdl'. Aug 31 12:41:18 Tower unassigned.devices: Issue spin down timer for device '/dev/sdl'. TOSHIBA_MK5061GSYN_83GTT5C5T ntfs I am thinking could it be a Motherboard issue ? that i not allow it to spin down ? Update: encase anyone else i having issues - I have discovered for my setup the following XFS - Label Unassigned - No spin down BTRFS- Label Unassigned- Spin down exfat- Label Unassigned - Spin down NTFS- Label Unassigned - Spin down vfat- Label Unassigned -Spin down I used the same Hard Drive, a WD 500gb for my testing. so now for any unassigned drives I will be using the BTRFS Update: 6/9 I am sad to report that for some reason - the drive is no longer spinning down. so I will need to do some further work. NOTE I am also having issues with unraid OS that is not not showing CPU usage within the dashboard which might be related.
-
hi @dlandon thanks for your help so far. OK I think I am looking at the right log ' the syslog which can be found at /var/log/syslog ' I have opened this up and then open a Terminal season and type in the following command /usr/sbin/hdparm -S180 /dev/sdk I got a message information me that the drive will go into standby mode in 15 mins. but after this time the drive was still up and running looking at the log file, there is no reference from unassigned. I migh have been looking at the wrong log files, I just seen a log file for the Unassigned drive. Aug 28 17:13:47 Tower kernel: ata16: SATA max UDMA/133 abar m4096@0xf7908000 port 0xf7908280 irq 62 Aug 28 17:13:47 Tower kernel: ata16: SATA link up 6.0 Gbps (SStatus 133 SControl 300) Aug 28 17:13:47 Tower kernel: ata16.00: ATA-10: WDC WD40EFRX-68N32N0, WD-WCC7K2UY7A2J, 82.00A82, max UDMA/133 Aug 28 17:13:47 Tower kernel: ata16.00: 7814037168 sectors, multi 16: LBA48 NCQ (depth 32), AA Aug 28 17:13:47 Tower kernel: ata16.00: configured for UDMA/133 Aug 28 17:13:47 Tower kernel: sd 16:0:0:0: [sdk] 7814037168 512-byte logical blocks: (4.00 TB/3.64 TiB) Aug 28 17:13:47 Tower kernel: sd 16:0:0:0: [sdk] 4096-byte physical blocks Aug 28 17:13:47 Tower kernel: sd 16:0:0:0: [sdk] Write Protect is off Aug 28 17:13:47 Tower kernel: sd 16:0:0:0: [sdk] Mode Sense: 00 3a 00 00 Aug 28 17:13:47 Tower kernel: sd 16:0:0:0: [sdk] Write cache: enabled, read cache: enabled, doesn't support DPO or FUA Aug 28 17:13:47 Tower kernel: sdk: sdk1 Aug 28 17:13:47 Tower kernel: sd 16:0:0:0: [sdk] Attached SCSI disk Aug 28 17:14:04 Tower emhttpd: WDC_WD40EFRX-68N32N0_WD-WCC7K2UY7A2J (sdk) 512 7814037168 Aug 28 17:14:19 Tower unassigned.devices: Adding disk '/dev/sdk1'... Aug 28 17:14:19 Tower unassigned.devices: Mount drive command: /sbin/mount -t xfs -o rw,noatime,nodiratime '/dev/sdk1' '/mnt/disks/userbackup' Aug 28 17:14:19 Tower kernel: XFS (sdk1): Mounting V5 Filesystem Aug 28 17:14:19 Tower kernel: XFS (sdk1): Starting recovery (logdev: internal) Aug 28 17:14:19 Tower kernel: XFS (sdk1): Ending recovery (logdev: internal) Aug 28 17:14:19 Tower unassigned.devices: Successfully mounted '/dev/sdk1' on '/mnt/disks/userbackup'. Aug 28 17:14:19 Tower unassigned.devices: Issue spin down timer for device '/dev/sdk'. Aug 29 12:46:23 Tower unassigned.devices: Issue spin down timer for device '/dev/sdk'. Aug 29 12:46:23 Tower unassigned.devices: Unmounting '/dev/sdk1'... Aug 29 12:46:23 Tower unassigned.devices: Unmount cmd: /sbin/umount '/dev/sdk1' 2>&1 Aug 29 12:46:23 Tower kernel: XFS (sdk1): Unmounting Filesystem Aug 29 12:46:24 Tower unassigned.devices: Successfully unmounted '/dev/sdk1' Aug 29 17:27:09 Tower unassigned.devices: Adding disk '/dev/sdk1'... Aug 29 17:27:09 Tower unassigned.devices: Mount drive command: /sbin/mount -t xfs -o rw,noatime,nodiratime '/dev/sdk1' '/mnt/disks/userbackup' Aug 29 17:27:09 Tower kernel: XFS (sdk1): Mounting V5 Filesystem Aug 29 17:27:09 Tower kernel: XFS (sdk1): Ending clean mount Aug 29 17:27:09 Tower unassigned.devices: Successfully mounted '/dev/sdk1' on '/mnt/disks/userbackup'. Aug 29 17:27:09 Tower unassigned.devices: Issue spin down timer for device '/dev/sdk'. but we still have the green light
-
@dlandon Before I start chasing my own tail, I would like to confirm that the hard drive within in Unassigned should spin down, after a period of time of none use. The only hard drives that not spin down are SSD, but all other hard drivers, that is connected via SATA or USB should. And this also covers all manufactures.
-
Good afternoon I am sad to report that your update didn't work. I am on version Unassigned Devices 2020.08.29 and for Unassigned Devices Plus: 2020.05.22. I have tried un-mounted and then remounting the drive and each the the drive is still showing at active and not spinning down.

-
@dlandon for your referance. The drive and partitiom are both mounted. I have been thinking that at the moment the sata cable goes into a sata expension board. That this might be effecting it. So i am going to do some swopping around and get it onto a MB sata port. And then i will report back Update: ok I have place the SATA within a port on the motherboard and it still hasn't spindown. I also have check the settings within UA and this is set to Yes.
-
no it is a sata drive from WD.
-
@dlandon this will explain the SSD issue but not the other hard drive, which is a spinning drive.
-
Good Morning. I have gone through the fourms and I can't see this question being answered. like a lot of users here I have moved my Plex Docker data onto a SSD so speed up access time, when I am browsing through my Plex library but I have discovered that when my Plex is not in use and or if I turn off my Plex Docker, the SSD is still running. I have checked the settings and within UA it is set to spin down in 30 mins, but alse it don't As a test I also have added a second hard drive, and this also don't spin down. Is there a settings that I am missing, within unraid or UA that allows the disks to spin down after a set time of none activate.
-
has PIA release any new OpenVPN Config files ?
-
Thanks for the info. I had a feeling that it was not designed to look at two difference locations. What i will do is look at a script, and schedule and get it to copy the plex data into the appdata folder. here is the script I am using sudo docker stop PlexMediaServer - Stop Docker cp -r -p /mnt/disk4/* /mnt/disk8 - Copy from Plexdata to un-appdata daily 3am sudo docker start PlexMediaServer - Start Docker
-
First let me say that this is a good plugin and that it has saved my ass a few times. but I have a question. at the moment all my docker contenter information is stored in one place ' appdata folder ' that is stored in the cache, but I am about to move my Plex dockcker container out and onto a SSD. and this SSD with be connected via the Unassigned drive. so my question is. will the ' CA Backup / Restore Appdata ' plugin see this new location and backup my Plex data ?
-
For me sweden no longer works. But montreal is. This is becoming a pain. Changing my vpn every 5 mins.
-
Great, switched to Sweden from France & it's working fine now. thanks
-
Hope someone can help as I am pulling my hair out. I got home this afternoon and discovered that my Unraid was turned off, "power outage" so I power up and discovered that my Delugevpn was not working, I have checked all the settings and I can't find out what i wrong. during my testing it looks like everything works apart from my VPN, that I am able to use the Privoxy with no issues, I am able to download, but when I enable the the VPN I get the following error message This site can't be reached, but if I turn off the VPN then I am able to access it. I also discovered that when the VPN is turn on and I go into the console, and type in curl ifconfig.me/ip I get the an IP address from my VPN. can someone please help me in resolving this issue, ps. I am using the France server update. I just looked at my logs and I am getting this: info] Starting Deluge Web UI... reated by... ___. .__ .__ \_ |__ |__| ____ | |__ ____ ___ ___ | __ \| |/ \| | \_/ __ \\ \/ / | \_\ \ | | \ Y \ ___/ > < |___ /__|___| /___| /\___ >__/\_ \ \/ \/ \/ \/ \/ https://hub.docker.com/u/binhex/ 2020-07-31 07:27:49.851286 [info] System information Linux 988c501038b9 4.19.107-Unraid #1 SMP Thu Mar 5 13:55:57 PST 2020 x86_64 GNU/Linux 2020-07-31 07:27:49.877842 [info] OS_ARCH defined as 'x86-64' 2020-07-31 07:27:49.903810 [info] PUID defined as '99' 2020-07-31 07:27:49.934316 [info] PGID defined as '100' 2020-07-31 07:27:50.363320 [info] UMASK defined as '000' 2020-07-31 07:27:50.390297 [info] Permissions already set for volume mappings 2020-07-31 07:27:50.421909 [info] DELUGE_DAEMON_LOG_LEVEL defined as 'info' 2020-07-31 07:27:50.449086 [info] DELUGE_WEB_LOG_LEVEL defined as 'info' 2020-07-31 07:27:50.476288 [info] VPN_ENABLED defined as 'yes' 2020-07-31 07:27:50.509369 [info] OpenVPN config file (ovpn extension) is located at /config/openvpn/France.ovpn 2020-07-31 07:27:50.569269 [info] VPN remote line defined as 'remote france.privateinternetaccess.com 1198' 2020-07-31 07:27:50.596495 [info] VPN_REMOTE defined as 'france.privateinternetaccess.com' 2020-07-31 07:27:50.623768 [info] VPN_PORT defined as '1198' 2020-07-31 07:27:50.658012 [info] VPN_PROTOCOL defined as 'udp' 2020-07-31 07:27:50.685234 [info] VPN_DEVICE_TYPE defined as 'tun0' 2020-07-31 07:27:50.713661 [info] VPN_PROV defined as 'pia' 2020-07-31 07:27:50.738834 [info] LAN_NETWORK defined as '192.168.0.0/24' 2020-07-31 07:27:50.765984 [info] NAME_SERVERS defined as '209.222.18.222,84.200.69.80,37.235.1.174,1.1.1.1,209.222.18.218,37.235.1.177,84.200.70.40,1.0.0.1' 2020-07-31 07:27:50.795770 [info] VPN_USER defined as 'P2420957' 2020-07-31 07:27:50.829415 [info] VPN_PASS defined as 'Wa7chd1ce3st0lenDann3Wat3h' 2020-07-31 07:27:50.857389 [info] VPN_OPTIONS not defined (via -e VPN_OPTIONS) 2020-07-31 07:27:50.885146 [info] STRICT_PORT_FORWARD defined as 'yes' 2020-07-31 07:27:50.910273 [info] ENABLE_PRIVOXY defined as 'yes' 2020-07-31 07:27:50.939801 [info] ADDITIONAL_PORTS not defined (via -e ADDITIONAL_PORTS), skipping allow for custom incoming ports 2020-07-31 07:27:50.970733 [info] Deleting files in /tmp (non recursive)... 2020-07-31 07:27:50.995213 [info] Starting Supervisor... 2020-07-31 07:27:51,132 INFO Included extra file "/etc/supervisor/conf.d/delugevpn.conf" during parsing 2020-07-31 07:27:51,132 INFO Set uid to user 0 succeeded 2020-07-31 07:27:51,134 INFO supervisord started with pid 6 2020-07-31 07:27:52,137 INFO spawned: 'start-script' with pid 172 2020-07-31 07:27:52,138 INFO spawned: 'watchdog-script' with pid 173 2020-07-31 07:27:52,139 INFO reaped unknown pid 7 (exit status 0) 2020-07-31 07:27:52,144 DEBG 'start-script' stdout output: [info] VPN is enabled, beginning configuration of VPN 2020-07-31 07:27:52,144 INFO success: start-script entered RUNNING state, process has stayed up for > than 0 seconds (startsecs) 2020-07-31 07:27:52,144 INFO success: watchdog-script entered RUNNING state, process has stayed up for > than 0 seconds (startsecs) 2020-07-31 07:27:52,200 DEBG 'start-script' stdout output: [info] Default route for container is 172.17.0.1 2020-07-31 07:27:52,205 DEBG 'start-script' stdout output: [info] Adding 209.222.18.222 to /etc/resolv.conf 2020-07-31 07:27:52,211 DEBG 'start-script' stdout output: [info] Adding 84.200.69.80 to /etc/resolv.conf 2020-07-31 07:27:52,217 DEBG 'start-script' stdout output: [info] Adding 37.235.1.174 to /etc/resolv.conf 2020-07-31 07:27:52,223 DEBG 'start-script' stdout output: [info] Adding 1.1.1.1 to /etc/resolv.conf 2020-07-31 07:27:52,229 DEBG 'start-script' stdout output: [info] Adding 209.222.18.218 to /etc/resolv.conf 2020-07-31 07:27:52,234 DEBG 'start-script' stdout output: [info] Adding 37.235.1.177 to /etc/resolv.conf 2020-07-31 07:27:52,239 DEBG 'start-script' stdout output: [info] Adding 84.200.70.40 to /etc/resolv.conf 2020-07-31 07:27:52,244 DEBG 'start-script' stdout output: [info] Adding 1.0.0.1 to /etc/resolv.conf 2020-07-31 07:27:52,392 DEBG 'start-script' stdout output: [info] Attempting to load iptable_mangle module... 2020-07-31 07:27:52,392 DEBG 'start-script' stderr output: modprobe: FATAL: Module iptable_mangle not found in directory /lib/modules/4.19.107-Unraid 2020-07-31 07:27:52,393 DEBG 'start-script' stdout output: [warn] Unable to load iptable_mangle module using modprobe, trying insmod... 2020-07-31 07:27:52,394 DEBG 'start-script' stderr output: insmod: ERROR: could not load module /lib/modules/iptable_mangle.ko: No such file or directory 2020-07-31 07:27:52,394 DEBG 'start-script' stdout output: [warn] Unable to load iptable_mangle module, you will not be able to connect to the applications Web UI or Privoxy outside of your LAN 2020-07-31 07:27:52,394 DEBG 'start-script' stdout output: [info] unRAID/Ubuntu users: Please attempt to load the module by executing the following on your host: '/sbin/modprobe iptable_mangle' [info] Synology users: Please attempt to load the module by executing the following on your host: 'insmod /lib/modules/iptable_mangle.ko' 2020-07-31 07:27:52,415 DEBG 'start-script' stdout output: [info] Docker network defined as 172.17.0.0/16 2020-07-31 07:27:52,419 DEBG 'start-script' stdout output: [info] Adding 192.168.0.0/24 as route via docker eth0 2020-07-31 07:27:52,420 DEBG 'start-script' stdout output: [info] ip route defined as follows... 2020-07-31 07:27:52,420 DEBG 'start-script' stdout output: -------------------- 2020-07-31 07:27:52,422 DEBG 'start-script' stdout output: default via 172.17.0.1 dev eth0 2020-07-31 07:27:52,422 DEBG 'start-script' stdout output: 172.17.0.0/16 dev eth0 proto kernel scope link src 172.17.0.11 192.168.0.0/24 via 172.17.0.1 dev eth0 2020-07-31 07:27:52,422 DEBG 'start-script' stdout output: -------------------- 2020-07-31 07:27:52,479 DEBG 'start-script' stdout output: [info] iptables defined as follows... -------------------- 2020-07-31 07:27:52,480 DEBG 'start-script' stdout output: -P INPUT DROP -P FORWARD DROP -P OUTPUT DROP -A INPUT -s 172.17.0.0/16 -d 172.17.0.0/16 -j ACCEPT -A INPUT -i eth0 -p udp -m udp --sport 1198 -j ACCEPT -A INPUT -i eth0 -p tcp -m tcp --dport 8112 -j ACCEPT -A INPUT -i eth0 -p tcp -m tcp --sport 8112 -j ACCEPT -A INPUT -s 192.168.0.0/24 -i eth0 -p tcp -m tcp --dport 58846 -j ACCEPT -A INPUT -s 192.168.0.0/24 -d 172.17.0.0/16 -i eth0 -p tcp -j ACCEPT -A INPUT -p icmp -m icmp --icmp-type 0 -j ACCEPT -A INPUT -i lo -j ACCEPT -A INPUT -i tun0 -j ACCEPT -A OUTPUT -s 172.17.0.0/16 -d 172.17.0.0/16 -j ACCEPT -A OUTPUT -o eth0 -p udp -m udp --dport 1198 -j ACCEPT -A OUTPUT -o eth0 -p tcp -m tcp --dport 8112 -j ACCEPT -A OUTPUT -o eth0 -p tcp -m tcp --sport 8112 -j ACCEPT -A OUTPUT -d 192.168.0.0/24 -o eth0 -p tcp -m tcp --sport 58846 -j ACCEPT -A OUTPUT -s 172.17.0.0/16 -d 192.168.0.0/24 -o eth0 -p tcp -j ACCEPT -A OUTPUT -p icmp -m icmp --icmp-type 8 -j ACCEPT -A OUTPUT -o lo -j ACCEPT -A OUTPUT -o tun0 -j ACCEPT 2020-07-31 07:27:52,482 DEBG 'start-script' stdout output: -------------------- 2020-07-31 07:27:52,483 DEBG 'start-script' stdout output: [info] Starting OpenVPN... 2020-07-31 07:27:52,489 DEBG 'start-script' stdout output: Fri Jul 31 07:27:52 2020 WARNING: file 'credentials.conf' is group or others accessible Fri Jul 31 07:27:52 2020 OpenVPN 2.4.9 [git:makepkg/9b0dafca6c50b8bb+] x86_64-pc-linux-gnu [SSL (OpenSSL)] [LZO] [LZ4] [EPOLL] [PKCS11] [MH/PKTINFO] [AEAD] built on Apr 20 2020 Fri Jul 31 07:27:52 2020 library versions: OpenSSL 1.1.1g 21 Apr 2020, LZO 2.10 2020-07-31 07:27:52,489 DEBG 'start-script' stdout output: [info] OpenVPN started 2020-07-31 07:27:52,490 DEBG 'start-script' stdout output: Fri Jul 31 07:27:52 2020 NOTE: the current --script-security setting may allow this configuration to call user-defined scripts 2020-07-31 07:27:52,492 DEBG 'start-script' stdout output: Fri Jul 31 07:27:52 2020 CRL: loaded 1 CRLs from file [[INLINE]] 2020-07-31 07:27:52,492 DEBG 'start-script' stdout output: Fri Jul 31 07:27:52 2020 TCP/UDP: Preserving recently used remote address: [AF_INET]156.146.63.65:1198 2020-07-31 07:27:52,493 DEBG 'start-script' stdout output: Fri Jul 31 07:27:52 2020 UDP link local: (not bound) Fri Jul 31 07:27:52 2020 UDP link remote: [AF_INET]156.146.63.65:1198 2020-07-31 07:27:52,618 DEBG 'start-script' stdout output: Fri Jul 31 07:27:52 2020 [81d6289914f7e72adfa1f9a1fe98bb97] Peer Connection Initiated with [AF_INET]156.146.63.65:1198 2020-07-31 07:27:59,014 DEBG 'start-script' stdout output: Fri Jul 31 07:27:59 2020 TUN/TAP device tun0 opened Fri Jul 31 07:27:59 2020 /usr/bin/ip link set dev tun0 up mtu 1500 2020-07-31 07:27:59,015 DEBG 'start-script' stdout output: Fri Jul 31 07:27:59 2020 /usr/bin/ip addr add dev tun0 local 10.6.12.6 peer 10.6.12.5 2020-07-31 07:27:59,017 DEBG 'start-script' stdout output: Fri Jul 31 07:27:59 2020 /root/openvpnup.sh tun0 1500 1558 10.6.12.6 10.6.12.5 init 2020-07-31 07:27:59,027 DEBG 'start-script' stdout output: Fri Jul 31 07:27:59 2020 Initialization Sequence Completed 2020-07-31 07:27:59,144 DEBG 'start-script' stdout output: [info] Port forwarding is enabled [info] Checking endpoint 'france.privateinternetaccess.com' is port forward enabled... 2020-07-31 07:27:59,958 DEBG 'start-script' stdout output: [info] PIA endpoint 'france.privateinternetaccess.com' is in the list of endpoints that support port forwarding 2020-07-31 07:27:59,958 DEBG 'start-script' stdout output: [info] List of PIA endpoints that support port forwarding:- 2020-07-31 07:27:59,958 DEBG 'start-script' stdout output: [info] ca-toronto.privateinternetaccess.com [info] ca-montreal.privateinternetaccess.com [info] ca-vancouver.privateinternetaccess.com [info] de-berlin.privateinternetaccess.com [info] de-frankfurt.privateinternetaccess.com [info] sweden.privateinternetaccess.com [info] swiss.privateinternetaccess.com [info] france.privateinternetaccess.com [info] czech.privateinternetaccess.com [info] spain.privateinternetaccess.com [info] ro.privateinternetaccess.com [info] israel.privateinternetaccess.com 2020-07-31 07:27:59,959 DEBG 'start-script' stdout output: [info] Attempting to get dynamically assigned port... 2020-07-31 07:28:00,101 DEBG 'start-script' stdout output: [warn] Exit code '56' from curl != 0 or no response body received [info] 12 retries left [info] Retrying in 10 secs... 2020-07-31 07:28:10,159 DEBG 'start-script' stdout output: [warn] Exit code '56' from curl != 0 or no response body received [info] 11 retries left [info] Retrying in 10 secs... 2020-07-31 07:28:20,219 DEBG 'start-script' stdout output: [warn] Exit code '56' from curl != 0 or no response body received [info] 10 retries left [info] Retrying in 10 secs... ...and then it just repeats 2020-07-31 07:28:30,278 DEBG 'start-script' stdout output: [warn] Exit code '56' from curl != 0 or no response body received [info] 9 retries left [info] Retrying in 10 secs...
-
@Arindrew give me 24 hours and i will dig out my notes and.piat it for you. I do reminder that it is very easy. I just bet that you have over looked something. OK, I have check my notes and it looks like all I did was to install the Docker HDTemp then I when to the config file for Telegraf and locate the following # # Monitor disks' temperatures using hddtemp [[inputs.hddtemp]] # ## By default, telegraf gathers temps data from all disks detected by the # ## hddtemp. # # Only collect temps from the selected disks. # A * as the device name will return the temperature values of all disks. # ## address = "127.0.0.1:7634" ## devices = ["sda", "*"] then remove the ### that is in front of the [[Inputs.hddtemp]] then reboot Telegraf. once the docker is rebooted then go into Grafana and open your dashboard and add the HDTemp to your query. this works for me, and I would also like to point out that I telegraf don't have a IP address.
-
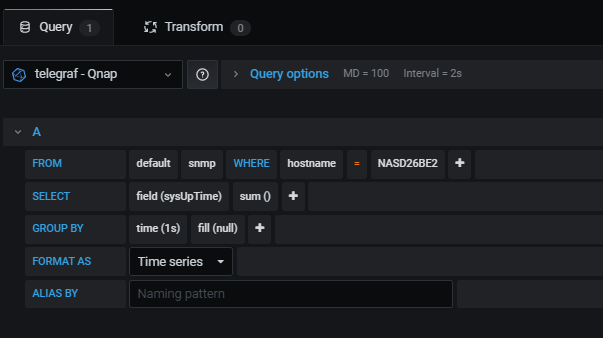
I am having a little problem, which I am trying to resolve, and getting a bit confused. I have done the snmpwalk command and got a long list of results from my QNAP. I have then gone through and located ' I think I have the right variables ' for the data which I want to capture. ## HOST-RESOURCES-MIB::hrSystemUptime.0 = Timeticks: (17473469) 2 days, 0:32:14.69 ## HOST-RESOURCES-MIB::hrSystemDate.0 = STRING: 2020-7-27,14:9:48.0,+0:0 ## HOST-RESOURCES-MIB::hrStorageUsed.33 = INTEGER: 86926 ## HOST-RESOURCES-MIB::hrStorageUsed.7 = INTEGER: 30400 now here is the bit I am not a 100% sure about, I have then gone to telegraf configure file and added the following code so that it knows were to go and collect the right information # # Retrieves SNMP values from remote agents [[inputs.snmp]] # ## Agent addresses to retrieve values from. agents = ["udp://192.168.0.100:161"] # QNAP # timeout = "5s" ## Timeout for each request. version = 2 ## SNMP version; can be 1, 2, or 3. community = "storage" ## SNMP community string. retries = 3 ## Number of retries to attempt. name = "snmp" # ############################################################################## ############################################################################## ############################################################################## # System uptime [[inputs.snmp.field]] name = "sysUpTime" oid = "HOST-RESOURCES-MIB::hrSystemUptime.0" # IF-MIB::ifTable contains counters on input and output traffic as well as errors and discards. [[inputs.snmp.table]] name = "interface" inherit_tags = [ "hostname" ] oid = "IF-MIB::ifTable" # Interface tag - used to identify interface in metrics database [[inputs.snmp.table.field]] name = "ifDescr" oid = "IF-MIB::ifDescr" is_tag = true # IF-MIB::ifXTable contains newer High Capacity (HC) counters that do not overflow as fast for a few of the ifTable counters [[inputs.snmp.table]] name = "interface" inherit_tags = [ "hostname" ] oid = "IF-MIB::ifXTable" # Interface tag - used to identify interface in metrics database [[inputs.snmp.table.field]] name = "ifDescr" oid = "IF-MIB::ifDescr" is_tag = true # EtherLike-MIB::dot3StatsTable contains detailed ethernet-level information about what kind of errors have been logged on an interface (such as FCS error, frame too long, etc) [[inputs.snmp.table]] name = "interface" inherit_tags = [ "hostname" ] oid = "EtherLike-MIB::dot3StatsTable" # Interface tag - used to identify interface in metrics database [[inputs.snmp.table.field]] name = "ifDescr" oid = "IF-MIB::ifDescr" is_tag = true update: I have found some working code that displays the amount of up time the Qnap has been running but at the moment, it is showing a number is is miles away from the real time. explain I just rebooted my Qnap and it shows that it has need running for 10 mins were as Grafana is saying it has been running for 4 days. is I don't understand here is also a screen shot my of my code within Grafana any ideals ? UPDATE: Found the solution. after a lot of reading you need to do the following in Grafana ( Add Math(/100) )

-
I have looked around but I can't find a way to do this, I have the Telegraf, InfluxDB and Grafana dockers that allow me to monitor my Unraid server, I also have the corsairpsu plugin that allows me to monitor my PSU usage but I would like to move this function into my Grafana. but I can't find any instructions on how to do this. is it possible ?
-
I hope that all helps. it is not as clean as spaceinvaderone videos but I think I have basics covered
-
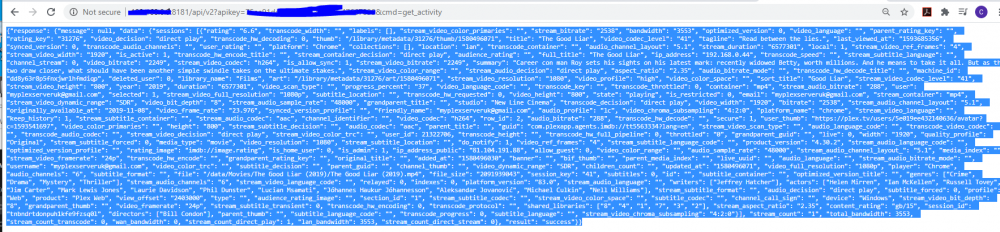
NOTE: I have taking information from 3rd Party websites and joined them together I have place the links and sites within his post. First we will set up Grafana and get it to monitor the Unraid environment requirements · running Docker service on your unRAID machine · Community Applications installed on your system · SSH access to your unRAID machine (alternatively, a file management application like Krusader or direct share access to your appdata folder) Used Software · InfluxDB - Database solution for storing all of our metrics. · Telegraf - Plugin-based metrics gathering software that will feed our metrics into InfluxDB for storage · Grafana - Metrics visualization software that will draw our dashboard Installation Part One: InfluxDB We'll be using InfluxDB as our database solution to save all the precious gathered metrics. 1. Go to your Apps section and search for "InfluxDB". 2. Install the InfluxDB Docker image by atribe. You don't have to make any changes to the settings except if you previously assigned port 8083 or 8086. If you have allocated ports 8083 or 8086 before, change those ports and make note of the change. Part Two: Telegraf We're using Telegraf to actually collect the metrics and send them to InfluxDB for storage. 1. Go to your Apps section and search for "Telegraf". 2. Install the Telegraf Docker image by atribe. We'll be using Telegraf, NOT unTelegraf (which does not use a configuration file but lets you change settings only by setting variables in the docker container configuration itself). Please remove the variable "HOST_MOUNT_PREFIX" in the installation overview. 3. After the installation go to your Docker section and stop the Telegraf docker. Download the telegraf.conf configuration file to your computer and open it with a text editor of your choice. 4. Navigate to the "Output Plugins" section in said config file and change the "urls" value under [[outputs.influxdb]] to your unRAID server's IP and port 8086 (or your chosen port number if you changed the InfluxDB settings). 5. In the same section, change the "database" name to "telegraf". 6. Navigate to the "Input Plugins" section. After "[[inputs.system]]", add "[[inputs.net]]" in a new line. This will enable network monitoring for all network interfaces. 7. If you want to monitor your docker containers, remove the # in front of [[inputs.docker]]. 8. If you would like to, you can change how often metrics are gathered in line 28 of the file under the section "Configuration for telegraf agent". The more frequently you gather metrics, the more CPU heavy Telegraf gets. I'd recommend 30 seconds. 9. Save the config file on one of your unRAID servers shares. Be careful to name it "telegraf.conf". Connect to your machine via SSH and move the "telegraf.conf" file from your user share to /mnt/user/appdata/telegraf. If a telegraf.conf file already exists, delete it and replace it with your file. 10. Restart Telegraf. From now on it should be feeding metrics into your running InfluxDB database. Part Three: Grafana Grafana will be our front-end, the piece of software you'll be observing all the metrics with. And since nobody likes staring at database tables to see CPU usage, we'll teach Grafana to draw some nice graphs with your collected metrics. 1. Go to your Apps section and search for "Grafana". 2. Install the Grafana Docker image by atribe. Set the GF_SERVER_ROOT_URL to your servers IP address (put http:// in front of it) and change GF_SECURITY_ADMIN_PASSWORD to a password of your liking. 3. After the installation go to Grafana's web UI (http://yourserverip:3000). Log in with the user name "admin" and your chosen password. You'll be greeted by your Home Dashboard. 4. Click on "Create your first data source". Give it a name, select InfluxDB as the type, enter http://YourServerIP:8086 for URL, set access to direct. Under InfluxDB Details set the database to telegraf. Save and test it. Grafana should now be connected to your InfluxDB database. Technical Ramblings screen shoots Download Unraid System Dashboard Next import the dashboard by hovering over the + icon and selecting Import local your Unraid System Dashboard click Load Give it a name and UID, select the database in the drop down and click Import. And now you should have a basic dashboard that is showing some information If not then click on one of the titles, and choose edit, And then choose change $telegrafdatasoruce to InfluxDB Servers So now well done you have Grafane working. Now for the Plex monitoring. Install the Tautulli docker and link it to your Plex Then install Varken Go to www.maxmind.com and create an account And follow the steps MaxMind (Required when using the Tautulli module): 1. Sign up for a MaxMind account. Make sure to verify the account. 2. Go to your Account, then Services > My License Key in the side menu, then click "Generate New License Key". 3. Enter a License key description, and select "No" for "Will this key be used for GeoIP Update?", then click "Confirm". 4. Copy the License Key and fill in the Varken config. For TautullI API go to the TautullI docker webGUI, click on Settings, then Web Interface and at the bottom, copy the API and copy it onto the Varken.ini file Go navigate to appdata\Varken folder And open the varken.example.ini You will need to modify the following https://github.com/Boerderij/Varken/wiki/Configuration change the numbers to false as we will not be using them copy your maxmind Licence Key Enter in your Unraid IP Address [global] sonarr_server_ids = false radarr_server_ids = false lidarr_server_ids = false tautulli_server_ids = 1 ombi_server_ids = false sickchill_server_ids = false unifi_server_ids = false maxmind_license_key = xxxxxxxxxxxxxxxx [influxdb] url = CHANGE THIS TO YOUR UNRAID SERVER IP port = 8086 ssl = false verify_ssl = false username = root password = root [tautulli-1] url = CHANGE THIS TO YOUR UNRAID SERVER IP:8181 fallback_ip = 1.1.1.1 apikey = xxxxxxxxxxxxxxxx ssl = false verify_ssl = false get_activity = true get_activity_run_seconds = 30 get_stats = true get_stats_run_seconds = 3600 restart Varken Test open your plex server and start streaming something open an explorer and type in http://YOUUNRAIDIPADDRESS:8181/api/v2?apikey=YOURTAUTULLIKEY&cmd=get_activity this should give you a page of information, Set up a new data source pointing to the varken database then Download this https://alexsguardian.net/2019/02/21/monitoring-your-media-server-with-varken/ and inport and lastly all you need to do is go through and change the data source in the new dashboard to point to varken. Referance Websites https://www.reddit.com/r/unRAID/comments/7c2l2w/howto_monitor_unraid_with_grafana_influxdb_and/ https://technicalramblings.com/blog/how-to-setup-grafana-influxdb-and-telegraf-to-monitor-your-unraid-system/ https://technicalramblings.com/blog/how-to-setup-grafana-influxdb-and-telegraf-to-monitor-your-unraid-system Plex Referance https://wiki.cajun.pro/books/varken/page/breakdown https://github.com/Boerderij/Varken/wiki/Configuration
-
@ashman70 if you are still looking on how to do the plex monitoring then I have resolve the issue. and got mine working. I will write up my notes and post them here before the weekend, if you are still interested
-
what a great little Docker, now I can house keep my dockers 🙂


