





greenflash24
Members
-
Joined
-
Last visited
Everything posted by greenflash24
-
Ich hatte bei meinem Server auch wöchentlich lockups aufgrund Docker container die per custom:br0 mittels macvlan angebunden waren. Seitdem ich auf ipvlan umgestellt habe, läuft mein System stabil mit einer Uptime von über 50 Tagen. Leider habe ich auch eine FritzBox im Einsatz, die mit dem ipvlan wohl nicht ganz klar kommt. Im Heimnetz sind alle IPs problemlos erreichbar, jedoch funktionieren nun einige Portfreigaben in der FritzBox nicht mehr und ich kann auch keine neuen mehr anlegen. Hat von euch zufällig jemand eine Idee, wie man container mit einer eigenen IP über custom:br0 mittels ipvlan sinnvoll an einer FritzBox nutzen kann, oder muss zwingend ein "vernünftiger" Router her?
-
@GuildDarts Just one quick question: Could this issue I'm having be related to your DockerFolders-Plugin: May you or somebody else with the DockerFolders-Plugin installed test if you are getting the same warning message before the array is started.
-
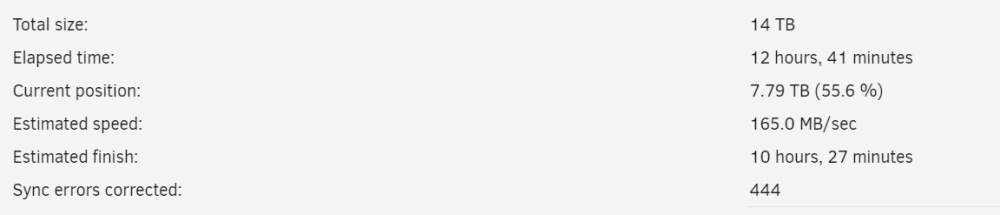
But if I look in the syslog of my second post I see the following: Nov 7 02:44:50 Home-Server kernel: md: recovery thread: PQ corrected, sector=10131125568 Nov 7 02:48:55 Home-Server kernel: md: recovery thread: PQ corrected, sector=10208980120 Nov 7 02:51:08 Home-Server kernel: md: recovery thread: PQ corrected, sector=10251646944 Nov 7 02:56:50 Home-Server kernel: md: recovery thread: PQ corrected, sector=10359425024 Nov 7 02:57:04 Home-Server kernel: md: recovery thread: PQ corrected, sector=10363971744 Nov 7 03:09:39 Home-Server kernel: md: recovery thread: PQ corrected, sector=10600788760 Nov 7 03:27:01 Home-Server kernel: md: recovery thread: PQ corrected, sector=10925648832 Nov 7 03:27:15 Home-Server kernel: md: recovery thread: PQ corrected, sector=10929617064 Nov 7 03:39:44 Home-Server kernel: md: recovery thread: PQ corrected, sector=11156873136 Nov 7 03:41:13 Home-Server kernel: md: recovery thread: PQ corrected, sector=11183558968 Nov 7 03:43:15 Home-Server kernel: md: recovery thread: PQ corrected, sector=11220069440 Nov 7 03:45:01 Home-Server kernel: md: recovery thread: PQ corrected, sector=11251872560 Nov 7 03:52:29 Home-Server kernel: md: recovery thread: PQ corrected, sector=11386424240 Nov 7 03:53:21 Home-Server kernel: md: recovery thread: PQ corrected, sector=11401817800 Nov 7 03:53:30 Home-Server kernel: md: recovery thread: PQ corrected, sector=11404475304 Nov 7 03:55:52 Home-Server kernel: md: recovery thread: PQ corrected, sector=11446669072 Nov 7 03:58:29 Home-Server kernel: md: recovery thread: PQ corrected, sector=11493457136 Nov 7 03:59:26 Home-Server kernel: md: recovery thread: PQ corrected, sector=11510510632 Nov 7 04:01:46 Home-Server kernel: md: recovery thread: PQ corrected, sector=11551985920 Nov 7 04:03:01 Home-Server kernel: md: recovery thread: PQ corrected, sector=11574569616 Nov 7 04:05:30 Home-Server kernel: md: recovery thread: PQ corrected, sector=11619463408 Nov 7 04:14:06 Home-Server kernel: md: recovery thread: PQ corrected, sector=11775728160 Nov 7 04:17:55 Home-Server kernel: md: recovery thread: PQ corrected, sector=11845403800 Nov 7 04:26:48 Home-Server kernel: md: recovery thread: PQ corrected, sector=12005106232 Nov 7 04:33:24 Home-Server kernel: md: recovery thread: PQ corrected, sector=12122775560 Nov 7 04:38:49 Home-Server kernel: md: recovery thread: PQ corrected, sector=12219312464 There I see "corrected"! So shouldn't these errors be corrected by the first parity check, which was according to the syslog indeed a correcting check. Also now until this point there are more sync errors found (and corrected ??) as in the last parity check: Maybe there are other issues which caused these parity invalidations 🤔 But what could these be?
-
Thank you a lot for your quick reply! That gives me some hope. So I will now wait until the currently running parity check (this time i have definitely checked the "correct parity" option) completes. After that I will rerun another parity check and given that there are no unforeseeable unclean shutdowns inbetween, parity should be valid and without any errors on this parity check. Okay, good to know that. I thought i have stopped the automatic parity check and restarted it with "correct parity" option enabled. Is there a way to see wether the last parity check was run with the "correct parity" option enabled or not?
-
@JorgeB Thanks for your help with my problem! I have tried switching my docker network type form macvlan to ipvlan. Unfortunately my consumer-grade router is not happy when the same physical network interface of the unraid host tried to get multiple IP addresses for the docker-containers, which have a static ip configured. This bricked my port-forwarding in my router, so that i could not use ipvlan as docker network type. -> Therefore i have switched it back to macvlan for now. I also did not have any problems with macvlan in the past on my system. Maybe there is another possible cause for these crashes, as in my initial crash i also did not see any kernel errors related to macvlan 🤔 But at this time I have another issue which worries me much more than "just" the crashes alone: As I have explained earlier I had to cut power to my server to regain control after the lockup, which resulted in an unclean shutdown. When the server was back up, a parity check has to be started. As it was an unclean shutdown, there were parity errors found, which should have been corrected. To my surprise there were a lot of parity errors found (>200 parity errors), which was a lot more then i had from unclean shutdowns in the past (there i had never more then 3 errors after a unclean shutdoen). Unfortunately i could not complete this parity check, as the system has locked up (this was the lockup descriped in my second post) at arround 70% of parity checking. So I rebooted (unclean) an rerun the parity check (with the option to correct the errors on parity enabled). Yesterday it finished after about 28 hours finding and correcting?? 426 errors. Later that day I have experienced an issue where /mnt/user/ was not available and i got the error "endpoint not connected". Probably this issue: Everything else was working this time, so I was able to capture diagnostics before i rebooted the server. (I can share the diagnostics for debugging but i would prefer to send them via PM and not have the diagnostics publicly available at the forum). This time I could shutdown all VMs and containers and i could stop the array without any problems. So this reboot should NOT be a unclean reboot. As i have restarted everything I wanted to run the parity check again, to see if my 426 parity errors disapperard and were fixed. At this time i am at ~ 45% of parity checking and there were 374 errors found until this point. How could this be?? Why has the parity check before my reboot not fixed these 426 errors? Should I be worried, that there are more problems, which caused these parity errors not getting corrected?
-
Today I have experieced my third crash, while beeing in the middle of a parity check correcting errors form the second crash which was yesterday. These crashes were on 6.10.0-rc2 to which I have upgraded after my first crash to see if it makes a difference. This time not only the WebGui was not accessible, but also the server would not respond to any pings. All VMs and Docker containers would also not respond this time. But ssh was working just fine. I tried to capture diagnostics this time via terminal, but no luck. I could only make a copy of /var/log/syslog to the array before my reboot, which could be investigated after the reboot. (See attachment syslog-2) I could really need some help with these lookups, as I do not fully understand form where they are comming from.
-
Yes, I do. Is this related?
-
I am getting the following error when my Unraid server is freshly started up. This error apperars with the array stopped (not started yet). Warning: stream_socket_client(): unable to connect to unix:///var/run/docker.sock (No such file or directory) in /usr/local/emhttp/plugins/dynamix.docker.manager/include/DockerClient.php on line 693 Couldn't create socket: [2] No such file or directory Warning: Invalid argument supplied for foreach() in /usr/local/emhttp/plugins/dynamix.docker.manager/include/DockerClient.php on line 877 After the array is started the warining message goes away. Do i have to worry about this warning? I would think this is a false positive, as the docker service is not started yet, as the array is also not started at this moment. So can i ignore it? I have first noticed this warning in 6.9.2, but it is still persistent in 6.10.3. This issue is probably caused by the Docker-Folders-Plugin. See also:
.thumb.png.de5a9f873000eb9979e0e38d9ba0d608.png)
-
Yes, I am also experiencing this bug in 6.10.0-rc2
-
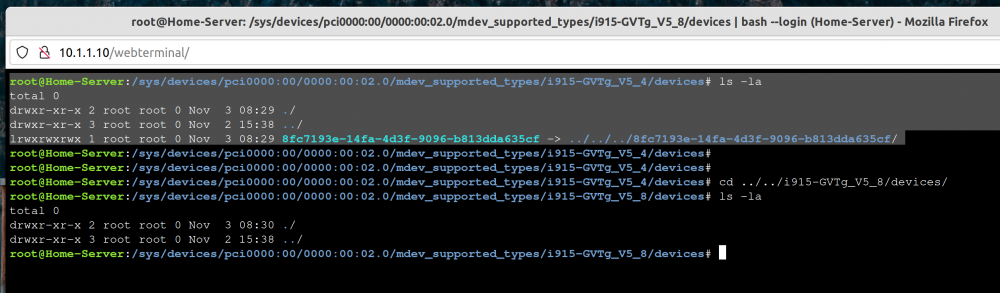
I have already done this on my last reboot, as I read in this thread that this might help. I could increase it to 1GB, which i have already done. Sadly I can not run more then 1 in v4 mode only in v8 mode, even when 1GB vram in BIOS is set.
-
Okay, that has fixed my issue and I can successfully start my VM now 😅 Thank you a lot for your help!
-
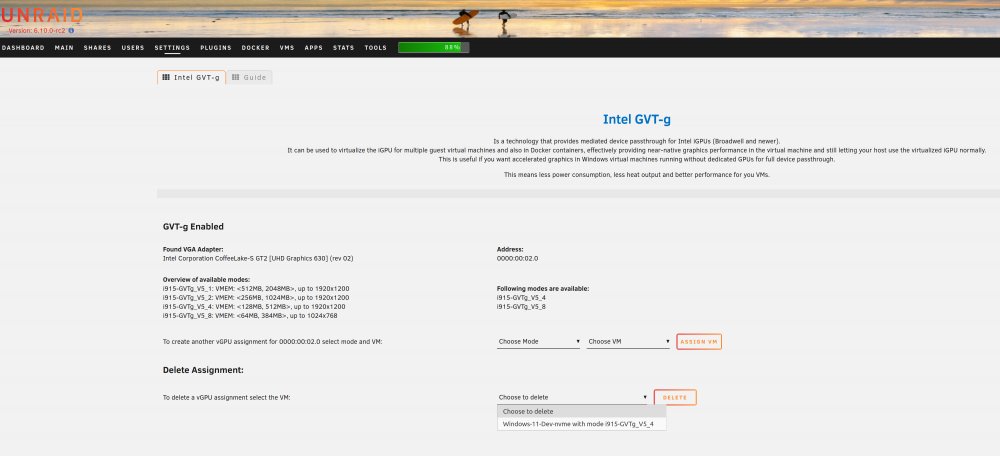
There could be the problem ... I do NOT have any VM running where i have a vgpu attached to it. I have just 2 linux servers running, but without a vgpu assignment. When I first experienced this issue, i thought it might help to delete all assignments and recreate them one by one. Currently I have only created the following assignment: And this VM is stopped because it wont start without the error. So no other VMs with a vgpu running. also not working

-
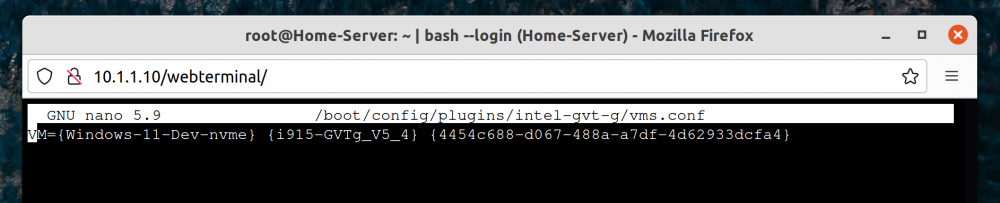
Here you go To me this also looks fairly normal.
-
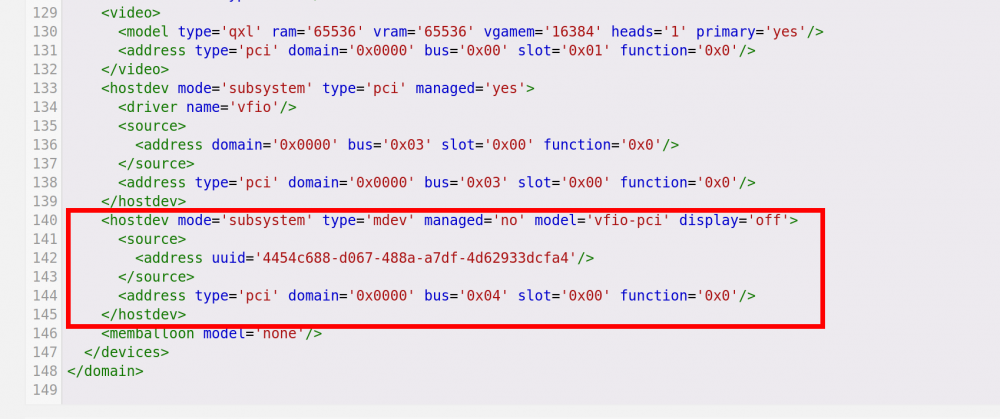
Sure, see here: and
-
After reassignment the the file looks like this (see qemu-after-assignment). And I am getting the following error after starting the VM:

-
Then the VM does start normally, the vgpu then is not available to the VM. That's why I thought this issue must be related with the gvt-g vgpu.
-
I have already tried this, but without any luck. I have also tried different modes but I had also no success.
-
Since I have upgraded my Unraid version from 6.9.2 to 6.10-rc2 i am experiencing the following issue when trying to start a VM with a gvt-g configuration: Does anybody else having simlar issues with 6.10-rc2?

-
Yesterday I had experienced a crash of the WebGUI from Unraid. Except the Webgui the server run fine, all docker containers were responsive and all VMs worked just fine. Only the WebGUI was not accessible. The Browser tried to load the WebGUI and after about 1-2 minutes unraid responded with a HTTP 500 Error. SSH access was possible, so i tried to shutdown all docker containers and VMs via comandline: docker stop $(docker ps -q) virsh shutdown domain I was not sure how to stop the array gracefully and perform a gracefull shutdown, but i tried poweroff. Unfortunately this was not the correct shutdown procedure via comandline, so i ended up with an unclean shutdown, which results a parity check. I managed to make a copy of /var/log/syslog to the array before my reboot, which could be investigated after the reboot. I already had a look into the syslog and i noticed some kernel BUGs / ERRORs (kernel NULL pointer dereference) at Oct 24 10:59:45, which was the time when the WebGUI stoped responding. (The full syslog file is attatched to this post). ... Oct 24 10:59:45 Home-Server kernel: BUG: kernel NULL pointer dereference, address: 0000000000000060 Oct 24 10:59:45 Home-Server kernel: #PF: supervisor read access in kernel mode Oct 24 10:59:45 Home-Server kernel: #PF: error_code(0x0000) - not-present page Oct 24 10:59:45 Home-Server kernel: PGD 1433d2067 P4D 1433d2067 PUD 7317d5067 PMD 0 Oct 24 10:59:45 Home-Server kernel: Oops: 0000 [#1] SMP NOPTI Oct 24 10:59:45 Home-Server kernel: CPU: 9 PID: 9434 Comm: lsof Tainted: G U W I 5.10.28-Unraid #1 Oct 24 10:59:45 Home-Server kernel: Hardware name: ASUSTeK COMPUTER INC. System Product Name/WS Z390 PRO, BIOS 1203 07/08/2021 Oct 24 10:59:45 Home-Server kernel: RIP: 0010:d_path+0x2f/0x127 Oct 24 10:59:45 Home-Server kernel: Code: 89 e5 53 48 83 ec 28 48 8b 7f 08 89 54 24 04 65 48 8b 04 25 28 00 00 00 48 89 44 24 20 31 c0 48 63 c2 48 01 f0 48 89 44 24 08 <48> 8b 47 60 48 85 c0 74 21 48 8b 40 48 48 85 c0 74 18 48 3b 7f 18 Oct 24 10:59:45 Home-Server kernel: RSP: 0018:ffffc90024497d60 EFLAGS: 00010296 Oct 24 10:59:45 Home-Server kernel: RAX: ffff88869ec17000 RBX: ffff888108c84780 RCX: 0000000000000264 Oct 24 10:59:45 Home-Server kernel: RDX: 0000000000000d9c RSI: ffff88869ec16264 RDI: 0000000000000000 Oct 24 10:59:45 Home-Server kernel: RBP: ffffc90024497d90 R08: ffff88874f628968 R09: ffff88874f628968 Oct 24 10:59:45 Home-Server kernel: R10: 0000000005f5e100 R11: 0000000000000001 R12: ffffffff81ddbf16 Oct 24 10:59:45 Home-Server kernel: R13: ffff888168b5bb80 R14: ffff888101082280 R15: ffff888101082258 Oct 24 10:59:45 Home-Server kernel: FS: 000014fd34967540(0000) GS:ffff889feec40000(0000) knlGS:0000000000000000 Oct 24 10:59:45 Home-Server kernel: CS: 0010 DS: 0000 ES: 0000 CR0: 0000000080050033 Oct 24 10:59:45 Home-Server kernel: CR2: 0000000000000060 CR3: 00000007517fc001 CR4: 00000000003726e0 Oct 24 10:59:45 Home-Server kernel: DR0: 0000000000000000 DR1: 0000000000000000 DR2: 0000000000000000 Oct 24 10:59:45 Home-Server kernel: DR3: 0000000000000000 DR6: 00000000fffe0ff0 DR7: 0000000000000400 Oct 24 10:59:45 Home-Server kernel: Call Trace: Oct 24 10:59:45 Home-Server kernel: ? seq_put_decimal_ull_width+0x63/0x79 Oct 24 10:59:45 Home-Server kernel: seq_path+0x42/0x90 Oct 24 10:59:45 Home-Server kernel: show_map_vma+0x7a/0x12f Oct 24 10:59:45 Home-Server kernel: show_map+0x5/0x8 Oct 24 10:59:45 Home-Server kernel: seq_read_iter+0x260/0x339 Oct 24 10:59:45 Home-Server kernel: seq_read+0xf3/0x116 Oct 24 10:59:45 Home-Server kernel: vfs_read+0xa0/0xff Oct 24 10:59:45 Home-Server kernel: ksys_read+0x71/0xba Oct 24 10:59:45 Home-Server kernel: do_syscall_64+0x5d/0x6a Oct 24 10:59:45 Home-Server kernel: entry_SYSCALL_64_after_hwframe+0x44/0xa9 Oct 24 10:59:45 Home-Server kernel: RIP: 0033:0x14fd3488778e Oct 24 10:59:45 Home-Server kernel: Code: c0 e9 f6 fe ff ff 50 48 8d 3d 16 5e 0a 00 e8 f9 fd 01 00 66 0f 1f 84 00 00 00 00 00 64 8b 04 25 18 00 00 00 85 c0 75 14 0f 05 <48> 3d 00 f0 ff ff 77 5a c3 66 0f 1f 84 00 00 00 00 00 48 83 ec 28 Oct 24 10:59:45 Home-Server kernel: RSP: 002b:00007ffe8e7e54f8 EFLAGS: 00000246 ORIG_RAX: 0000000000000000 Oct 24 10:59:45 Home-Server kernel: RAX: ffffffffffffffda RBX: 00000000004292c0 RCX: 000014fd3488778e Oct 24 10:59:45 Home-Server kernel: RDX: 0000000000001000 RSI: 0000000000488210 RDI: 0000000000000004 Oct 24 10:59:45 Home-Server kernel: RBP: 000014fd3495d420 R08: 0000000000000004 R09: 0000000000000000 Oct 24 10:59:45 Home-Server kernel: R10: 0000000000000000 R11: 0000000000000246 R12: 00000000004292c0 Oct 24 10:59:45 Home-Server kernel: R13: 000014fd3495c820 R14: 0000000000000d68 R15: 0000000000000d68 ... WebGUI stops responding: Oct 24 11:02:01 Home-Server nginx: 2021/10/24 11:02:01 [error] 13535#13535: *213870 upstream timed out (110: Connection timed out) while reading response header from upstream, client: 10.1.1.58, server: , request: "POST /webGui/include/DashUpdate.php HTTP/2.0", upstream: "fastcgi://unix:/var/run/php5-fpm.sock", host: "10.1.1.10", referrer: "https://10.1.1.10/Dashboard" Oct 24 11:02:17 Home-Server nginx: 2021/10/24 11:02:17 [error] 13535#13535: *213870 upstream timed out (110: Connection timed out) while reading response header from upstream, client: 10.1.1.58, server: , request: "POST /webGui/include/DashUpdate.php HTTP/2.0", upstream: "fastcgi://unix:/var/run/php5-fpm.sock", host: "10.1.1.10", referrer: "https://10.1.1.10/Dashboard" Oct 24 11:02:33 Home-Server nginx: 2021/10/24 11:02:33 [error] 13535#13535: *214147 upstream timed out (110: Connection timed out) while reading response header from upstream, client: 10.1.1.58, server: , request: "POST /webGui/include/DashUpdate.php HTTP/2.0", upstream: "fastcgi://unix:/var/run/php5-fpm.sock", host: "10.1.1.10", referrer: "https://10.1.1.10/Dashboard" Oct 24 11:02:49 Home-Server nginx: 2021/10/24 11:02:49 [error] 13535#13535: *214147 upstream timed out (110: Connection timed out) while reading response header from upstream, client: 10.1.1.58, server: , request: "POST /webGui/include/DashUpdate.php HTTP/2.0", upstream: "fastcgi://unix:/var/run/php5-fpm.sock", host: "10.1.1.10", referrer: "https://10.1.1.10/Dashboard" Oct 24 11:03:05 Home-Server nginx: 2021/10/24 11:03:05 [error] 13535#13535: *214426 upstream timed out (110: Connection timed out) while reading response header from upstream, client: 10.1.1.58, server: , request: "POST /webGui/include/DashUpdate.php HTTP/2.0", upstream: "fastcgi://unix:/var/run/php5-fpm.sock", host: "10.1.1.10", referrer: "https://10.1.1.10/Dashboard" Oct 24 11:03:21 Home-Server nginx: 2021/10/24 11:03:21 [error] 13535#13535: *214426 upstream timed out (110: Connection timed out) while reading response header from upstream, client: 10.1.1.58, server: , request: "POST /webGui/include/DashUpdate.php HTTP/2.0", upstream: "fastcgi://unix:/var/run/php5-fpm.sock", host: "10.1.1.10", referrer: "https://10.1.1.10/Dashboard" Oct 24 11:03:37 Home-Server nginx: 2021/10/24 11:03:37 [error] 13535#13535: *214426 upstream timed out (110: Connection timed out) while reading response header from upstream, client: 10.1.1.58, server: , request: "POST /webGui/include/DashUpdate.php HTTP/2.0", upstream: "fastcgi://unix:/var/run/php5-fpm.sock", host: "10.1.1.10", referrer: "https://10.1.1.10/Dashboard" Oct 24 11:03:53 Home-Server nginx: 2021/10/24 11:03:53 [error] 13535#13535: *214711 upstream timed out (110: Connection timed out) while reading response header from upstream, client: 10.1.1.58, server: , request: "POST /webGui/include/DashUpdate.php HTTP/2.0", upstream: "fastcgi://unix:/var/run/php5-fpm.sock", host: "10.1.1.10", referrer: "https://10.1.1.10/Dashboard" Oct 24 11:04:09 Home-Server nginx: 2021/10/24 11:04:09 [error] 13535#13535: *214711 upstream timed out (110: Connection timed out) while reading response header from upstream, client: 10.1.1.58, server: , request: "POST /webGui/include/DashUpdate.php HTTP/2.0", upstream: "fastcgi://unix:/var/run/php5-fpm.sock", host: "10.1.1.10", referrer: "https://10.1.1.10/Dashboard" Oct 24 11:04:23 Home-Server dhcpcd[2045]: br0: Router Advertisement from fe80::3a10:d5ff:fe7e:50c4 Oct 24 11:04:25 Home-Server nginx: 2021/10/24 11:04:25 [error] 13535#13535: *214711 upstream timed out (110: Connection timed out) while reading response header from upstream, client: 10.1.1.58, server: , request: "POST /webGui/include/DashUpdate.php HTTP/2.0", upstream: "fastcgi://unix:/var/run/php5-fpm.sock", host: "10.1.1.10", referrer: "https://10.1.1.10/Dashboard" ... So now my question(s): - Is this anything i have to worry about, or was this probably a one time crash of the WebGUI? - If this happens again, how can I perform a clean shutdown? -> is there a comandline command for stopping the array gracefully (or to force stop the array) -> how do I reboot my server gracefully via SSH -> Can the WebGUI be restarted via SSH - What are these Kernel BUGs in the syslog? Was this the cause of the WebGUI crashing? I would appreciate any help on this topic. syslog.txt
-
I have created a fork of the linuxserver container, and i will try to maintain this container in the future (at least until the builds break again). Therefore I and others can have security fixes for a bit longer at least. You can find a mirror of my fork here: https://github.com/fabianbees/docker-openvpn-as Docker images will be pushed here: https://hub.docker.com/r/fabianbees/openvpn-as I have not found time yet to update the Readme.md and change the dockerimage to point to my image instad of the linuxserver one, but this will be done in the future. As i don't use jenkins in my homelab i just added some build-scrips, so i can build this image with gitlab-ci on my private gitlab instance. -> UPDATE: I have added a disclaimer at the top of the readme.md and removed all references to the linuxserver team i have found so far, so that it is clear, that these builds are not related to them. For now my image has the latest version of openvpn-as, which is version 2.9.2 at this time. (Linuxserver has 2.9.0) If you want to switch to my docker image, you can do so my changing the image-repository in unraid from linuxserver/openvpn-as to fabianbees/openvpn-as But please make a backup of your appdata first, before changing to the new image just in case something goes wrong.
-
I have observed, that the layout in the "Advanced View" is not what is is supposed to be, when a container is installed, which has a very long repository name. When this is the case, the Container-ID is not displayed below the container name and picture anymore instead it shows up on the right. (See screenshots below.) This issue was tested with Google Chrome and Microsoft Edge in Version 90.x.x. To recreate this issue, simply run my hello-world container, which i have given a very long name. Then have a look at the Docker Page. docker run --rm fabianbees/a-simple-hello-world-example-with-an-extra-ultra-super-duper-long-name-for-showing-an-unraid-ui-layout-error:latest This is how it should look like: (Container-ID below the container name and picture) When a container with a very long image name is present it looks as follows: (Container-ID on the right hand side of the container name and picture) A simple fix could be to remove the display: inline; CSS from the class="advanced". This can be replicated with the Dev-Tools in the browser. Then all is displayed normally but the long image name isn't visible any more (but thats a better solution than the current behavior). Best solution would be to concat a long image name after a specifed width and show three dots at the end (e.g. long-name...).
-
Does anybody know, how to get the new so called "high Performace backend" to work, which is one of Nextclouds 21 features? After some research i found, that this Plugin needs to be installed and set up: https://github.com/nextcloud/notify_push But I was not able to get it to work inside of this LinuxServer Docker container, because it said that this installation is not using systemd, which makes sense as this is a Docker conatainer. But what is the process for setting up this pluging in a Docker conatiner?
-
Of course, here you go: { "period": { "duration": 0.030292, "unit": "ms" }, "frequency": { "requested": 0.000000, "actual": 0.000000, "unit": "MHz" }, "interrupts": { "count": 0.000000, "unit": "irq/s" }, "rc6": { "value": 95.507065, "unit": "%" }, "power": { "value": 0.000000, "unit": "W" }, "imc-bandwidth": { "reads": 34.253191, "writes": 12.089361, "unit": "MiB/s" }, "engines": { "Render/3D/0": { "busy": 0.000000, "sema": 0.000000, "wait": 0.000000, "unit": "%" }, "Blitter/0": { "busy": 0.000000, "sema": 0.000000, "wait": 0.000000, "unit": "%" }, "Video/0": { "busy": 0.000000, "sema": 0.000000, "wait": 0.000000, "unit": "%" }, "VideoEnhance/0": { "busy": 0.000000, "sema": 0.000000, "wait": 0.000000, "unit": "%" } } }, { "period": { "duration": 250.577540, "unit": "ms" }, "frequency": { "requested": 0.000000, "actual": 0.000000, "unit": "MHz" }, "interrupts": { "count": 0.000000, "unit": "irq/s" }, "rc6": { "value": 100.000000, "unit": "%" }, "power": { "value": 0.000000, "unit": "W" }, "imc-bandwidth": { "reads": 183.204454, "writes": 33.909700, "unit": "MiB/s" }, "engines": { "Render/3D/0": { "busy": 0.000000, "sema": 0.000000, "wait": 0.000000, "unit": "%" }, "Blitter/0": { "busy": 0.000000, "sema": 0.000000, "wait": 0.000000, "unit": "%" }, "Video/0": { "busy": 0.000000, "sema": 0.000000, "wait": 0.000000, "unit": "%" }, "VideoEnhance/0": { "busy": 0.000000, "sema": 0.000000, "wait": 0.000000, "unit": "%" } } }
-
@b3rs3rk I have just tried your new intel version on my i9 9900k with UHD 630 graphics and everything is working just fine. Thanks a lot for this update.
-
I have also experienced this exact issue and could resolve it also through mounting the above mentioned Paths. Only difference for me is that i have altered the Host Paths to the Unraid /tmp Dir so i am using the RAM and not the Cache drive for the Temp files. Therefore my writes on the cache drive are not as high. Host Path: /tmp/nextcloud/ and Host Path: /tmp/swag/

.png.016c376c7ea485456b824e7a84362635.png)




