FreeMan
Members
-
Joined
-
Last visited
Everything posted by FreeMan
-
Sorry if this has been addressed - I was lazy and didn't read all 18 pages... Is anyone aware of this issue https://github.com/Koenkk/zigbee2mqtt/issues/8663 that is apparently a driver bug and requires a kernel update to fix? It seems to cause various ZigBee related issues, though not specifically related to MQTT...
-
Well, that does seem to have done the trick. This, fortunately, seems to have been unnecessary. I know it's not a big deal to delete the img and start over, but why mess if I don't have to... Joy... I've got another disk throwing some CRC errors, too. Don't really want to have to replace 2 drives at the same time. The spinning disk started throwing errors after I physically moved the server just a bit while it was running. It could be as simple as a able is a smidge loose. That's what I'm counting on, anyway. Unfortunately, my plan for an easy to access setup isn't as easy as I thought it would be, so it's a bit of a pain to get to the server now. I do need to shut it down and double check all the cables. I just need to muster the oomph to do it.
-
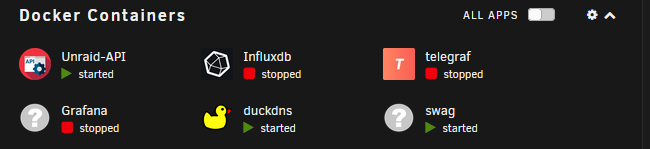
Additionally, some of the dockers have a Question mark symbol instead of their usual icon:
-
I ran out of cache disk space - my fault! I'm clearing unnecessary files and fixing configs so it doesn't happen again. However, various dockers won't respond, and attempting to restart them gives an Error 403. I'm now at 63% cache space utilization, so there shouldn't be any issues there. nas-diagnostics-20210917-0712.zip Is this simply a case of reboot the server or are there other trouble shooting tips I should try first?
-
Well, my problem is fixed! We just had the AC replaced and while they were doing it, I had them install a new vent in my office right in front of my server. With a steady dose of cooled air blowing up its skirt, the server temps stayed sane and I had 2 drives occasionally hit 40°C, but nothing higher during a parity check. Of course, I'll have to get a cover for heating season because I don't want to cook the server, but it'll run nice and frosty now during the summer.
-
I moved them as I've been doing for ages. I've gone back and forth between using cache and not, but don't recall having run into this before. Based on your question, I copied them from the array to the cache-based temp directory, deleted them from the array, copied them back from cache to the array and deleted them from Cache. Now there are no file on cache. Thanks! Thanks. I have been very much aware of the "don't cross the streams" admonition for years. Since I'm using Krusader and both directory windows work from "/media" I assumed (with all inherent danger, obviously) that it would work properly since it's always worked that way in the past. I guess I know better now, and will be sure to "copy/delete" instead of "move" from here on out.
-
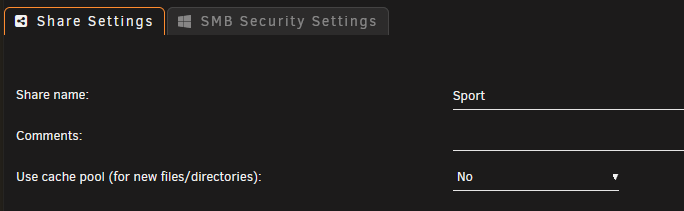
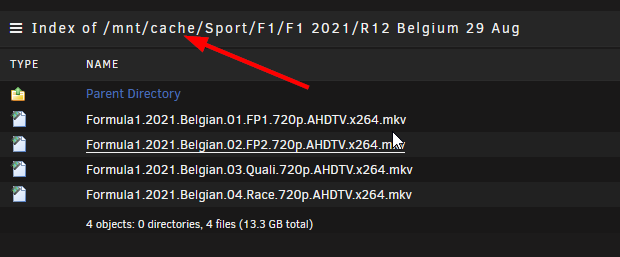
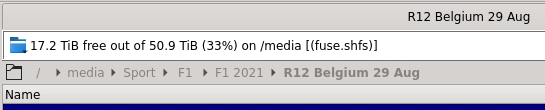
I received a warning from Fix Common Problems that I have files on my cache drive for a share that's set to not use cache. Here's the config for the "Sport" share: Browsing the cache pool shows that recent files are there for the Sport share: I copied the files from a temp directory (on Cache) to the Sport share using Krusader. Here's the path as reported by Krusader: And here is the mapping for /media from the Krusader config: Why is Krusader writing these files to the cache pool instead of waking up the drive (if necessary) and writing them directly to the array? nas-diagnostics-20210830-1450.zip

-
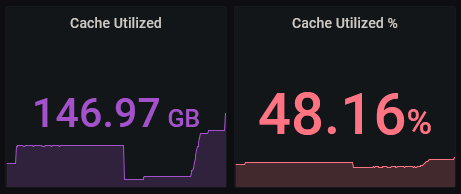
Just for fun, today, the Cache Utilized Percentage is almost right, but the actual amount used is off. 175GB out of 360 is 48.61%. 147GB out of 360 is 40.83%. So either the math is wrong or it's not finding all 360GB of available cache space.

-
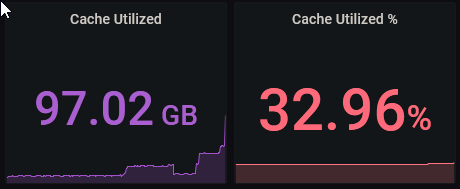
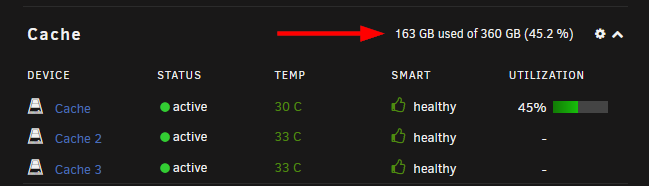
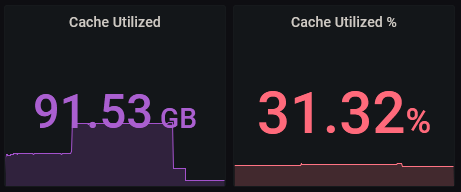
This had, initially, fixed the display issue. However, it's back. These were from yesterday: And this is from this morning: No amount of adjusting the time frame will cause the Grafana reported utilization to get back in sync with the WebGUI. To address the other issues noted in your original response: * The mover is running at 01:10. It is currently 06:56, it's long since completed its task, the first shots were from sometime after noon yesterday * As noted previously, the query is pulling `"path" = '/mnt/cache'`. If you have a specific recommendation on how to modify it to pull in the 3 individual drives that make up the cache pool, I'll be happy to make that mod to see if it makes a difference. I suppose this isn't critical, as UUD is a nice addition, and I'm relying on the WebGUI being accurate as the last word, however, it's mildly annoying. I'm willing to test out suggestions, but I'm not going to be heavily digging into finding a solution myself. I'd like to say that this is a recent change (though I don't believe I've changed anything in either my UNRAID or Grafana setups that would have caused this), but it may well have been off from day one and I just never noticed. Out of curiosity, I just loaded UUD v1.5 and it is reporting the same incorrect number that v1.6 is, so this is probably nothing new.

-
If the plugin was ever updated (I'm guessing not since the newest version I see is 2.0.0 and my plugin is dated 2018.02.11), your changes don't seem to have worked for me. I have auto updates turned on, but don't recall having seen the change come through (doesn't mean it didn't, just that I don't recall). My speed tests have been reliably failing before & since your post. I appreciate your efforts and hope that it does get updated! The V0.3.4 change appears to be working for me as well. A manual test functions, now to wait for my regularly scheduled test to ensure all is good. Thank you for this work-around!
-
Have you notified whoever asked you to post diagnostics that they are up here? Maybe describe the issues you're having in more detail and someone else may be able to take a look. Most modern CPUs will throttle back if they get too hot, and will probably shut the computer down if temps continue to go up. You'd probably need to look at the docs for your mother board to determine if it has that feature and where in the BIOS settings it may be. The Parity Check Tuning plugin can be set to pause a parity check or disk rebuild if disk temps get too hot, but it won't shut down the whole server.
-
That is one. I wasn't aware of any, but figured they'd have a report somewhere. It is decidedly inconclusive. The first thing I noted was their extremely cool temps - the min temps any of my drives report in SMART history is about 30°C (86°F). Right now my "server room" is about 25°C (77F) and I've got drives spinning between 36-44°C. My SSDs are always reporting either 30 or 33C (1 @ 30, 2 @33). They never change (makes me a bit suspicious, but they're cool enough I'm not concerned). In general, it seems that occasionally hitting 50°C isn't quite the "instant death" I was initially fearing, but it is best if they don't get that toasty.
-
Interesting, I set the time frame to 1 hour and it sync'd the numbers. I set it back to 24 hr and it remained correct. I'm not sure where in the query I would need to make modifications, since it's selecting on "path" = '/mnt/cache'. I do have all 3 drives in the pool specified in the Cache Drive(s) drop down at the top of the page. And I don't care about the multiple images enough to be bothered, but thanks for the tip!
-
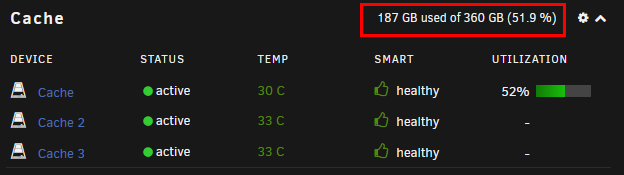
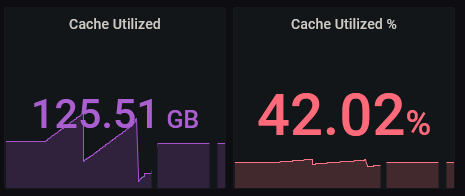
I've just noticed an interesting inconsistency. As reported by the WebGUI: As reported by UUD: I know that the UUD is only refreshing every 30 seconds, but trust me, my system is NOT capable of writing 62GB to the cache drives in 30 seconds. Forgive this second image. I've tried deleting it twice, but it persists...
-
After a brief DuckDuckGo search... Here's an undated PDF from Icy Dock with scary warnings about how heat kills drives. Of course, they want to sell you their docks to keep your drives cool, so one should take it with a grain of salt. Here's a 2020 page from ACKP claiming that "prolonged operation at temperatures under 20°C (68°F) or above 50°C (122°F)" will shorten a drive's lifespan. Of course, they want to sell you cooling solutions for your NOC, so there's a grain of salt with this one, too. Both of those actually reference the same white paper from National Instruments, so there is at least some credibility (or, at least, consistency) to them. The NI paper states: Of course, NI wants to sell you their hardware for running tests on your equipment, and they want to sell you the "extended life" option if your conditions are outside those ranges, so again, a grain of salt. Finally, I found a Tom's Hardware story from 2007 reporting on a Google Labs research paper (404, I couldn't find it at the Wayback Machine, maybe it's me). Tom's summary indicates that heat is a factor, but not the only or even biggest factor in drive death. According to their summary, Google didn't (yet) have any particular parameters that were credible in predicting drive death. It does, however, mention that drives operating in cooler temperatures did seem to die more frequently than drives operating hotter and that only at "very high" temps did the trend reverse. Tom's quotes may very well be the source of a lot of the conventional wisdom at this board: Once a drive is past the infant mortality stage (about 6 months of high activity), death rate drops until about 5 years have passed Age alone isn't necessarily a factor, after 3 years, death rate stabilizes at about 8% Drives with SMART scan errors show a 10x likelihood of dying of those that don't have scan errors While 85% of drives with one reallocation error survive more than 8 months after the error, the overall death rate is 3-6x higher after the first allocation error than those without errors 56% of all their drive failures had no SMART warnings at all. All in all, it sounds like drive temp isn't the worst thing. All the things I found (again, just a quick scan) said that up to 50°C operating temp is OK. Of course, cooler is going to be better, but you don't want the drive reaching for a sweatshirt, either. I still haven't found anything from BackBlaze, and they seem to be the preferred go-to for drive life metrics. Wonder if they do have anything on causes of failure, or just statistics...
-
This is more on line with what I believed and understood, but I've certainly got no proof one way or the other. Thank you for your input. I wonder if anybody has done /can find some research on what effect temp really has on drive lifespan. Sounds like something BackBlaze might have. I may see if they've got something. Sent from my moto g(7) using Tapatalk
-
Interesting, and thanks for the feedback @Hoopster. I just don't think I'd ever seen a drive hit above about 40-41°C before, even during a parity check. I've got 5-in-3 cages, and this is the first time in quite a while that I've actually had 4 drives in any one cage. I've seen some comments about the IronWolf running hot, so maybe with it running hot and 4 drives (even though it was next to a drive that wasn't part of the array and spun down), the whole mess was just hotter than I'm used to. I'd still welcome other's input, feedback, comments.
-
How hot is too hot for hard drives? I just finished rebuilding a drive in my array, and the brand new Seagate Iron Wolf was consistently hitting 46°C. I was using Parity Check Tuning to pause the rebuild, so that's about as hot as it got, but it spent 3 days bouncing between about 42-46°. I understand that different drives may have different operating conditions spec'd by the manufacturer (Seagate says up to 65° for the IronWolf), but what's a "reasonable" and "sensible" number? At what point should I worry about shutting things down to prevent drive damage?
-
Due to overheating issues, my data disk rebuild is pausing (using Parity Check Tuning) when drives get too hot. * At 00:21 this morning, the rebuild was paused due to heat at 57.7% complete * At 00:30 the normally scheduled parity check was initiated by the scheduler * At 00:35 the parity check (which does seem to be rebuilding the data) paused again due to temperatures, now at 0.4% complete. Screenshots of the Pushover notifications showing this: I reported this in the General forum where JorgeB confirmed the issue by manually pausing a check on a test system without PCT installed, confirming it's a bug in the base Parity Check launch logic allowing the check to restart a running, but paused check or (much more critically) rebuild. (Also, I pointed out the "%%" typo and itimpi is going to fix that in PCT). I agree with JorgeB that this is something of an edge case, but, for those running with single parity and on not the highest-end hardware, it does extend the "at risk" time running one drive down. I'm glad I was "only" at 58% complete, not 90+% complete - that would have been extremely frustrating! The diagnostics from when I discovered the problem earlier today. nas-diagnostics-20210701-0749.zip
-
(Originally posted for support) The Parity-Sync/Data-Rebuild button text toggles between "Pause" and "Resume", depending on the state of the currently running parity check. Using the Parity Check Tuning parameters, I have my parity check (actually a data rebuild in this case) set to pause on reaching the warning temperature and resume when dropping 2 degrees. Unfortunately, my new disk that's having the data rebuilt onto it is getting quite rather hot, so it triggered the thermal pause. I manually spun down disks to let everything cool down a bit, then hit the "Resume" button to manually restart the data rebuild. A while later, I think after it had automatically paused/resumed again (though I don't recall at this point), I looked at the Main screen again and the button text read "Pause" and the "Elapsed time" display read "50 minutes (paused)". i.e. the button text read "pause" when the process was actually paused and it should have read "resume". To reproduce: 1) Set Parity Check Tuning to pause during a check/rebuild based on temperature 2) Shut off air flow through your test server 3) Start a parity check 4) Wait for a drive to start cooking 5) Manually resume the check while the drive is still hotter than PCT's "resume" temperature 6) Leave the Main page open, monitoring temps and check progress 7) At some point, the drive will get hot, PCT will pause the check and the text will be out of sync with the current check activity Priority level set to "annoyance" because it does seem to get itself back in sync if PCT is allowed to do its thing without interference. I did not think to grab diagnostics while the display was out of sync, this is fresh as this report is being created and while the display is in sync. nas-diagnostics-20210630-0957.zip
-
Did you do an upgrade recently? There was a change in the default behavior of docker networking - even for existing docker installs. I don't recall if it was the 6.8 or 6.9 release that did this, but I noted similar issues. If you look at the Docker page, you should see that many/all of them are on a 172.* subnet. Can't explain all the details to you, I'm sure someone will stop by who can, but it was intentional and it did cause me a few headaches. Ended up having to reconfigure a few things from the 172.* network to the 192.168.* IP address to talk "back" to the server that way.
-
At the time, there was nothing that I'm aware of that was writing to Disk8. I had a file downloading, but that had completed before I witnessed the CPU pinned for a minute or two. Unless, of course, it was caching at the server or drive level and the download had completed but it wasn't finished actually writing to disk. As related to the other issue I posted (that you addressed a couple of hours ago), I think I'm going to swap my new 8TB drive for the current disk8, just to get it out of the mix and see what happens. If all goes well in that scenario, I might consider adding this current disk8 back into the array, moving the contents of the 2, quite old, 4TB drives to it (controlled moves overnight where there should be nothing else going on) and excluding this particular drive from all shares to prevent additional writes from going to it. Or, I may just bite the bullet, pick up another non-SMR drive, and replace the two 4TBs with that.
-
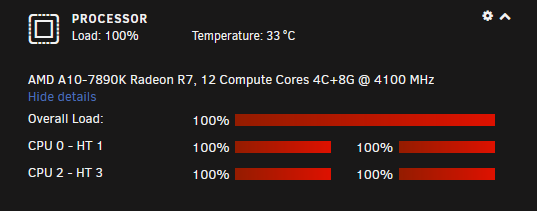
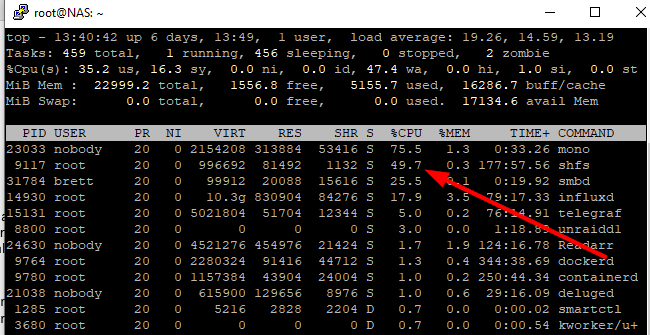
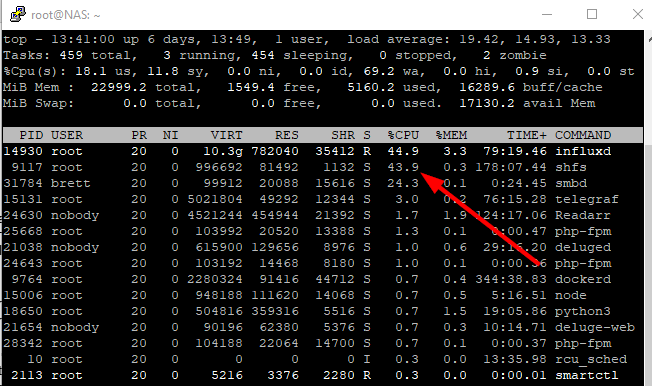
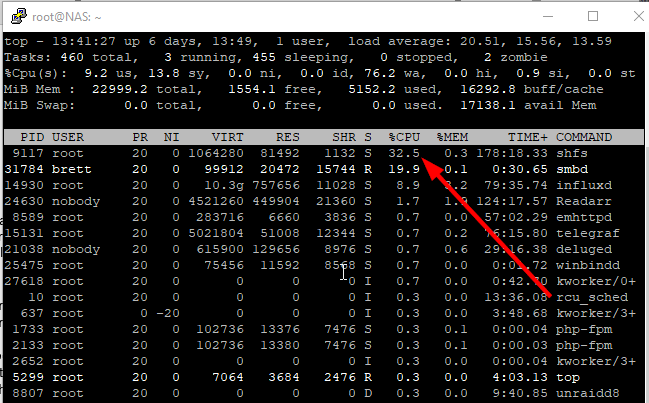
Again this afternoon, I've run into this: and it's been like that for several minutes - no jumping around, just pegged. I grabbed a couple of screen shots from top showing shfs taking a fair amount of CPU: and I grabbed diagnostics again. nas-diagnostics-20210628-1344.zip I discovered this page which seems to indicate that shfs may no longer be relevant. I don't recall what distro UNRAID is based on, but Arch, at least, seems to be deprecating it. Also, the server's been quite busy most of the day today Any insight whatsoever to what may be causing this or how to figure out what's causing it would be most appreciated!
-
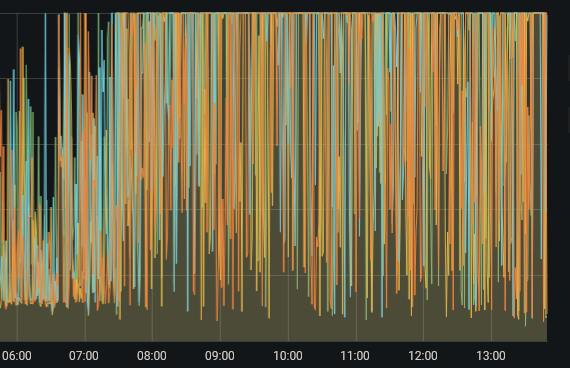
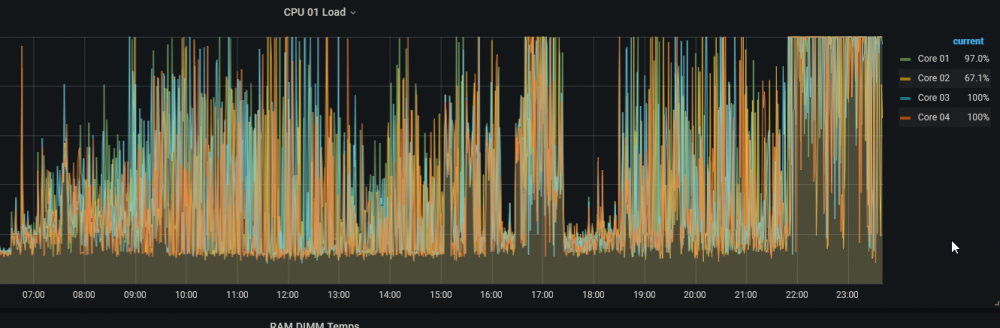
CPU utilization since 07:00 today: I just rebooted the server. The wife wants to watch a race, and that takes a higher priority than gathering more info. Anyone have any ideas what might be causing this or suggestions on how to find out what is?
-
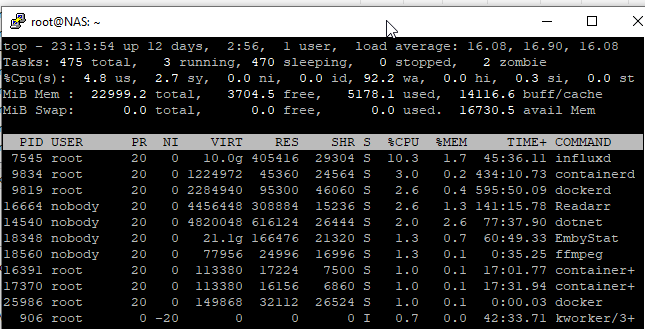
OK, I don't have the CPU completely pinned at the moment, but the server's becoming unusable. I've got 2 torrents downloading at ~1Mb/s or less, and I'm trying to play a video on my Kodi box, but it simply won't start - it spins for 30-60 seconds then goes right back to the menu like nothing ever happened. I did just talk to my son who is upstairs watching videos on his laptop. He's using a web-based Emby client, watching over WiFi with absolutely no problems what so ever. I'm seeing a lot of this in top: Here are the diagnostics that I just pulled while this is going on: nas-diagnostics-20210621-2313.zip Any suggestions?