





kennymc.c
Members
-
Joined
-
Last visited
Everything posted by kennymc.c
-
Did you put the 4 variables from your link into the Unraid container config?
-
You should be able to add any Grafana configuration option (https://github.com/grafana/grafana/blob/main/conf/defaults.ini) from the ini file as an environment variable. The name always has the following format: GF_name of the section (shown in square brackets in the ini file)_name of the option. It might work if you put home assistant on the same docker network as grafana and do not expose the grafana UI port to the host. But maybe iFrames still won't work with it, because they have to be seen by the host as well. I have not tested this myself. Otherwise it could be solved with a firewall config in the Grafana container but I don't have enough experience with that.
-
I am also noticing 204 errors with v1.x but data actually seems to be written to InfluxDB. Currently running v1.x and v2.x simultaneously with telegraf v1.20.2-alpine writing to both versions. But in v2.x no errors appear. I never noticed these errors when I only had one version running.
-
@Skitals Are the above problems after a My Servers plugin update caused by the Theme Engine plugin? If so, when can we expect a fix for this?
-
Habe das selbe Problem mit Unraid 6.9.2, macOS 11.6 Big Sur und Safari 15. Hängt eventuell mit Safari 15 Update von vor ein paar Tagen zusammen, da es bei mir vorher nicht aufgefallen ist. Leider zeigt die JavaScript Konsole keine Fehler an:
-
I changed the fan speed minimum on the Fan Control/Fan Settings tab in the IPMI plugin page. When I originally installed my sever I set this to 31.2% since this was the threshold where my fans were not reporting a 0 rpm reading when they are running with their lowest speed. Noctua fans do not seem to be able to report rpm readings under 300 rpm although they actually might be running slower for a short time. Instead a 0 rpm reading is reported and causing all fans to speed up. I never saw this issue with one my cpu fans from Scythe which should even be able to be running 50 rpm slower. Maybe this is related to some special voltage tuning from Noctua to reducing noise.
-
The same happened to me this morning. All fans suddenly started to run at full speed although I didn't change anything in the fan control config. There are no fan log entries or higher temperatures occurring at the time it happened. After turning fan control off and on again all fans are running normal for about 15-35 minutes but then start to rotate with full speed again. ps -aux | grep ipmifan shows the php ipmifan script as running during this time. I'm also using a Supermicro X11SCH-LN4F Board which is the same board as yours but with 4 NICs. Did you find a solution for this or or has it not happened since? Edit: I tried to set the fan speed minimum to a higher level to not get a 0 rpm reading from a fan which will result in supermicros fan control take over and speeding up all fans due to a hard-coded failsafe feature in Supermicro boards. Low-rpm fans like Noctua will sometimes report 0 rpm for a short time although they still rotating with very low speed. Restarting the ipmifan script will takeover the fan control from the Supermicros failsafe control. Since I haven't re-adjusted the fan speed minimum recently I'm wondering why this happened today? Nevertheless the fans still speed up and now in an even shorter period. Restarting the server didn't help. Changing the minimum values and clicking on Apply will also reset all fans to normal speed. I tried to run the script with --debug but there were not entries during the time the fans speed up. I suspect the Supermicro failsafe is somehow involved in this but I can't seem to get telegraf to log the rpms in a shorter interval than 1 minute although I set the global metric to 10 second. Edit 2: Like I assumed it was one specific fan that was running too low for a short time. I had to adjust the minimum threshold from approx. 30 to 50 percent until the fan was not reporting 0 rpm after a while. Since I didn't change any thresholds or minimum I am still wondering why this happens today and there have never been such problems in the last 7 months since the sever has been running. Perhaps the electronics of the fan have been somewhat affected by the continuous operation? Are there other reasons why something like this could occur?
-
Just installed 6.9.2 and updated the Unraid.net Plugin. But after that, my custom theme was reset to the basic black theme and I can not load any saved themes anymore. Loading a base theme still works. I testest this in Chrome, Firefox on Safari on macOS. Uninstalling or reinstalling the Unraid.net Plugin didn't help. This console error is shown only in Chrome when I try to load a theme: DevTools failed to load SourceMap: Could not parse content for https://unraid.local/plugins/theme.engine/include/FileSaver.min.js.map: Unexpected token < in JSON at position 0 Edit: Reinstalling the Theme Engine plugin and re-importing my custom theme seems to have solved the problem.
-
Thanks, never noticed this before. I probably reinstalled a previously manually configured container with a ca-template version.
-
I noticed (probably since the 6.9 update) that previously deleted port mappings of docker containers reappear after an update. This causes some containers to no longer start because other containers are already using these ports. Is there any way to prevent this?
-
@kannznichkaufen Did you change the host or container path? The host path can still point to appdata/influxdb. Only the container path needs to be changed to /var/lib/influxdb2.
-
@kannznichkaufen If you're starting a new database with the influxdb/lastest image, it will use influxdb 2.0 which stores its data in /var/lib/influxdb2 according to the Docker hub page. This path is also mentioned in you log. Unfortunately the Unraid Influxdb App Template hasn't been updated, so you have to manually adjust HostPath 1. Maybe @atribe could change the default Host Path to /var/lib/influxdb2.
-
The solution for the non-editable container was to re-download Influxdb from the Apps tab and reconfigure everything like before except the extra parameter --name influxdb wich has caused the problem. As soon as you set it, the container gets in this status. I don't know why because I have other containers also configured with this parameter and their own name and no problems at all.
-
@GuildDarts Yep, that fixed it. I deleted a folder that was twice in folders.json and was set to null children.
-
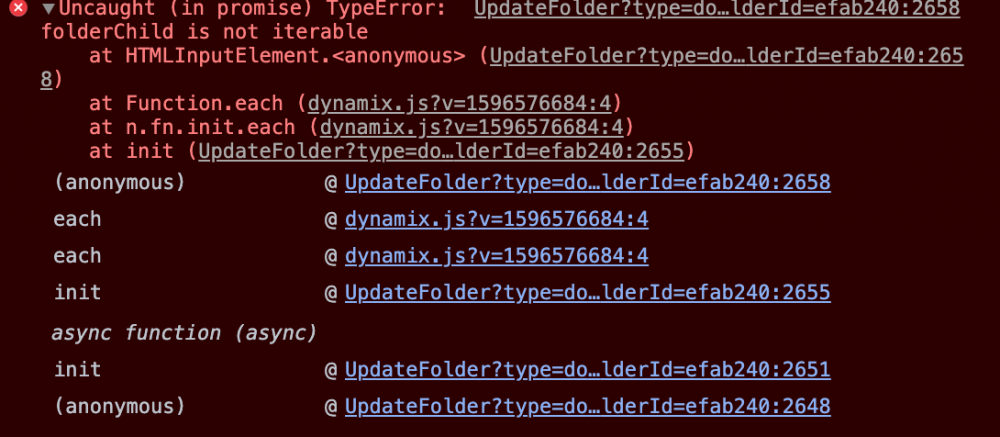
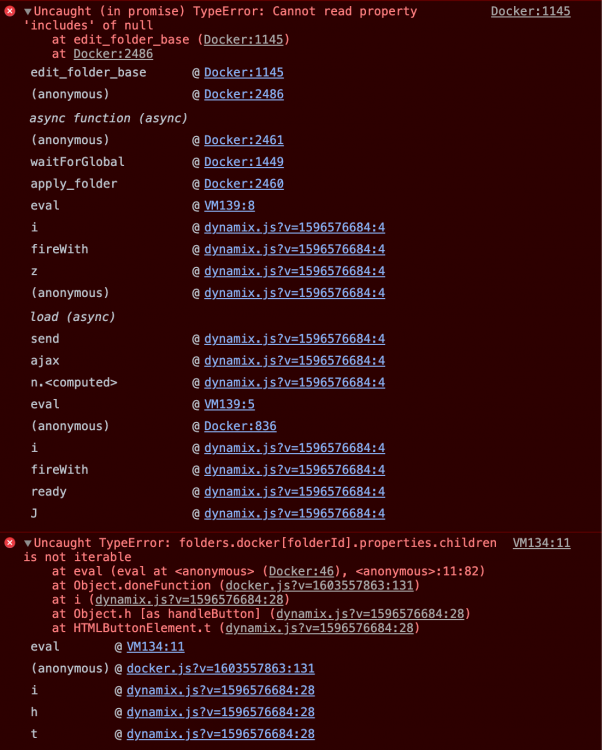
Unfortunately, probably with the 6.9.1 update a few new errors occurred. I can no longer edit folders when I click on them and delete containers / images. The button in the delete popup window has no function. When the plugin is uninstalled, these errors no longer occur. Edit folder: Delete Container / include Image:
-
When trying to change an option in Settings/Management Access and then clicking Apply, nothing happens and the option is reset after reloading the page. This error does not occur on other settings pages. I could reproduce the error with 6.9.0 and 6.9.1 in Safari and Chrome. Edit: Just changed the language to English and now it works. Seems to be a problem with the translation. Edit2: Have tried it with a few different language packs (Dutch and French) and only the German one seems to have this problem. These are the outputs from the console: Safari: Chrome:
-
When I try to start the container it immediately stops after creating the username and privkey.pem with this error: httpd: Syntax error on line 159 of /usr/local/apache2/conf/httpd.conf: Cannot load modules/mod_ssl.so into server: Error relocating /usr/local/apache2/modules/mod_ssl.so: SSL_CTX_set_post_handshake_auth: symbol not found Enable SSL is set to selfsigned I noticed that the image hasn't been updated for over 2 years. Could this lead to security issues? Edit: @mgutt This image will not work with SSL enabled according to https://github.com/BytemarkHosting/docker-webdav/issues/5. I'm now using the k3vmcd/webdav fork instead which fixes this problem.
-
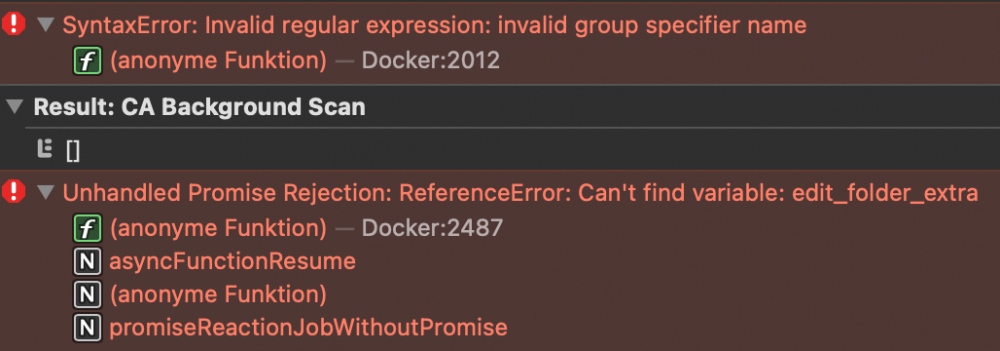
It did work on safari before the latest update. JavaScript console shows these errors:
-
Leider gibt es in der 6.9 Stable mehrere Stellen, an denen die Übersetzung fehlt (vor allem CA) und diese nicht auf der Missing Translations Seite auftauchen. In der englischen Repo tauchen diese Stellen schon auf. Muss man also darauf warten, dass diese neuen Zeilen auch in den einzelnen Sprachen Repos auftauchen? Wo sollen Vorschläge für alternative Übersetzungen gepostet werden? Als Issue auf Github? Ich würde z.B. Credits in den Apps eher als Danksagungen und Changelog mit Versionshinweise übersetzen.
-
@GuildDarts Thanks for the quick fix but now I have problems in Safari. Only one of the folders shows up, but the buttons, the overview of the containing containers and the frame are missing. But it can be edited. The Add Folder button doesn't work either. In Chrome and Firefox, on the other hand, it looks fine.
-
I already use the theme engine plugin but the dark grey and black background colors seems to be hard coded to the black base theme. So I will wait for a fix then.
-
Just realized, that the preview log button and also the Webgui buttons are actually there but I cloud't see them because I use a dark theme. So the problem is more the transparent background, which did not exist before.
-
Updated to 2021.03.07 but the preview log button is still missing. Re-install did not help either.
-
Has the Log button also disappeared with the 6.9 update? This is now only possible via the context menu. In the folder settings there is also no possibility for it.
-
Is there a workaround for the disk spin down issue after the 6.9 update caused by, among other factors, the telegraf hddtemp plugin? Also I noticed since a few days that I can't edit the influxdb container anymore. I could imagine that this came with the 2.0 change of the latest image. In the GUI the name is just white and no longer clickable. The entry in the conext menu is also missing. Before the 6.9 update I could not update the container. The container name was blue and when I tried to update, I got the message that the configuration could not be found. But the XML file on the flash exists and is exactly the same size as on a flash backup when everything was normal. Also a reinstallation of the 1.8 image, including deleting the previous image and deleting and recreating the config did not bring any improvement.




