


kennymc.c
Members
-
Joined
-
Last visited
Everything posted by kennymc.c
-
Updated to 7.3.2 and had the same issue as with the last update where some docker containers didn't show up and needed to be deleted with docker rm and re-created. Not sure why this happened again with other containers than before.
-
Updated from 7.2.6 to 7.3.1. After this update some of my Docker containers couldn't be started or added anymore. Restarting the Docker service didn't help. Syslog showed these messages for 16 of my 23 containers: Error response from daemon: RWLayer of container daa275f951b3161f2e6983e90bbe1d9142c99f5dc3b8b593c3bbdc389a1c73fb is unexpectedly nil The workaround was to manually delete all affected containers withdocker rm containerid and then add them again through the ui. I heard that the migration to a new Docker version in 7.3.0 could have caused this. It would still be a better user experience if Unraid could show these corrupted containers on the Docker page and offer to re-create them or even do this automatically.
-
The update assistant still shows 7.0.1 as the current stable release. Please update it to use the latest version of Unraid (7.1.2)
-
Just found it in the dropdown search results. Didn't show up when directly searching for ram-disk
-
I can't find this plugin in CA. Does it need to be installed manually?
-
Can anyone confirm the script also works with 7.0.1?
-
I have the same Unraid and plugin version and still see all container when editing or creating a new folder. Maybe a specific docker image you all using is causing this?
-
That's strange because my user script (trigged by cron and not by UDs auto mount) waits 60 seconds for the drive to be unmounted, sends a push message if it takes longer and then waits another 10 seconds until the power plug is toggled. I don't get a push message in these cases. Can this still lead to the above mentioned issues with encrypted drives? umount /mnt/disks/WD_Elements_25A3 while [ "$(mount | grep /mnt/disks/WD_Elements_25A3)" ] do sleep 1 DOWNCOUNTER=$((DOWNCOUNTER + 1)) if [ $DOWNCOUNTER -gt 60 ] ; then # Send Push message exit 1 fi done sleep 10 docker exec fhem perl /opt/fhem/fhem.pl 7072 "set WZ_Plug_HDD off"
-
I sometimes notice that the auto-mount from my external encrypted USB hard disk does not work. The system log then shows the following although I just have one usb drive connected to the server: Feb 16 13:40:22 smartserver kernel: usb 2-1: new SuperSpeed USB device number 7 using xhci_hcd Feb 16 13:40:22 smartserver kernel: usb-storage 2-1:1.0: USB Mass Storage device detected Feb 16 13:40:22 smartserver kernel: scsi host10: usb-storage 2-1:1.0 Feb 16 13:40:23 smartserver kernel: scsi 10:0:0:0: Direct-Access WD Elements 25A3 1030 PQ: 0 ANSI: 6 Feb 16 13:40:23 smartserver kernel: sd 10:0:0:0: Attached scsi generic sg5 type 0 Feb 16 13:40:23 smartserver kernel: sd 10:0:0:0: [sdg] Spinning up disk... Feb 16 13:40:42 smartserver kernel: ...................ready Feb 16 13:40:42 smartserver kernel: sd 10:0:0:0: [sdg] Very big device. Trying to use READ CAPACITY(16). Feb 16 13:40:42 smartserver kernel: sd 10:0:0:0: [sdg] 15627986944 512-byte logical blocks: (8.00 TB/7.28 TiB) Feb 16 13:40:42 smartserver kernel: sd 10:0:0:0: [sdg] 4096-byte physical blocks Feb 16 13:40:42 smartserver kernel: sd 10:0:0:0: [sdg] Write Protect is off Feb 16 13:40:42 smartserver kernel: sd 10:0:0:0: [sdg] Mode Sense: 47 00 10 08 Feb 16 13:40:42 smartserver kernel: sd 10:0:0:0: [sdg] No Caching mode page found Feb 16 13:40:42 smartserver kernel: sd 10:0:0:0: [sdg] Assuming drive cache: write through Feb 16 13:40:42 smartserver kernel: sdg: sdg1 Feb 16 13:40:42 smartserver kernel: sd 10:0:0:0: [sdg] Attached SCSI disk Feb 16 13:40:44 smartserver unassigned.devices: Mounting partition 'sdg1' at mountpoint '/mnt/disks/WD_Elements_25A3'... Feb 16 13:40:44 smartserver unassigned.devices: Using disk password to open the 'crypto_LUKS' device. Feb 16 13:40:44 smartserver unassigned.devices: luksOpen result: Device WD_Elements_25A3 already exists. Feb 16 13:40:44 smartserver unassigned.devices: Partition 'WD Elements_25A3' cannot be mounted. Feb 16 13:40:44 smartserver emhttpd: online: WD_Elements_25A3_56444A5244454B4B-0:0 (sdg) 512 15627986944 Feb 16 13:40:44 smartserver emhttpd: read SMART /dev/sdg However after this happend, I can mount it manually without any problems or switch it off and on again and then the auto-mount works again in most cases Feb 16 13:42:36 smartserver unassigned.devices: Mounting partition 'sdg1' at mountpoint '/mnt/disks/WD_Elements_25A3'... Feb 16 13:42:36 smartserver unassigned.devices: Using disk password to open the 'crypto_LUKS' device. Feb 16 13:42:39 smartserver unassigned.devices: Mount cmd: /sbin/mount -t 'xfs' -o rw,relatime '/dev/mapper/WD_Elements_25A3' '/mnt/disks/WD_Elements_25A3' Feb 16 13:42:39 smartserver kernel: XFS (dm-5): Mounting V5 Filesystem f4d2d3da-164f-403b-9b1e-9ef13ee04ad1 Feb 16 13:42:40 smartserver kernel: XFS (dm-5): Ending clean mount Feb 16 13:42:40 smartserver kernel: xfs filesystem being mounted at /mnt/disks/WD_Elements_25A3 supports timestamps until 2038-01-19 (0x7fffffff) Feb 16 13:42:40 smartserver unassigned.devices: Successfully mounted '/dev/mapper/WD_Elements_25A3' on '/mnt/disks/WD_Elements_25A3'. Feb 16 13:42:40 smartserver unassigned.devices: Adding SMB share 'WD_Elements_25A3'.
-
Is it a know issue for containers from a compose stack that they are missing buttons for logs, console etc. and have a big gap on the right side?
-
Ok, using the full path with /app/duplicati/duplicati-server-util seems to work although I was already in the same directory.
-
Yes
-
Unfortunately I cannot find a file with this name in this folder. When calling duplicati-server-util login I get a not found error.
-
The last 2.1. update seems to have change quite a bit for as well. The command line tool I've used (https://github.com/Pectojin/duplicati-client) to run and monitor backups doesn't seem to work anymore. The release notes mention a new "Duplicati.CommandLine.ServerUtil.exe/duplicati-server-util." tool that should now be included but I could find a way to find or start it within the container. Maybe that a problem of the linuxserver container which doesn't include that tool? Downgrading to 2.0.8 was possible but I had to use the automatically created backup of the old Duplicati-server.sqlite file in the mounted config folder to get the container running again.
-
Has anyone checked this with 6.12.13?
-
The included Update Assistant tool still shows 6.12.10 as the latest version. Is this a know issue as the update process has changed with the previous version?
-
Ich habs mal korrigiert. Ist aber auch im Englischen nicht eindeutig, da es eher nach einer Statusangabe klingt als der Name für einen Button, der eine Aktion auslöst.
-
I already solved the problem. See my comment at the top of the post. Where does it show 0 rpm? If I let IPMI control all or some of the fans they will always run at full speed. Even with fan thresholds adjusted my Noctua fans will sometimes report a false rpm to trigger the IPMI fan failure control that lets all fans run at full speed. With this plugin I can set a minimum speed to not trigger this behaviour. With 30% minimum speed they still run at 300 rpm. Seems to be a know problem with this brand.
-
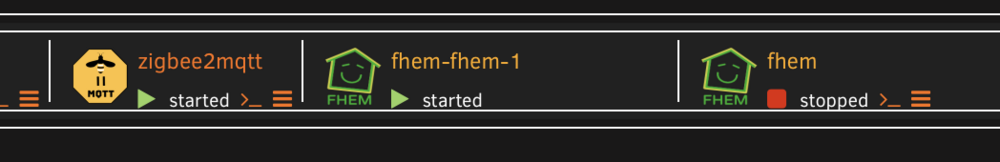
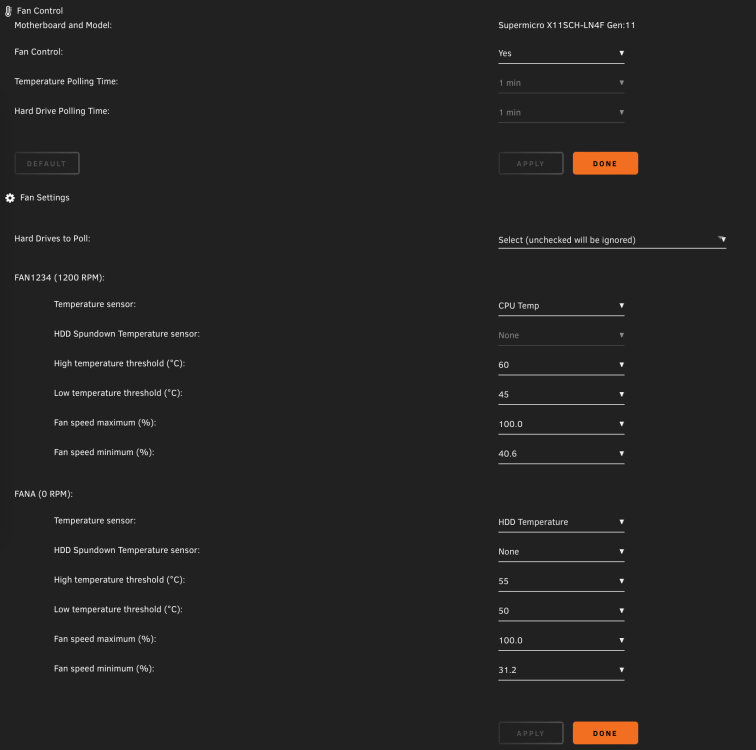
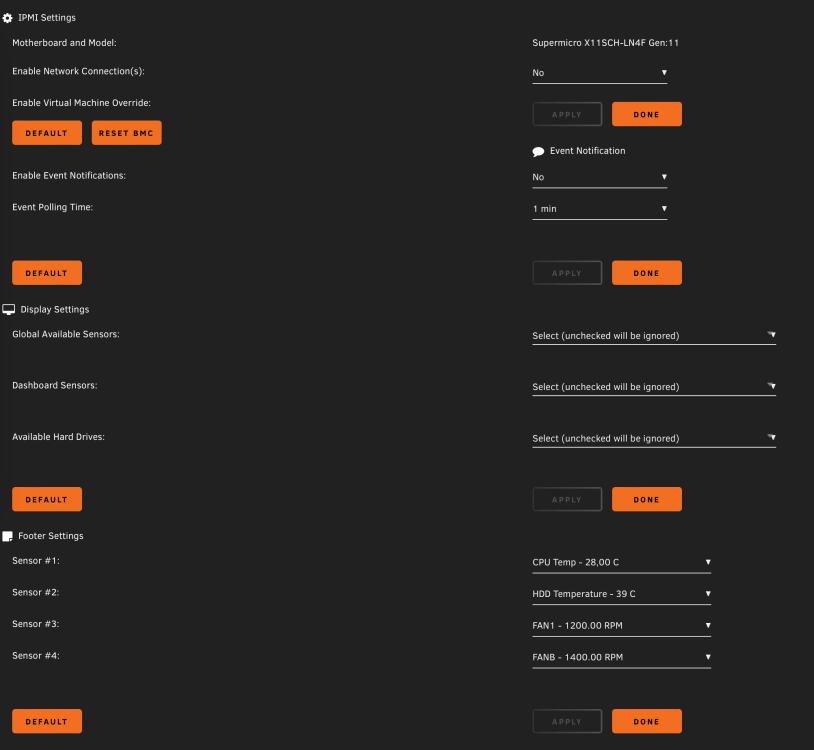
Edit: Solved by resetting the BMC and then restarting fan control I am also having problems with all my fans running at full speed after upgrading the BIOS and BMC firmware of my Supermicro board today. I already tried stoping and starting fan control, adjusted the minimum fan speed and also did a system reboot. Fan thresholds have been adjusted to match the low rpm of my Noctua fans. This is the fan log: 2024-02-03 18:37:39 Starting Fan Control 2024-02-03 18:37:39 Board: Supermicro Board Model: X11SCH-LN4F 2024-02-03 18:37:39 SM Board selection: 11 2024-02-03 18:37:39 Setting fans to full speed 2024-02-03 18:37:49 Fan:Temp, FAN1234(33%):CPU Temp(30C), FANA(28%):HDD Temp(Spundown) 2024-02-03 18:41:50 fan control config file updated, reloading settings 2024-02-03 18:41:50 Fan:Temp, FAN1234(41%):CPU Temp(29C), FANA(31%):HDD Temp(31C) 2024-02-03 18:41:51 Stopping Fan Control 2024-02-03 18:41:51 Setting fans to auto 2024-02-03 18:41:56 Starting Fan Control 2024-02-03 18:41:56 Board: Supermicro Board Model: X11SCH-LN4F 2024-02-03 18:41:56 SM Board selection: 11 2024-02-03 18:41:56 Setting fans to full speed 2024-02-03 18:42:06 Fan:Temp, FAN1234(41%):CPU Temp(28C), FANA(31%):HDD Temp(31C) And these are my settings:
-
Das Problem ist, dass die json Dateien für den Docker Healthcheck alle 5 Sekunden immer wieder mit dem fast selben Inhalt überschrieben werden. Nur der Timestamp ändert sich. Der Bug ist auch hier beschrieben:
-
Since you even get this notification when notifications are disabled I would definitely prefer an option to disable the success notification. I first thought this was a bug. I also only want notifications when something goes wrong. Everything else can be found in the sys log.
-
I think I have solved the problem: I simply stopped the array while the USB hdd was turned on and mounted. When the USB hdd then also got unmounted, I switched it off and restarted the array, waited a while and stopped it again. The messages in the log did not appear anymore. Starting the array worked again without any problems.
-
That is my backup usb hdd which only gets powered on during weekly backups. Strange that this only happens when the array is stopped and when the hdd is not powered on. I assume I should run xfs_repair? Which /dev should I choose? There is no dm-5 in /dev, just dm-1 to 4. I tried it with the corresponding id sdf and sdf1 but this results in bad primary superblock - bad magic number !!! shortly after starting a dry run. I let it run with sdf for many hours (8 TB hdd) but it ends with Sorry, could not find valid secondary superblock Do i have to add something because the drive is luks encrypted?
-
It happens as soon as you stop the array and then the callback messages reappear every minute until the array is restarted. Diags have been saved after the array has been stopped and restarted around two minutes later. smartserver-diagnostics-20230926-1942.zip
-
Ok, I created a PR so that it matches the current English translation file.


